Ecological Interactions: Predation, Competition, and Mutualism
1/142
There's no tags or description
Looks like no tags are added yet.
Name | Mastery | Learn | Test | Matching | Spaced |
|---|
No study sessions yet.
143 Terms
Introduced species
Species that are introduced to a region of the world where it has not historically existed, generally by human activity, either accidentally or on purpose.
Invasive species
Introduced species that spreads rapidly and has negative effects on other species, human recreation, or human economies.
Biological control
Introducing species to help control the abundance of another species.
Benefits of biocontrol
Environmental safety because agents are typically non-toxic to humans, animals, and plants, and it is cost-effective once established, promoting natural ecosystem balance.
Unintended consequences of biocontrol
Nontarget effects where sometimes non-target species are affected, unanticipated spread, resistance development, and long-term ecological changes.
Mesopredator
Relatively small carnivores that consume herbivores and are not at the top of food chains.
Top predators
Predators that consume both herbivores and mesopredators and are at the top of the food chain with no natural predators of their own.
Functional response curve
The relationship between prey density and an individual predator's rate of food consumption, showing how many prey are available and how much the predator eats.
I response
Results in a constant proportion of prey being consumed prior to satiation, with predator's prey consumption rate increasing linearly with prey density until satiation.
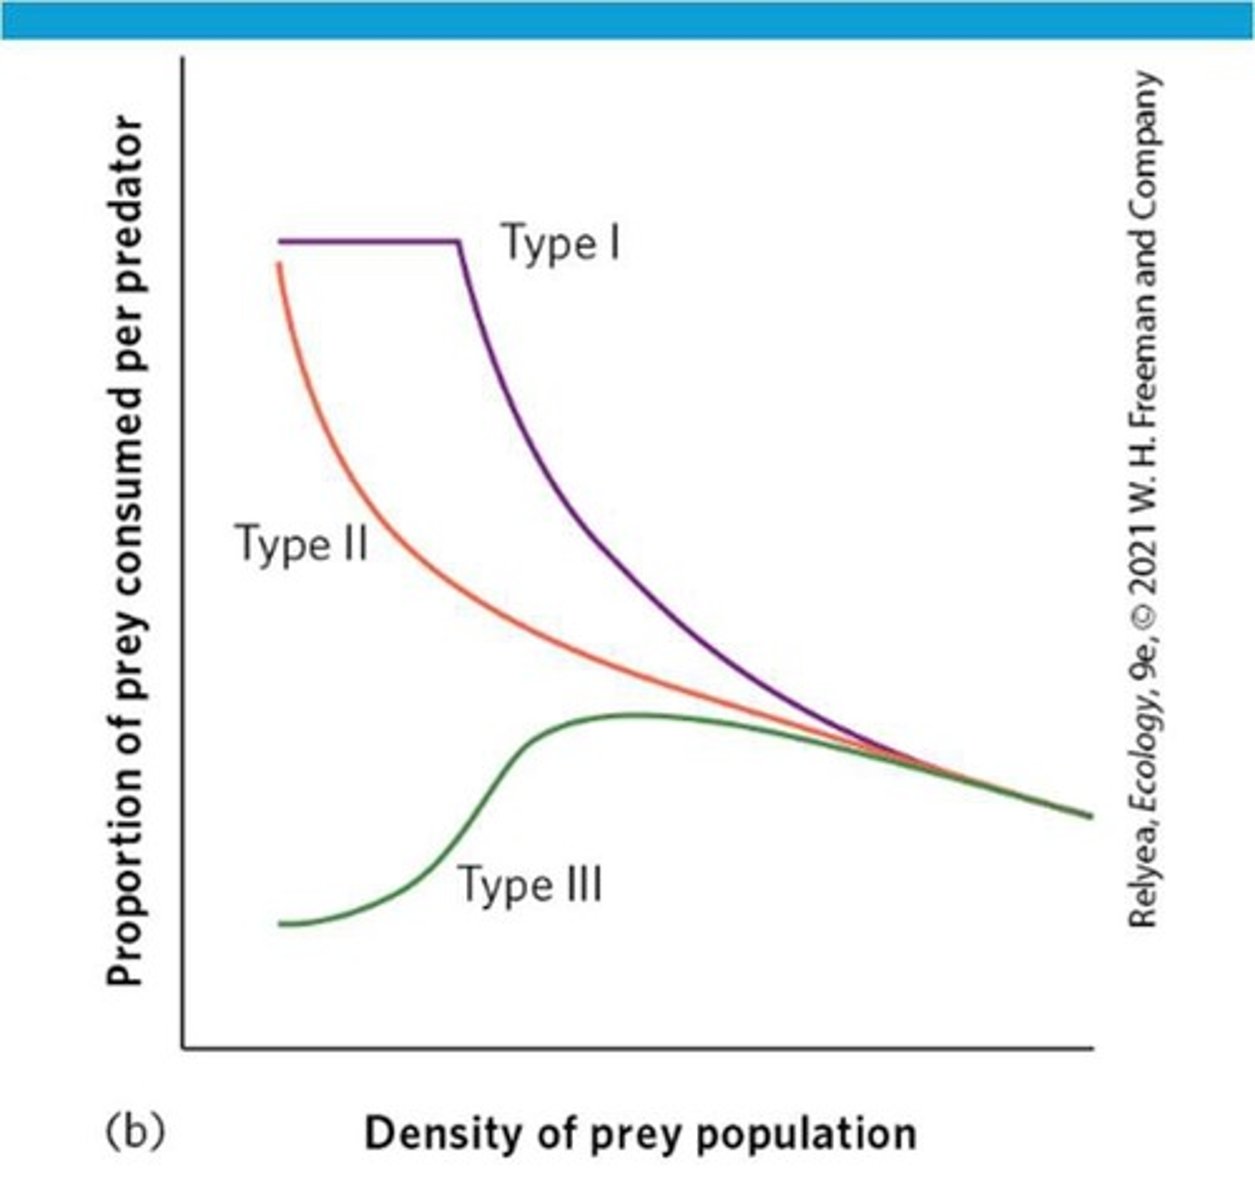
II response
Results in a decreasing proportion of prey being consumed as the predator's rate of prey consumption begins to slow as prey density increases and then plateaus when satiation occurs.
III response
Predator exhibits low prey consumption under low prey densities, rapid consumption under moderate prey densities, and slowing prey consumption under high densities, forming an S curve.
Functional response vs. numerical response
Functional response describes how one predator changes its rate of prey consumption as prey density increases, while numerical response describes how the number of predators in an area changes as prey density increases.
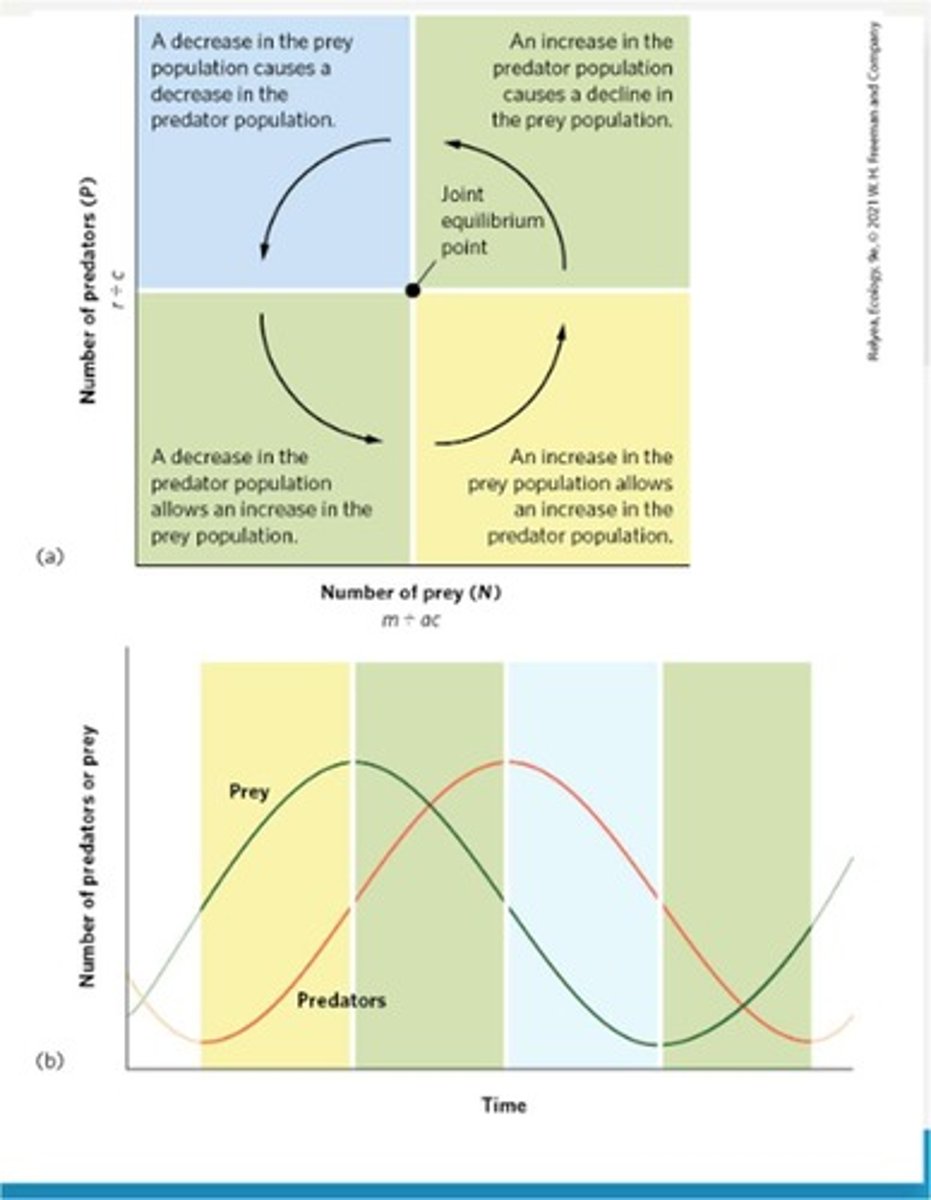
Lotka-Volterra model
Model of predator-prey interactions that incorporates oscillations in the abundances of predator and prey, foundational for understanding these dynamics.
Prey population (N)
The population of prey in the Lotka-Volterra model.
Predator population (P)
The population of predators in the Lotka-Volterra model.
Prey growth
Prey grows exponentially unless eaten by predators.
Predator decline
Predators starve and decline when prey becomes scarce.
Prey recovery
With fewer predators, prey population recovers.
Cycle repeats
The cycle of predator and prey populations continues to oscillate.
Example of functional response
A wolf eats more deer when more deer are around.
Example of numerical response
More hawks move into a field full of mice as prey density increases.
Equilibrium Isocline
Population size of one species that causes the population of another species to be stable, aka zero growth isocline.
Joint Population Trajectory
Shows how predator and prey change over time, together.
Equilibrium Point
Shows where both species are at equilibrium isoclines at the same time, predator and prey population growth both equal zero.
Predation and Herbivory
Favor the evolution of defenses.
Behavioral Defenses
Examples include alarm calling, spatial avoidance, temporal avoidance, herding/flocking, thanatosis/playing dead, mobbing, distraction displays.
Crypsis
A physical defense, ability of an organism to blend into its environment, aka camouflage.
Structural Defenses
Built in, physical traits reducing chances of being attacked, such as spines/quills, shells, thick skin/scales, camouflage/crypsis, false eyes/warning shapes.
Warning Coloration
Aposematism; using bright/bold colors or patterns to signal predators of toxicity.
Batesian Mimicry
Palatable species evolve warning coloration that resembles unpalatable species, diluting the message of aposematism.
Mullerian Mimicry
When several unpalatable species evolve a similar pattern of warning coloration, reinforcing the message of aposematism.
Aggressive Mimicry
Predator/parasite mimics harmless/appealing organism to lure prey, e.g., orchid mantis.
Coevolution
When two or more species affect each other's evolution; the fitness of one organism affects the fitness of another.
Horizontal Transmission
Parasite moves between individuals other than parents and offspring, spreading quickly through populations.
Vertical Transmission
When a parasite is transmitted from parent to offspring during birth or reproduction.
Reservoir Hosts
Species that harbor parasites without severe symptoms, acting as a source of ongoing infection.
Vector
Living carriers, often insects, that transmit parasites between hosts.
Counterattacks
Parasite counterattacks by evolving resistance to immune responses, hiding inside host cells, changing surface proteins, or manipulating host behavior.
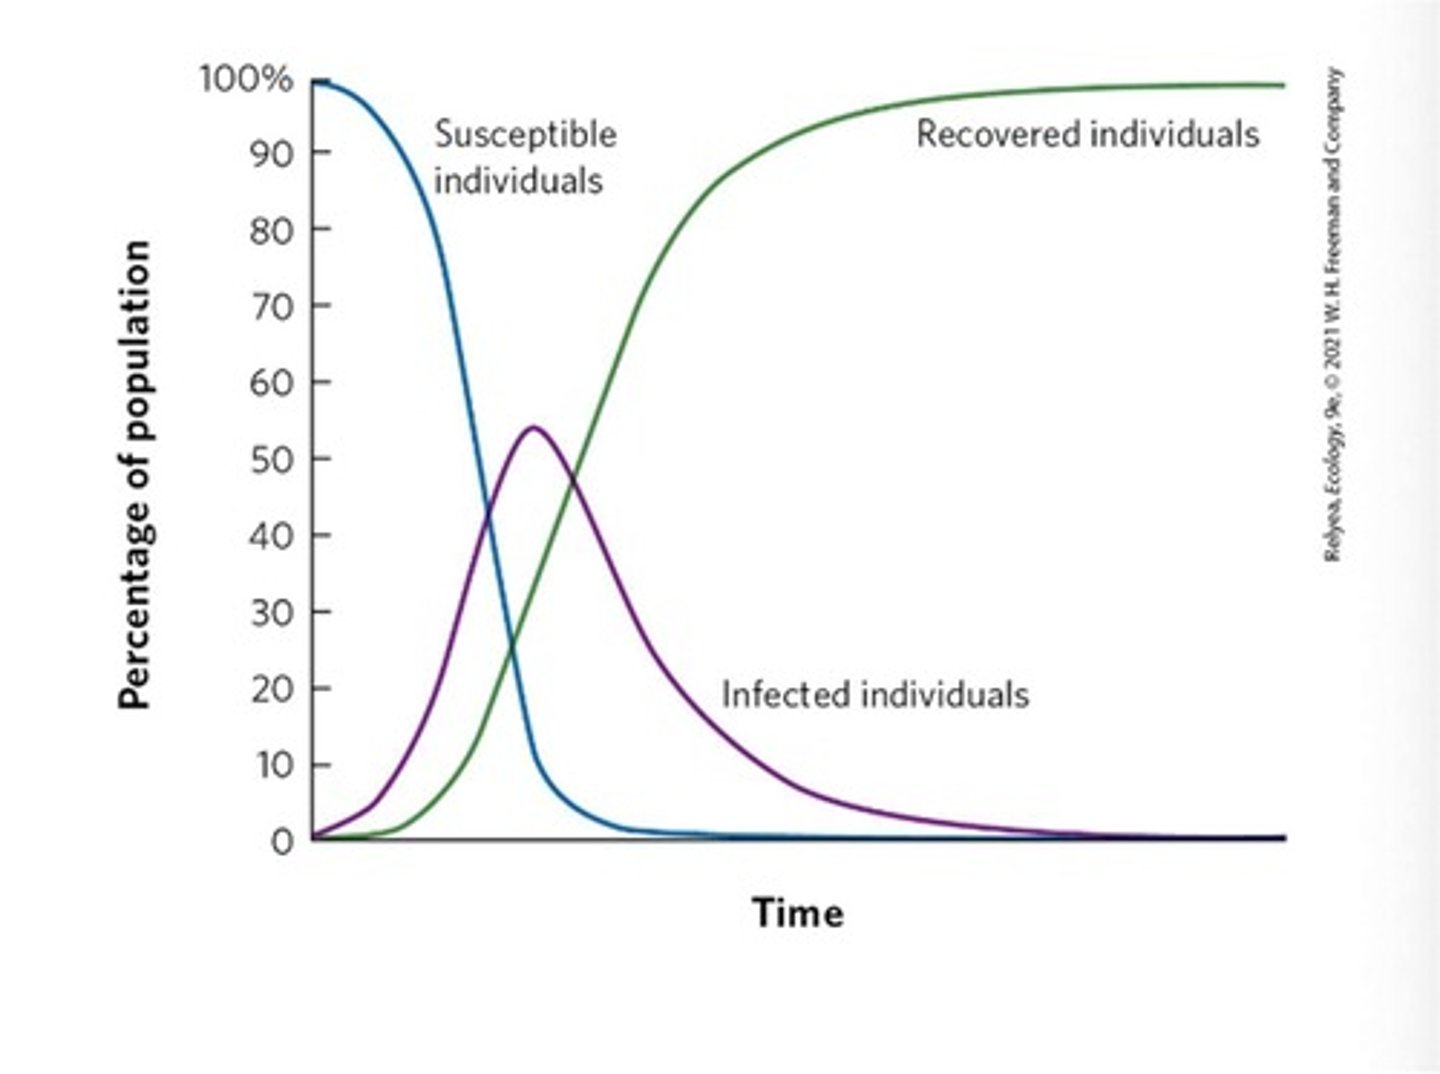
SIR Model
Simplest model of infectious disease transmission incorporating immunity.
Susceptible (S)
Individuals who can be infected.
Infected (I)
Individuals currently infected and infectious.
Recovered (R)
Individuals who recovered, are immune, or are dead.
Infection Dynamics
Susceptibles contact infected individuals, become infected; over time, infected individuals recover or die, reducing active infections.
Initial Infection Growth
When infection is introduced, there is an initial rapid growth in the number of infected individuals.
Population density
High density increases transmission risk.
Resistance
Reduces infection rate.
Tolerance
Reduces harm from infection but not infection rate.
Ectoparasite
Parasite that lives on the outside of an organism, e.g., lice.
Endoparasite
Parasite that lives inside an organism, e.g., prions, bacteria, protozoans.
Intraspecific competition
Competition within a species, e.g., male deer vs male deer.
Interspecific competition
Competition between different species, e.g., deer vs rabbit.
Resource
Anything an organism consumes or uses that causes an increase in the population growth rate when it becomes more available, such as water, food, light availability, and space.
Renewable resource
Resource that is constantly regenerated.
Nonrenewable resource
Resource that is not regenerated and is gone once used up.
Liebig's Law of the Minimum
Population increases until the supply of the most limiting resource prevents it from increasing further.
Competitive exclusion principle
Two species cannot coexist indefinitely when they are both limited by the same resource.
Logistic model
A model that describes how growth slows as population size approaches carrying capacity (K).
Population size (N)
The number of individuals in a population.
Intrinsic growth rate (r)
The rate at which a population increases in size under ideal conditions.
Carrying capacity (K)
The maximum population size that an environment can sustain.
Competitor equivalents
A measure of how many individuals of one species are equivalent to individuals of another species in terms of competition.
Competition coefficients
Weighted contributions of a competitor's population to how they affect the other species' carrying capacity.
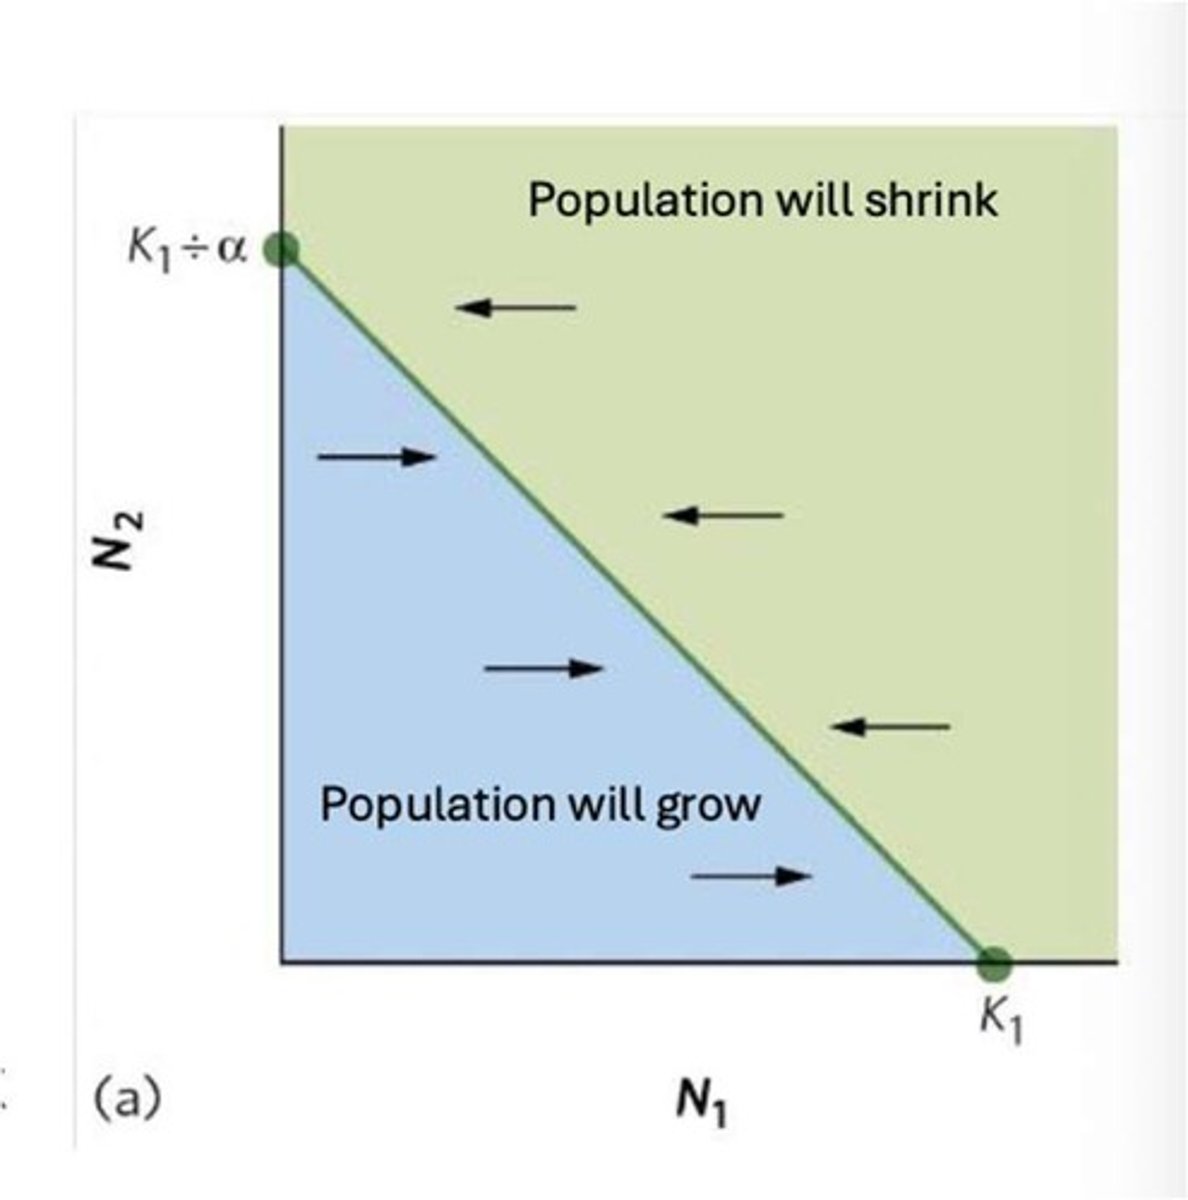
Zero population growth isocline (ZNGI)
The line on a graph where the growth of a species is zero.
Lotka-Volterra model
A model that describes the dynamics of biological systems in which two species compete for the same resources.
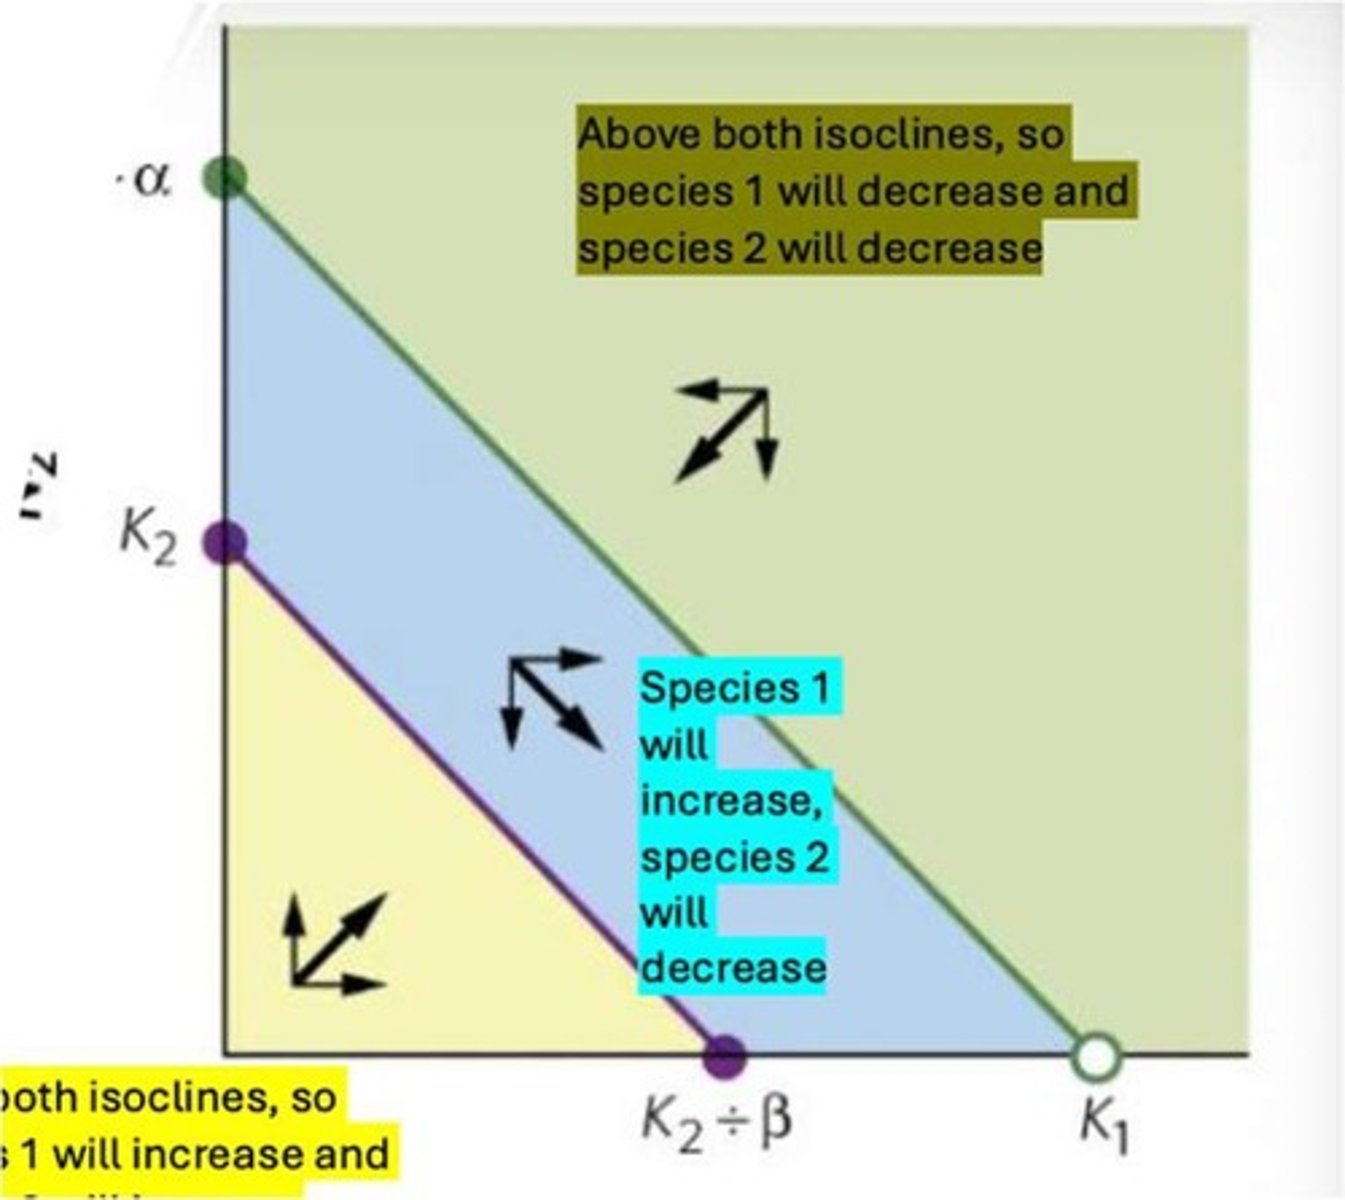
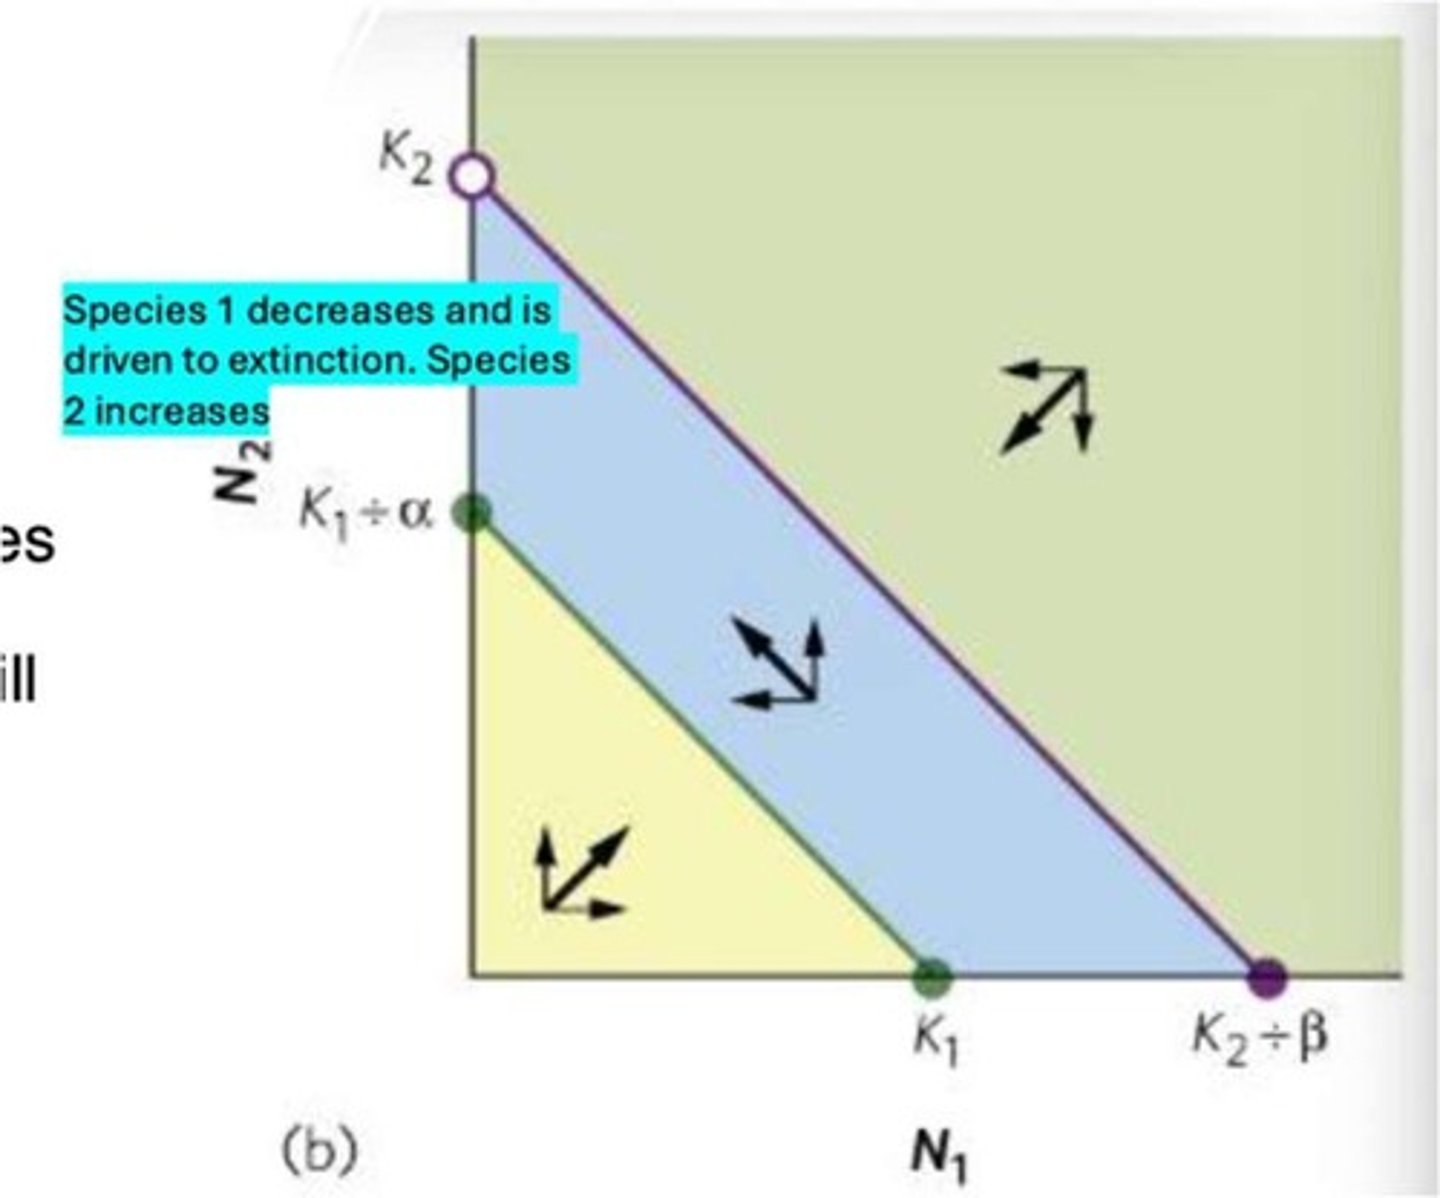
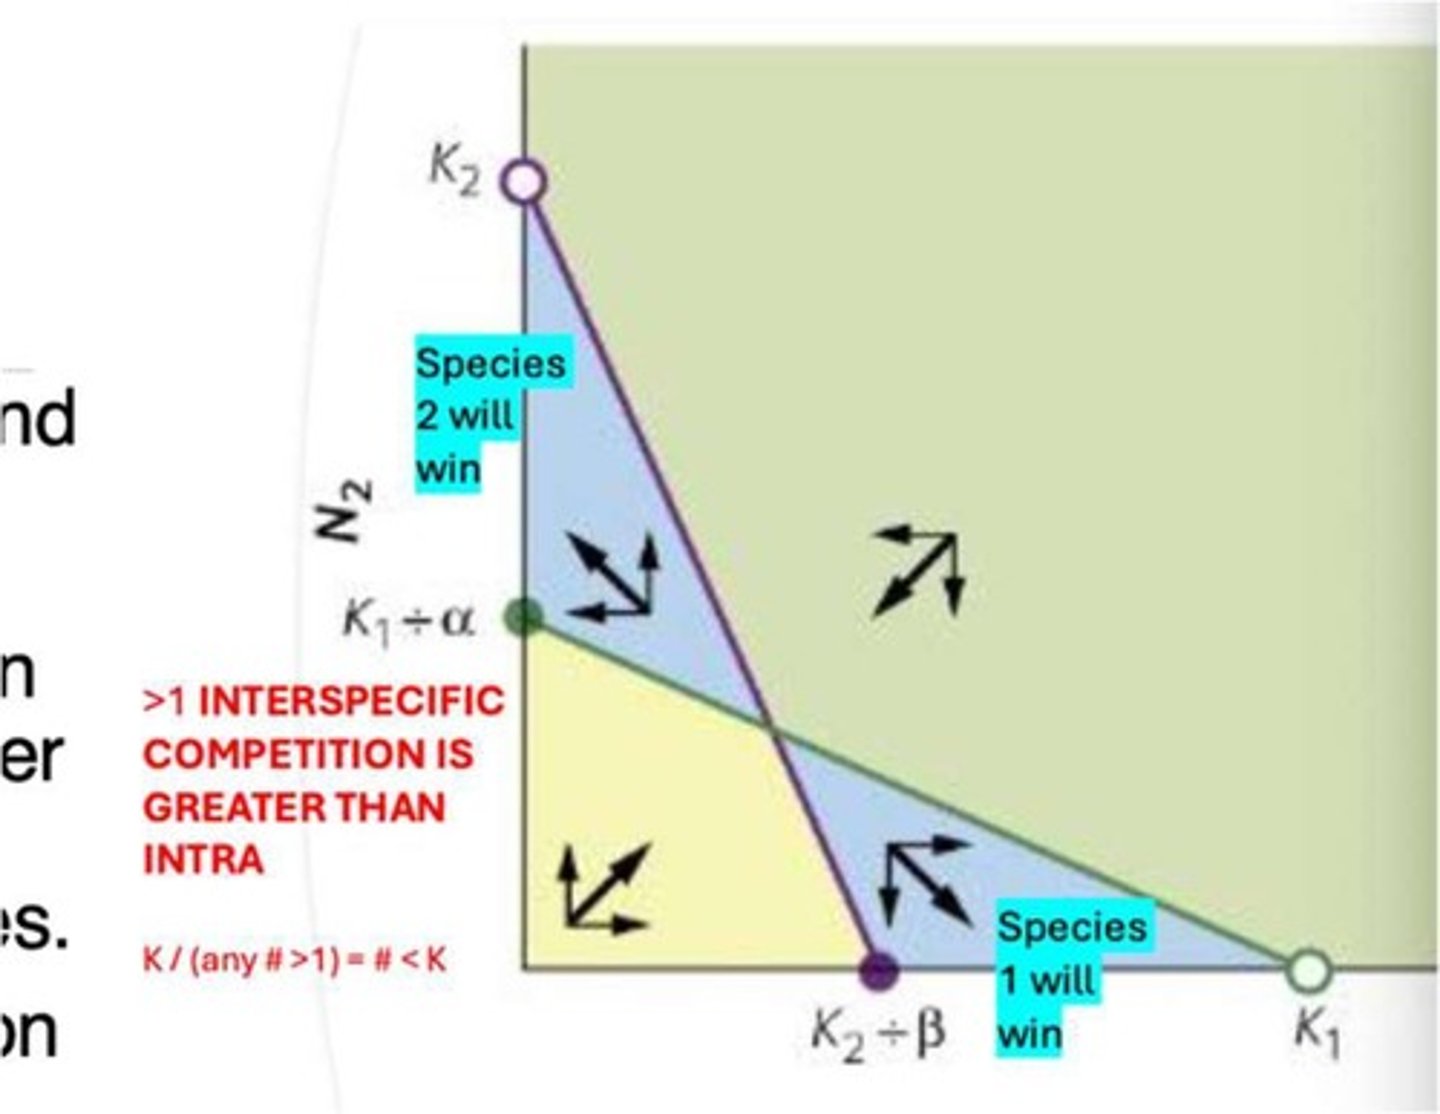
Four possible outcomes of competition
1. Species 1 wins (competitive exclusion), 2. Species 2 wins (competitive exclusion), 3. Isoclines cross with species 1 winning depending on initial populations, 4. Coexistence occurs with isoclines crossing and intra greater than inter.
Definite outcomes
Three of four possibilities have definite outcomes, while one outcome is contingent on various factors.
Initial population sizes
The initial population sizes of the two populations affect the outcome.
Initial carrying capacities
The initial carrying capacities of the two populations affect the outcome.
Competition coefficients
The competition coefficient value for a species would be higher if that species were a better competitor for the resource in question.
Lotka-Volterra Competition model
In the Lotka‐Volterra Competition model, carrying capacity for species-1 is determined by the number of individuals of species-1 and the number of individuals of species-2 (the competitor).
Carrying capacity for species-1
Carrying capacity for species-1 is reached when the reproductive rate of species-1 is zero (r1=0).
Carrying capacity and species-2
Carrying capacity for species-1 is reached when the reproductive rate of species-2 is zero (r2=0).
Competition coefficients concept
Competition coefficients convert the number of individuals between the two competing species into equivalents.
Abiotic conditions
Abiotic conditions such as temperature, moisture, and pH can favor one species over the other.
Disturbances
Disturbances like fire, flood, and human activity can reduce the dominance of a strong competitor, allowing weaker competitors to persist or recover.
Predator-mediated coexistence
Predators may reduce the population of the dominant competitor and give less competitive species a chance.
Exploitative competition
Exploitative competition occurs when individuals consume and drive down the abundance of a resource to the point that other individuals cannot persist.
Interference competition
Interference competition occurs when competitors do not immediately consume resources but defend them, interacting with each other.
Allelopathy
Allelopathy is when organisms use chemicals to harm competitors.
Apparent competition
Apparent competition occurs when two species have a negative effect on each other through an enemy, including a predator, parasite, or herbivore.
Mutualisms
Mutualisms can provide water, nutrients, and places to live for various species.
Mycorrhizal fungi
Mycorrhizal fungi attach to plant roots and help absorb water and minerals, while fungi get sugars from the plant.
Nitrogen-fixing bacteria
Nitrogen-fixing bacteria convert N2 gas into usable forms for plants, while bacteria get sugar and shelter.
Fungal partners in mycorrhizae
Fungal partners in mycorrhizae help plants access water in dry soils.
Ants and acacia trees
Acacia trees provide hollow thorns for ants to live in.
Mutualism
A symbiotic relationship where both species benefit.
Corals and zooxanthellae
Coral provides home, algae provides nutrients through photosynthesis.
Ants and acacia
Ants attack herbivores and plants that get too close to acacia.
Cleaner fish/shrimp
Eat parasites off bigger fish and get food/protection.
Fungi in grass tissues
Produce chemicals that turn herbivores away.
Pollination
Bees, butterflies, bats, birds visit flowers to collect nectar/pollen, transferring pollen between flowers.
Seed dispersal
Fruits eaten by animals pass through digestive systems and are dropped elsewhere with fertilizer.
Ants and seed dispersal
Ants carry seeds to nest, eat fatty parts, and leave seed to grow.
Fundamental niche
Mutualism can expand/limit fundamental niche; without mutualist, species might not be able to establish/persist in a habitat.
Keystone mutualisms
Pollinators/seed dispersers can affect plant abundance.
Community stabilization
Mutualism can stabilize communities by increasing reproduction and survival of species.
Energy flow and mutualism
Mutualism can impact energy flow, productivity, and nutrient cycling.
Antagonistic relationships
Mutualisms can turn antagonistic when conditions change.
Mycorrhizal fungi and plants
In nutrient poor soil, plant benefits greatly; in nutrient rich soil, fungi takes more carbon from plant than gives in nutrients.
Cheating in mutualism
Bees bite into sides of flowers to get nectar without pollinating.