LESSON 1-5 Engineering Data Analysis
1/110
There's no tags or description
Looks like no tags are added yet.
Name | Mastery | Learn | Test | Matching | Spaced |
|---|
No study sessions yet.
111 Terms
STATISTICAL METHODS
used to analyze data from a process to gain more sense of where in the process changes may be made to improve the quality of the process.
designed to contribute to the process of making scientific judgments in the face of uncertainty and variation.
INFERENTIAL STATISTICS
Involves using data from the sample to make interferences or prediction about a larger population
similar to representational statistics (sub-sample from sample)
make generalizations about the population from the sample
inductive (broad to general)
The sample along with ___ allows us to draw conclusions about the population, with ___ making clear use of elements of probability
probability is essential in ___ because it quantifies the uncertainty in drawing conclusions about a population from a sample, enabling us to estimate the likelihood of various outcomes and make informed decisions.
DESCRIPTIVE STATISTICS
provides general information about the fundamental statistical properties of data (e.g. mean, median, mode, variance, standard deviation, etc.)
Measures of central tendency such as the mean, median, and mode summarize the performance level of a group of scores, and measures of variability describe the spread of scores among participants.
can generalize from the population
observe/describe the sample
or deductive statistics
VARIABILITY IN SCIENTIFIC DATA
If the observed product density in the process were always the same and were always on target, there would be no need for statistical methods.
OBSERVATIONAL STUDIES
no assigned factors, simply observe/perceive
no parameters and variables
qualitative research
about experiences, norms, and culture
EXPERIMENTAL STUDIES
with variables and parameters
can be manipulated
MEAN, MEDIAN, MODE, RANGE
4 Descriptive Statistics
MEAN
known as the arithmetic average, consists of the sum of all scores divided by the number of scores.
centroid of the data; it is the point at which a fulcrum can be placed to balance a system of “weights” which are the locations of the individual data.
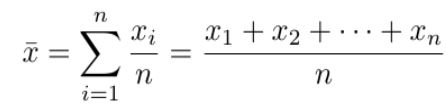
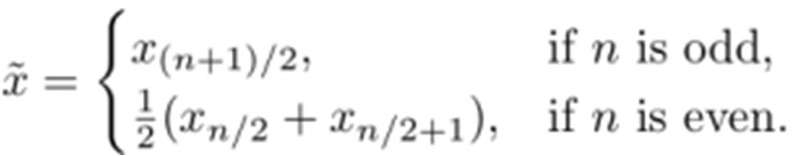
MEDIAN
the value in the center when the numbers are arranged least to greatest
arrange the values of the variable in order—either ascending or descending—and then count down (n + 1) / 2 score
MODE
the most commonly appearing value in a distribution
rarely used measure of central tendency
RANGE
the difference between the largest and smallest number
DATA
facts, figures and information collected on some characteristics of a population or sample
can be classified as qualitative or quantitative data
UNGROUPED DATA
data which are not organized in any specific way
collection of data as they are gathered
randomized raw data
STATISTIC
measure of a characteristic of sample
CONSTANT
characteristic or property of a population or sample which is common to all members of the group.
GROUPED DATA
raw data organized/arranged into groups or categories with corresponding frequencies.
PARAMETER
the descriptive measure of a characteristic of a population
VARIABLE
measure or characteristic or property of a population or sample that may have a number of different values
differentiates a particular member from the rest of the group.
ROLES OF PROBABILITY
Elements of probability allow us to quantify the strength or “confidence” in our conclusions. In this sense, concepts in probability form a major component that supplements statistical methods and helps us gauge the strength of the statistical inference.
CONFIDENCE INTERVAL
A probability that a parameter will fall between a set of values
DATA COLLLECTION
first step in conducting a statistical inquiry
refers to data gathering, a systematic method of collecting and measuring data from different sources of information to provide answers to relevant questions.
PRIMARY DATA, SECONDARY DATA
2 Methods of Data Collection
PRIMARY DATA
first-hand data
data with investigation
ex. Survey/Questionnaire, Interview, Observation, Experiment
SECONDARY DATA
data that already exists but is for other’s uses
ex. Literature Review, Government Database, Commercial Database, Web Scraping
RETROSPECTIVE STUDY, OBSERVATIONAL STUDY, DESIGN EXPERIMENT
3 Methods of Data Collection in the Field of Engineering
RETROSPECTIVE STUDY
use the population or sample of the historical data which had been archived over some period of time.
to make sense of something
examining data observed, stored, and recorded beforehand
similar to secondary data
OBSERVATIONAL STUDY
Process or population is observed and disturbed as little as possible, and the quantities of interests are recorded
qualitative
what is perceived?
susceptible to biases
DESIGN EXPERIMENT
very important in engineering design and development and in the improvement of manufacturing processes in which statistical thinking and statistical methods play an important role in planning, conducting, and analyzing the data.
SURVEYS
depend on the respondent’s honesty, motivation, memory, and his ability to respond. Sometimes answers may lead to vague data.
can be done through face-to-face interviews or self-administered through the use of questionnaires.
6 STEPS IN DESIGNING A SURVEY
Determine objectives/purpose
Identify target population/respondents
Choose an interviewing method
Decide what questions to ask (must be cohesive)
Conduct interviews & collect data/information
Analyze results (graphs & conclusions)
PROBABILITY SAMPLING, NON-PROBABILITY SAMPLING
2 Types of Sampling Methods
SIMPLE RANDOM SAMPLING, SYSTEMATIC SAMPLING, STRATIFIED SAMPLING, CLUSTER SAMPLING
4 Types of Probability Sampling Method
CONVENIENCE SAMPLING, QUOTA SAMPLING, PURPOSIVE SAMPLING, SNOWBALL SAMPLING
4 Types of Non-Probability Sampling Method
SIMPLE RANDOM SAMPLING
Every element in the population has an equal chance of being selected as part of the sample. It’s something like picking a name out of a hat.
offers no control concerning the data
cheap
SYSTEMATIC SAMPLING
random selection only applies to the first item chosen. A rule then applies so that every nth item or person after that is picked.
has a system
clear order/organized
can be biased
STRATIFIED SAMPLING
involves random selection within predefined groups.
determine what aspects of a sample are highly correlated with what’s being measured.
CLUSTER SAMPLING
groups rather than individual units of the target population are selected at random for the sample.
pre-existing groups, such as people in certain zip codes or students belonging to an academic year.
CONVENIENCE SAMPLING
People or elements in a sample are selected based on their accessibility and availability.
biased
QUOTA SAMPLING
aims to achieve a spread across the target population by specifying who should be recruited for a survey according to certain groups or criteria.
ex. only males above 40 years old
PURPOSIVE SAMPLING
Participants for the sample are chosen consciously by researchers based on their knowledge and understanding of the research question at hand or their goals.
SNOWBALL SAMPLING
or referral sampling
People recruited to be part of a sample are asked to invite those they know to take part, who are then asked to invite their friends and family and so on.
similar to Pyramid Scheme
WHAT TYPE OF SAMPLING TO USE?
Define your research goals
Assess the nature of your population
Consider your constraints (scopes & limitations)
Determine the reach of your findings
Get feedback
PURPOSE OF STATISTICAL ANALYSIS
When we conduct a study and measure the dependent variable, we are left with sets of numbers. Those numbers inevitably are not the same. That is, there is variability in the numbers.
DESCRIPTIVE STATISTICAL ANALYSIS, INFERENTIAL STATISTICAL ANALYSIS, PREDICTIVE STATISTICAL ANALYSIS, PRESCRIPTIVE STATISTICAL ANALYSIS, CAUSAL STATISTICAL ANALYSIS, EXPLORATORY DATA ANALYSIS, MECHANICAL ANALYSIS
7 Types of Statistical Analysis
MEAN, MEDIAN, MODE
3 Measures of Central Tendency
STANDARD DEVIATION, VARIANCE
2 Measure of Variability
STANDARD DEVIATION
measure of the dispersion of data points in a dataset, indicating how much the values typically differ from the mean
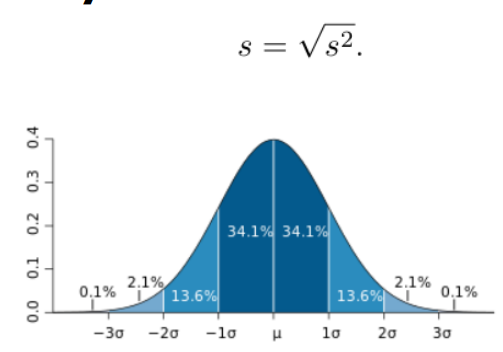
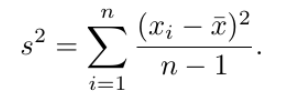
VARIANCE
average of the squared differences between each data point and the mean, indicating the spread of data in a dataset.
DESIGN OF EXPERIMENT
or DOE is a tool to develop an experimentation strategy that maximizes learning using minimum resources
PLANNING, SCREENING, OPTIMIZATION, ROBUSTNESS TESTING, VERIFICATION
5 Steps in Design of Experiment
PLANNING
Identification of the objectives of conducting the experiment or investigation, assessment of time and available resources to achieve the objectives.
SCREENING
to identify the important factors that affect the process under investigation out of the large pool of potential factors.
OPTIMIZATION
to either increase yield or decrease variability or to find settings that achieve both at the same time depending on the product or process under investigation
ROBUSTNESS TESTING
to identify sources of variation and take measures to ensure that the product or process is made robust or insensitive to these factors.
VERIFICATION
final stage involves validation of the optimum settings by conducting a few follow-up experimental runs.
to confirm that the process functions as expected and all objectives are achieved
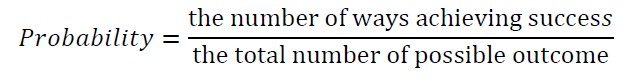
PROBABILITY
How likely an event is to happen
EXPERIMENT
Generates a set of data
EVENT
Set of possible outcomes
has 2 types: Simple and Compound
subset of sample space
repre
SIMPLE EVENT
one outcome
COMPOUND EVENT
more than one outcome
SAMPLE SPACE
set of all possible outcomes or results of a random experiment
represented by letter “S”
ELEMENT OF THAT SET
each outcome in the sample space
INTERSECTION OF EVENTS, MUTUALLY EXCLUSIVE EVENTS, UNION OF EVENTS, COMPLEMENT OF AN EVENT, PROBABILITY OF AN EVENT
5 Types of Operations of Events
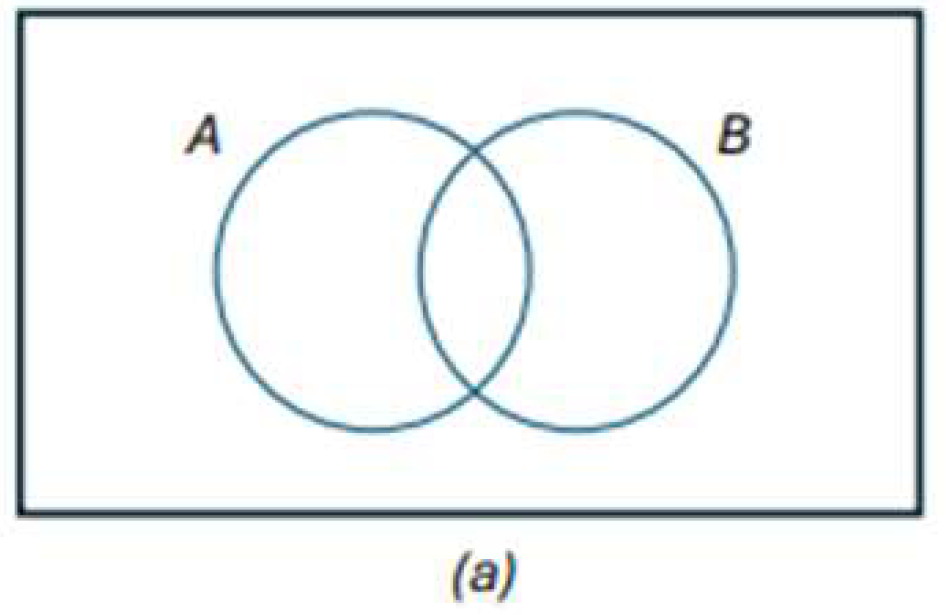
INTERSECTION OF EVENTS
intersection of two events A and B denoted by the symbol 𝐴 ∩ 𝐵
containing all elements that are common to A and B
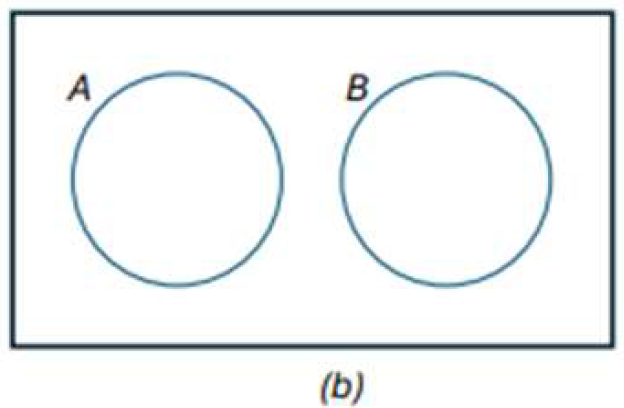
MUTUALLY EXCLUSIVE EVENTS
no elements in common
UNION OF EVENTS
event containing all the elements that belong to A or to B or to both
denoted by the symbol 𝐴 ∪ 𝐵
𝐴 ∪ 𝐵 = {𝑥|𝑥 ∈ 𝐴 𝑜𝑟 𝑥 ∈ 𝐵}
COMPLEMENT OF AN EVENT
complement of an event A with respect to S
all elements of S that are not in A
denoted by A’
the event not occurring.
P(A')
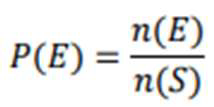
PROBABILITY OF AN EVENT
Sample space and events play important roles in probability
Each probability: 𝟎 ≤ 𝑷(𝑬) ≤ 𝟏
Sum of all probabilities: 𝑷 (𝑺) = 𝟏
MULTIPLICATIVE RULE, PERMUTATION RULE, PERMUTATIONS WITH THINGS THAT ARE ALIKE, COMBINATIONS RULE
4 Types of Counting Rules
MULTIPLICATIVE RULE
probability of occurrence of both the events A and B is equal to the product of the probability of B occurring and the conditional probability that event A occurring given that event B occurs
Dependent Events: P(A ∩ B) = P(B) ∙ P(A|B)
Independent Events: P(A ∩ B) = P(B) ∙ P(A)
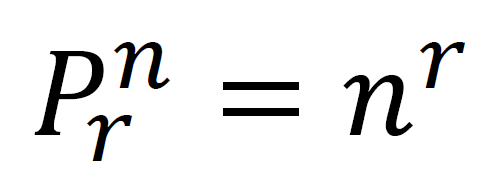
PERMUTATION RULE
arrangement of all or part of a set of objects, with regard to the order of the arrangement.
PERMUTATION RULE (WITHOUT REPETITION)

PERMUTATION RULE (WITH REPETITION)
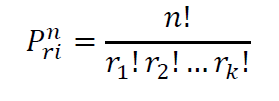
PERMUTATIONS WITH THINGS THAT ARE ALIKE
number of permutations of n objects taken altogether, where r1 are of one kind, and r2 are of the other kind and so on
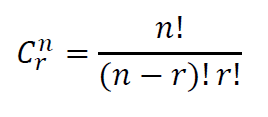
COMBINATIONS RULE
number of ways of selecting items from a collection, such that the order of selection does not matter
selection of objects or things out of a larger group where order doesn’t matter
RULES OF PROBABILITY
Two events are mutually exclusive or disjoint occur at the same time.
CONDITIONAL PROBABILITY
probability that Event A occurs, given that Event B
P(A|B)
INTERSECTION OF A AND B
Events A and B both occur
P(A∩B)
Events A and B are mutually exclusive, P(A∩B) = 0
UNION OF A AND B
Events A or B occur
P(A∪B)
DEPENDENT
occurrence of Event A changes the probability of Event B
INDEPENDENT
occurrence of Event A does not change the probability of Event B
RULE OF ADDITION, RULE OF MULTIPLICATION, RULE OF SUBTRACTION
3 Types of Rules of Probability
RULE OF ADDITION
Rule 1: If two events A and B are mutually exclusive, then:
𝑃 (𝐴 ∪ 𝐵) = 𝑃 (𝐴) + 𝑃 (𝐵)
Rule 2: If events A and B are not mutually exclusive events, then:
𝑃 (𝐴 ∪ 𝐵) = 𝑃 (𝐴) + 𝑃 (𝐵) − 𝑃 (𝐴 ∩ 𝐵)
RULE OF MULTIPLICATION
Rule 1: When two events A and B are independent, then:
𝑃 (𝐴 ∩ 𝐵) = 𝑃 (𝐴) 𝑃 (𝐵)
Rule 2: When two events are dependent, the probability of both occurring is:
𝑃 (𝐴 ∩ 𝐵) = 𝑃 (𝐴) 𝑃 (𝐵|𝐴)
where,
𝑃(𝐵|𝐴) = P(A ∩ B)/P(A), P(A) ≠ 0
RULE OF SUBTRACTION
probability that event A will occur is equal to 1 minus the probability that event A will not occur
𝑃 (𝐴) = 1 − 𝑃 (𝐴′)
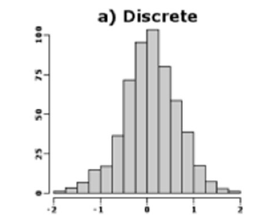
DISCRETE DISTRIBUTION
probability of occurrence of each value of a discrete random variable
RANDOM VARIABLE
value is subject to variations due to chance (i.e. randomness, in a mathematical sense)
DISCRETE RANDOM VARIABLE
a number that can only be one of a specific list of whole numbers
a probability mass function which directly maps each value of the random variable to a probability.
x has a countable number of possible values.
Examples:
The number of eggs that a hen lays in a given day
The number of people going to a given soccer match
The number of students that come to class on a given day
PROBABILITY HISTOGRAM
displays the probabilities of each of the three discrete random variables.
DISCRETE PROBABILITY DISTRIBUTION
Formula, Table, Graph
TABLE
Shows the values of the discrete random variable can take on and their corresponding probabilities
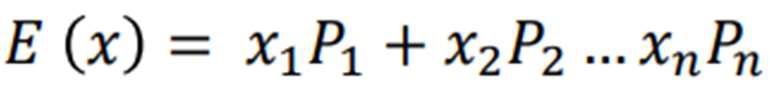
EXPECTED VALUE
random variable is the weighted average of all possible values that this random variable can take on.
BINOMIAL RANDOM VARIABLE
number of successes x in n repeated trials of a binomial experiment
BINOMIAL DISTRIBUTION
probability distribution of a binomial random variable
The experiment consists of n repeated trials.
Each trial can result in just two possible outcomes.
The probability of success, denoted by P, is the same on every trial.
The trials are independent
BINOMIAL PROBABILITY
probability that a binomial experiment results in exactly x successes
NOTATIONS:
x: Number of Successes as a result of the binomial experiment
n: Number or trials
P: The probability of success on an individual trial
Q: The probability of failure
n!: The factorial n
b(x;n,P): Binomial probability
nCr: The number of combinations of n things taking r at a time
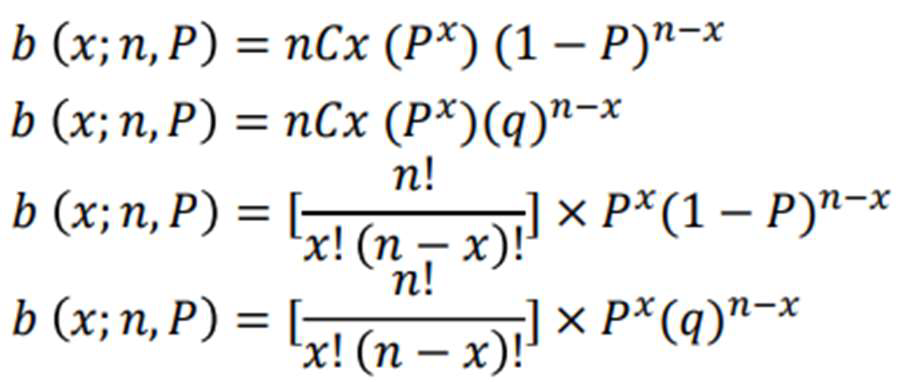
CUMULATIVE BINOMIAL PROBABILITY
probability that the binomial random variable falls within a specified range
POISSON DISTRIBUTION
probability distribution of a Poisson random variable
ATTRIBUTES
The experiment results in outcomes that can be classified as successes or failures.
The average number of successes (μ) that occurs in a specified region is known.
The probability that a success will occur is proportional to the size of the region.
The probability that a success will occur in an extremely small region is virtually zero.
NOTATIONS:
e: constant (base of natural log), equals to 2.71828
μ: mean number of successes
x: actual number of successes
P(x; μ): The Poisson Probability that exactly x successes occur in a Poisson experiment, when the mean number of successes is μ
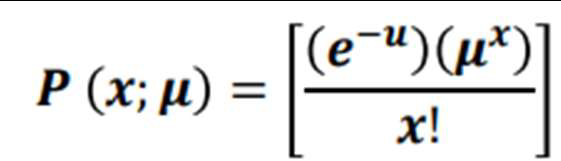
POISSON RANDOM VARIABLE
number of successes that result from a Poisson experiment.
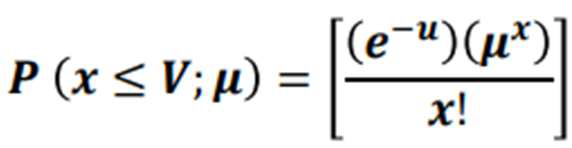
CUMULATIVE POISSON PROBABILITY
probability that the Poisson random variable is greater than some specified lower limit and less than some specified upper limit
CONTINUOUS RANDOM VARIABLE
a random variable can take on values on a continuous scale
precisely the same values that are contained in the continuous sample space
represent measured data, such as all possible heights, weights, temperatures, distance, or life periods