Statz
1/45
There's no tags or description
Looks like no tags are added yet.
Name | Mastery | Learn | Test | Matching | Spaced |
|---|
No study sessions yet.
46 Terms
math concerning the collection, organization, and the interpreation of data
statistics
the oberservations gathered from an experiment, survey, or study
data
data involving one random variable (ex) test scores
univariate
data involving two random variables (ex) test scores and hrs of studying
bivaraite
Describes the values in a data set, looking for patterns, (clusters, gaps, peaks), center maximum, minimum, range, spread outliers
distribution
number of values in a data set are represented by
n
what measure of center is least affected by outliers
median
how to find median
n+1/2
what symbol means sum
Σ
what means sample mean
X̄
what means population mean
μ
how to find range
max-min
interquartial range, range of the middle half of the data, not affected by outliers
IQR
average of the squared distances
variance
what means sample variance
s2
what means population varaiance
σ2
measure of variation that descries how far the data values are from the mean
standard deviation
Arranges the data by dividing it into 2 parts: stem and leaf. The legend tells you how to read it
Steam and leaf plot
Number line to show the number of times each value in a data set occurs, easily shows the shape of distribution
Dot plot
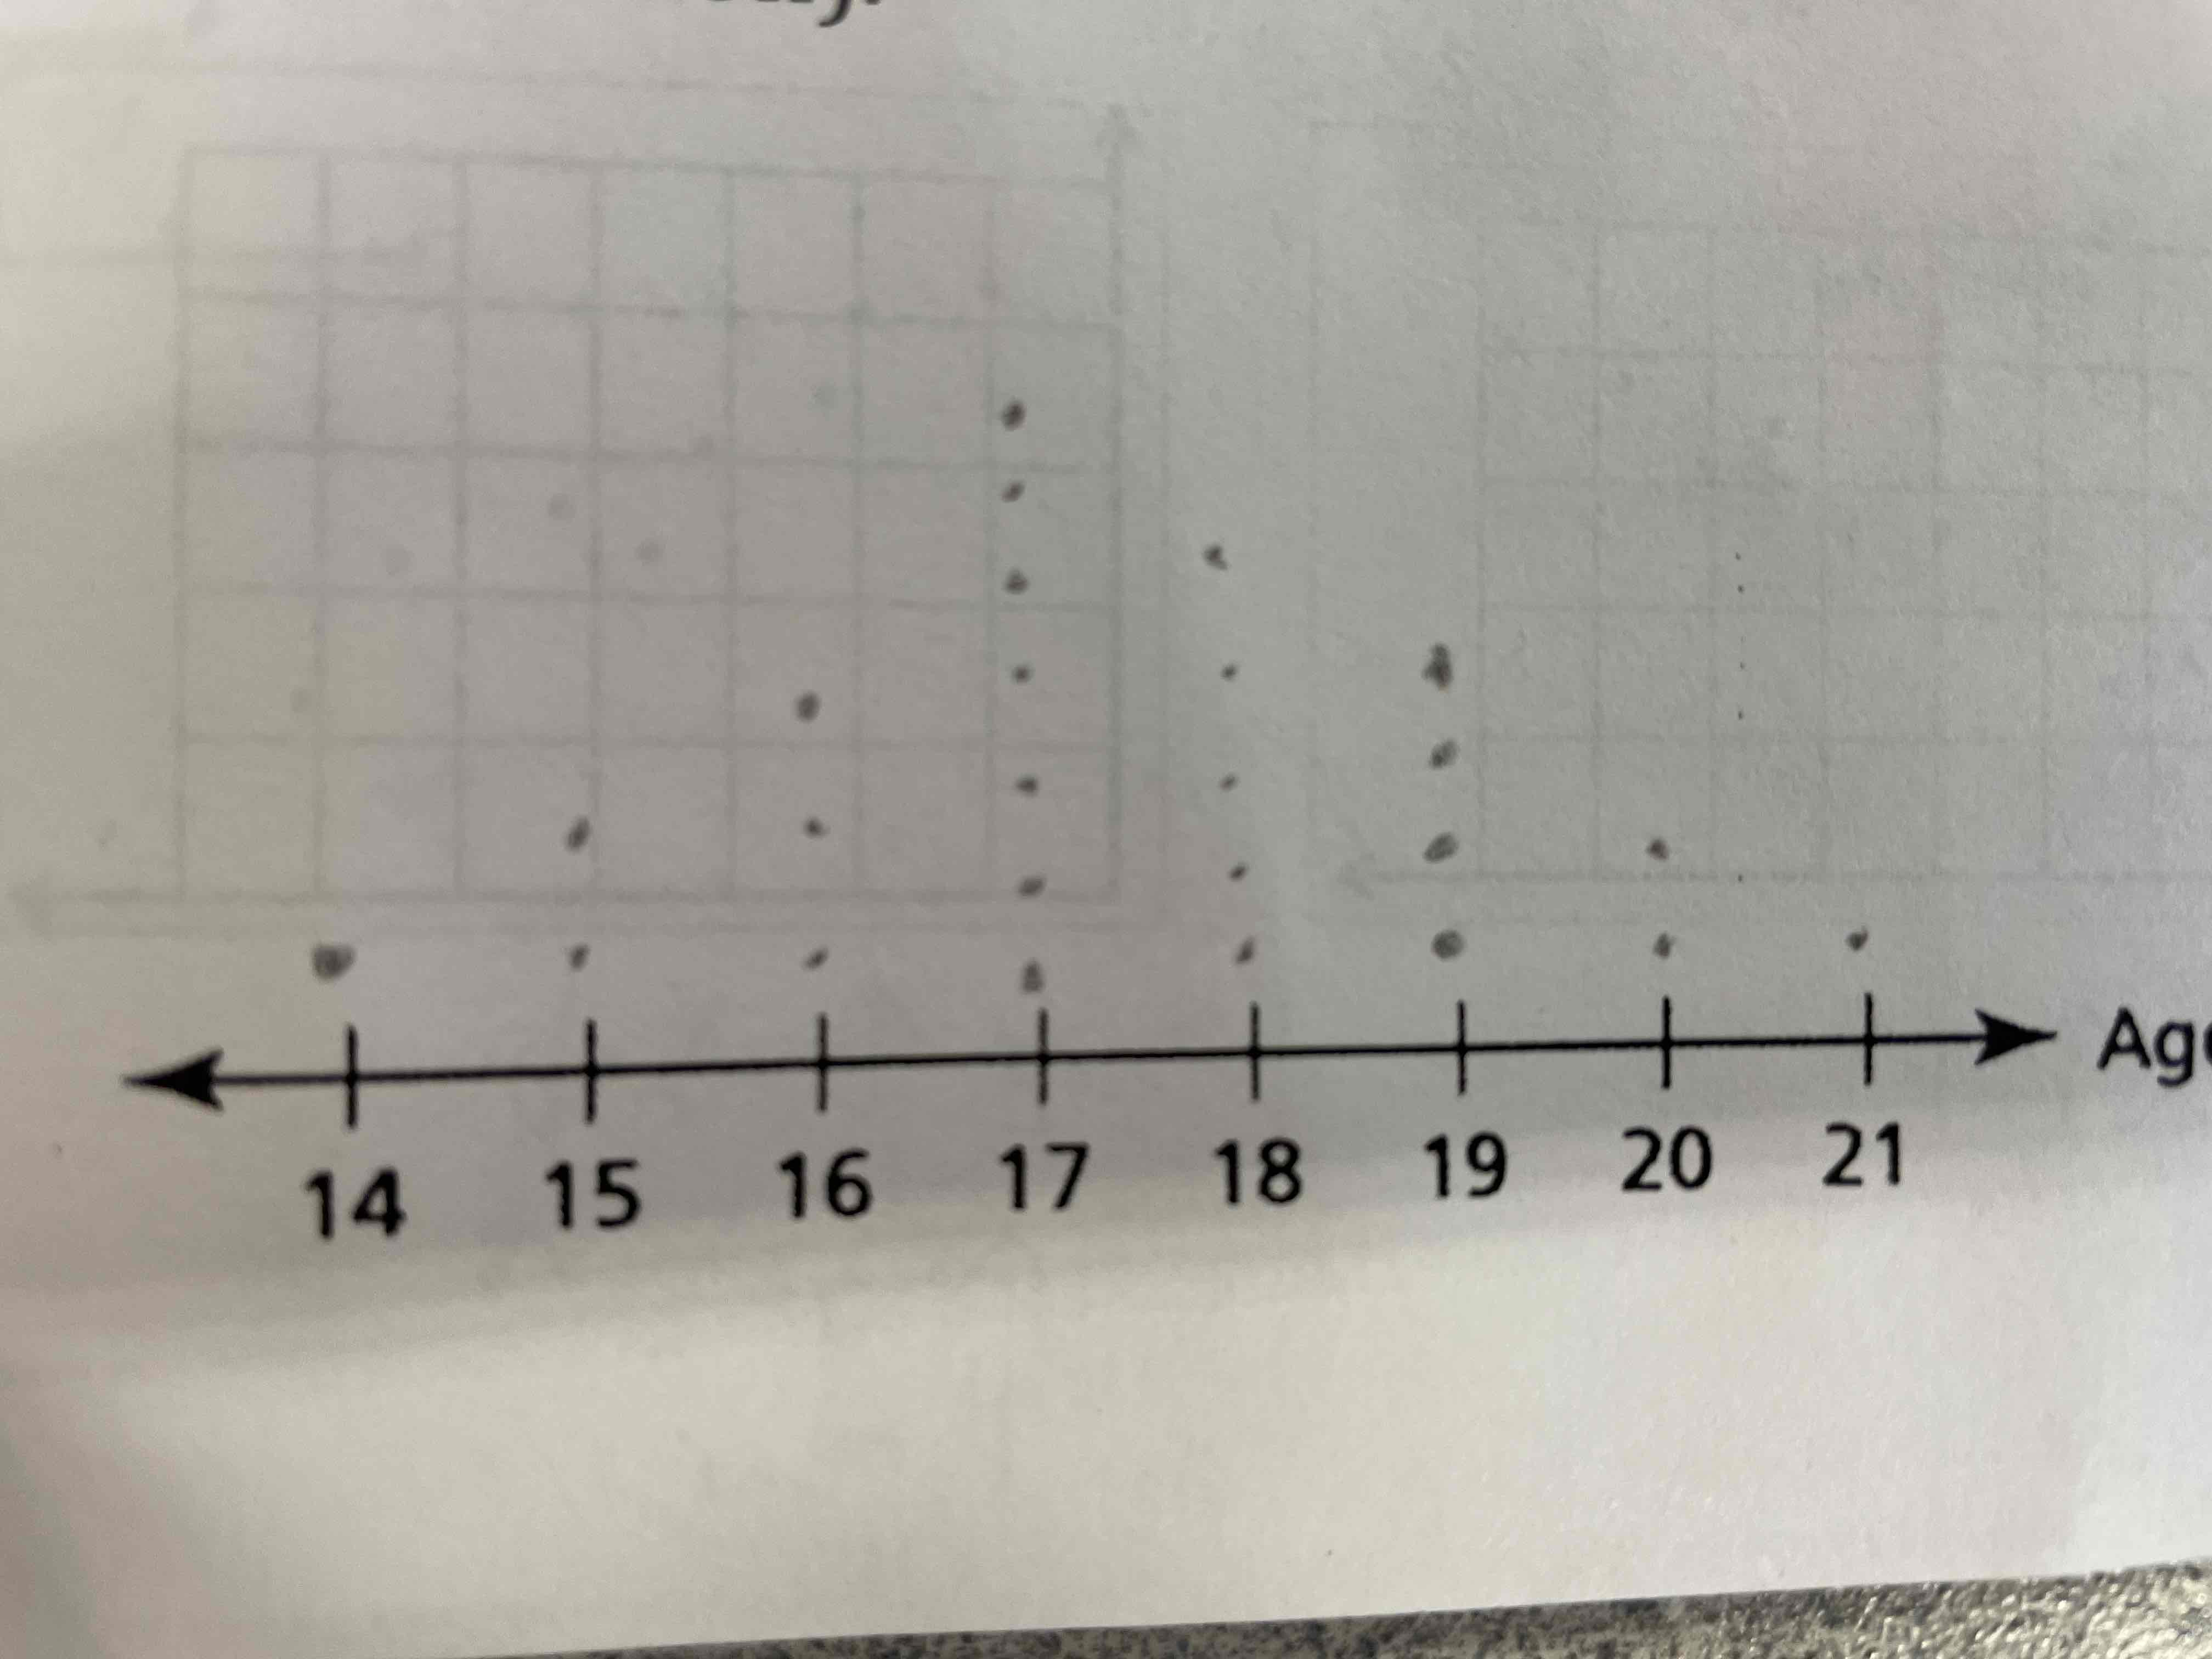
What spread does this have?
High spread / variance
Bar graph that displays the frequency of data divided into equal intervals (bins) the bars must be of equal width and should touch, not overlap
Histogram
Graph used to determine if a relationship / correlation exists between 2 sets of data
Scatter plot
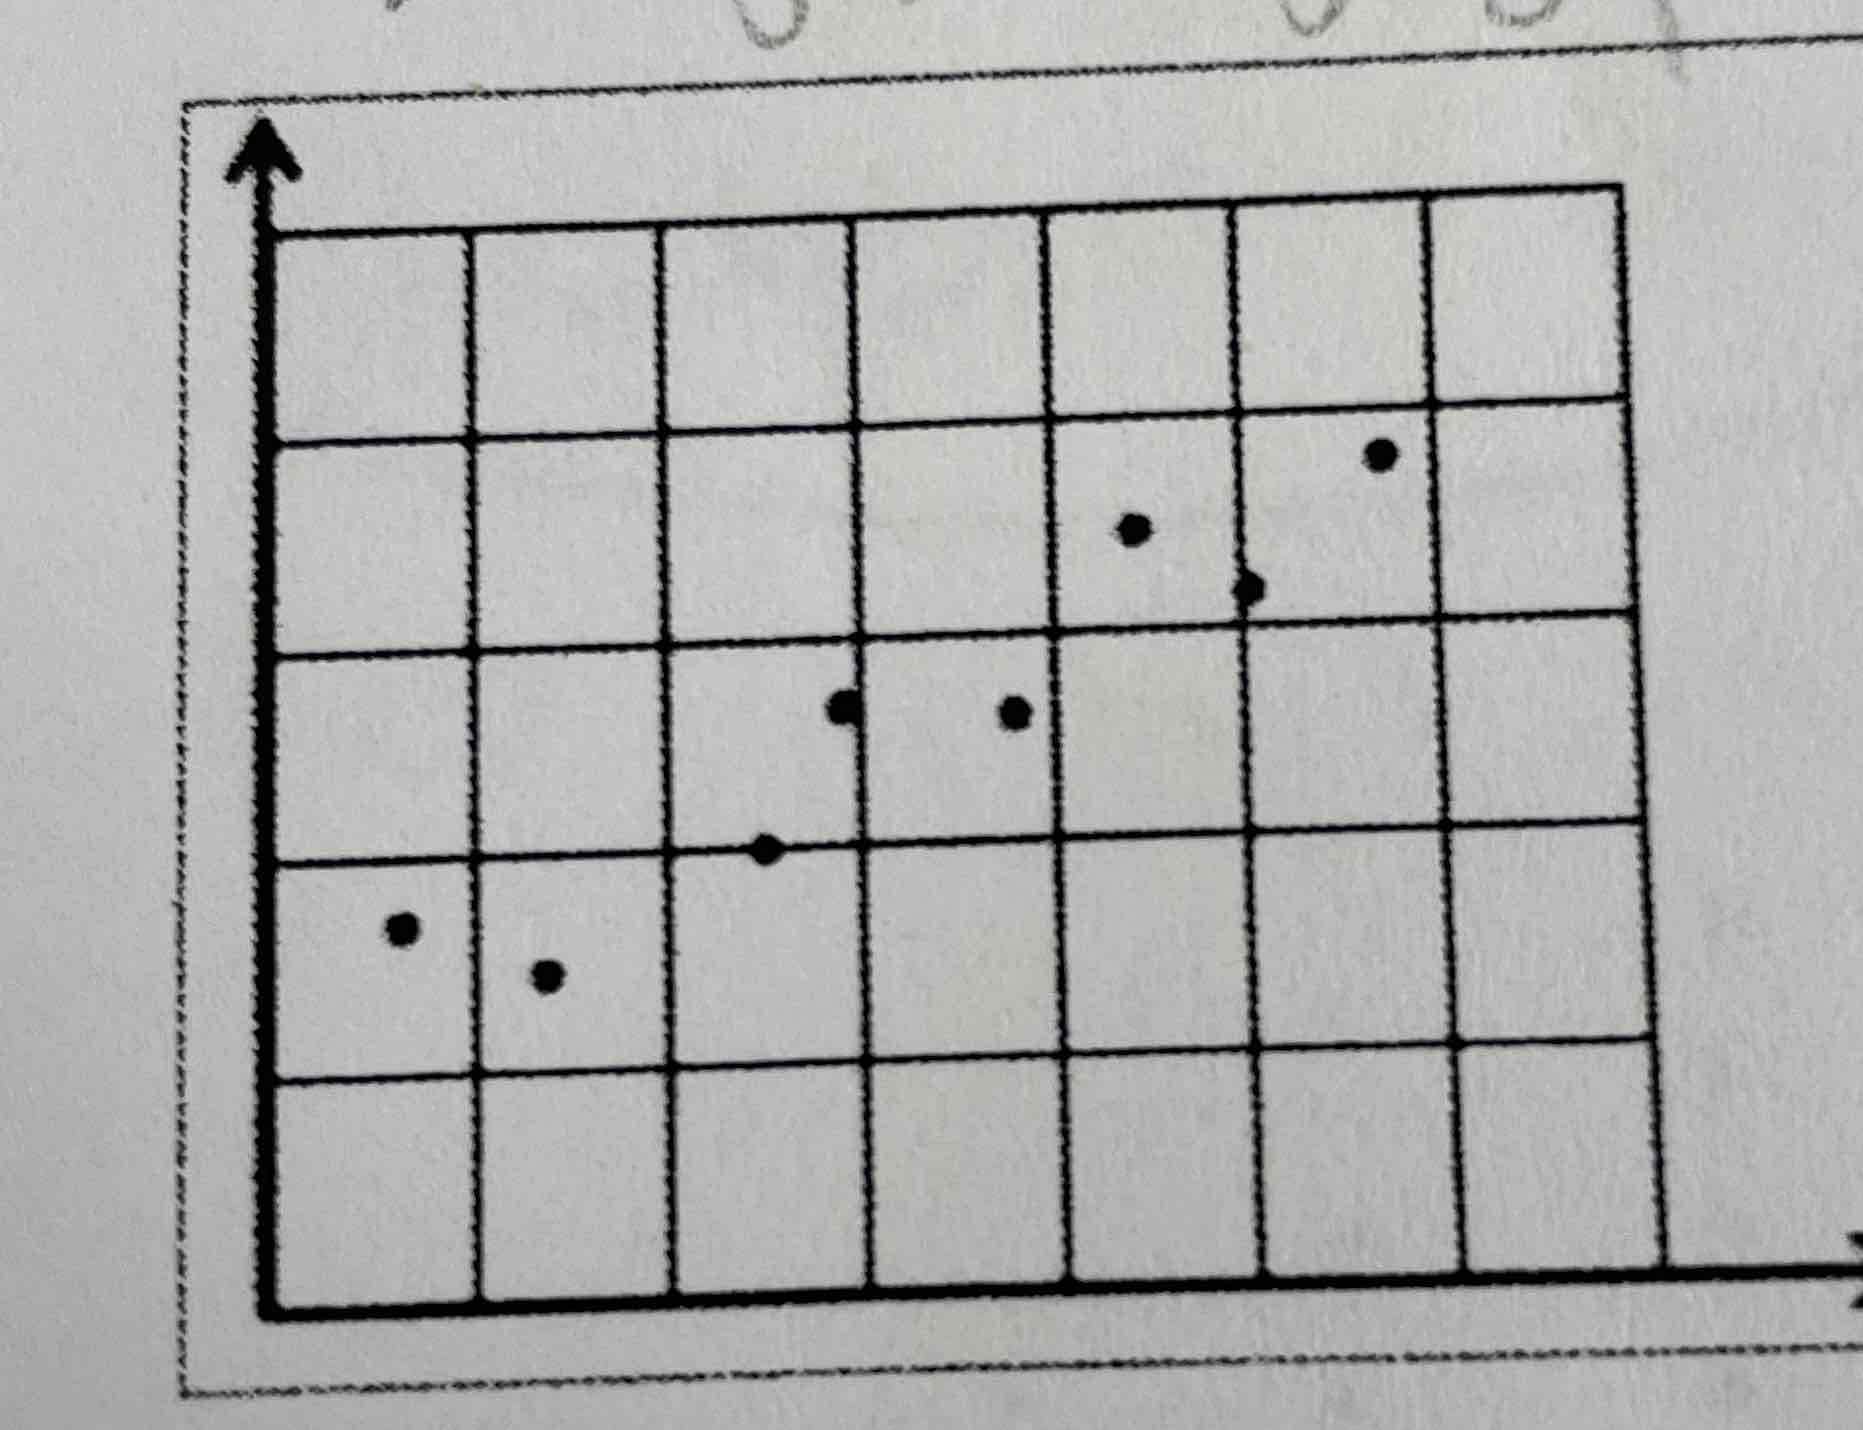
Is this positive or negative and linear or nonlinear
Positive linear
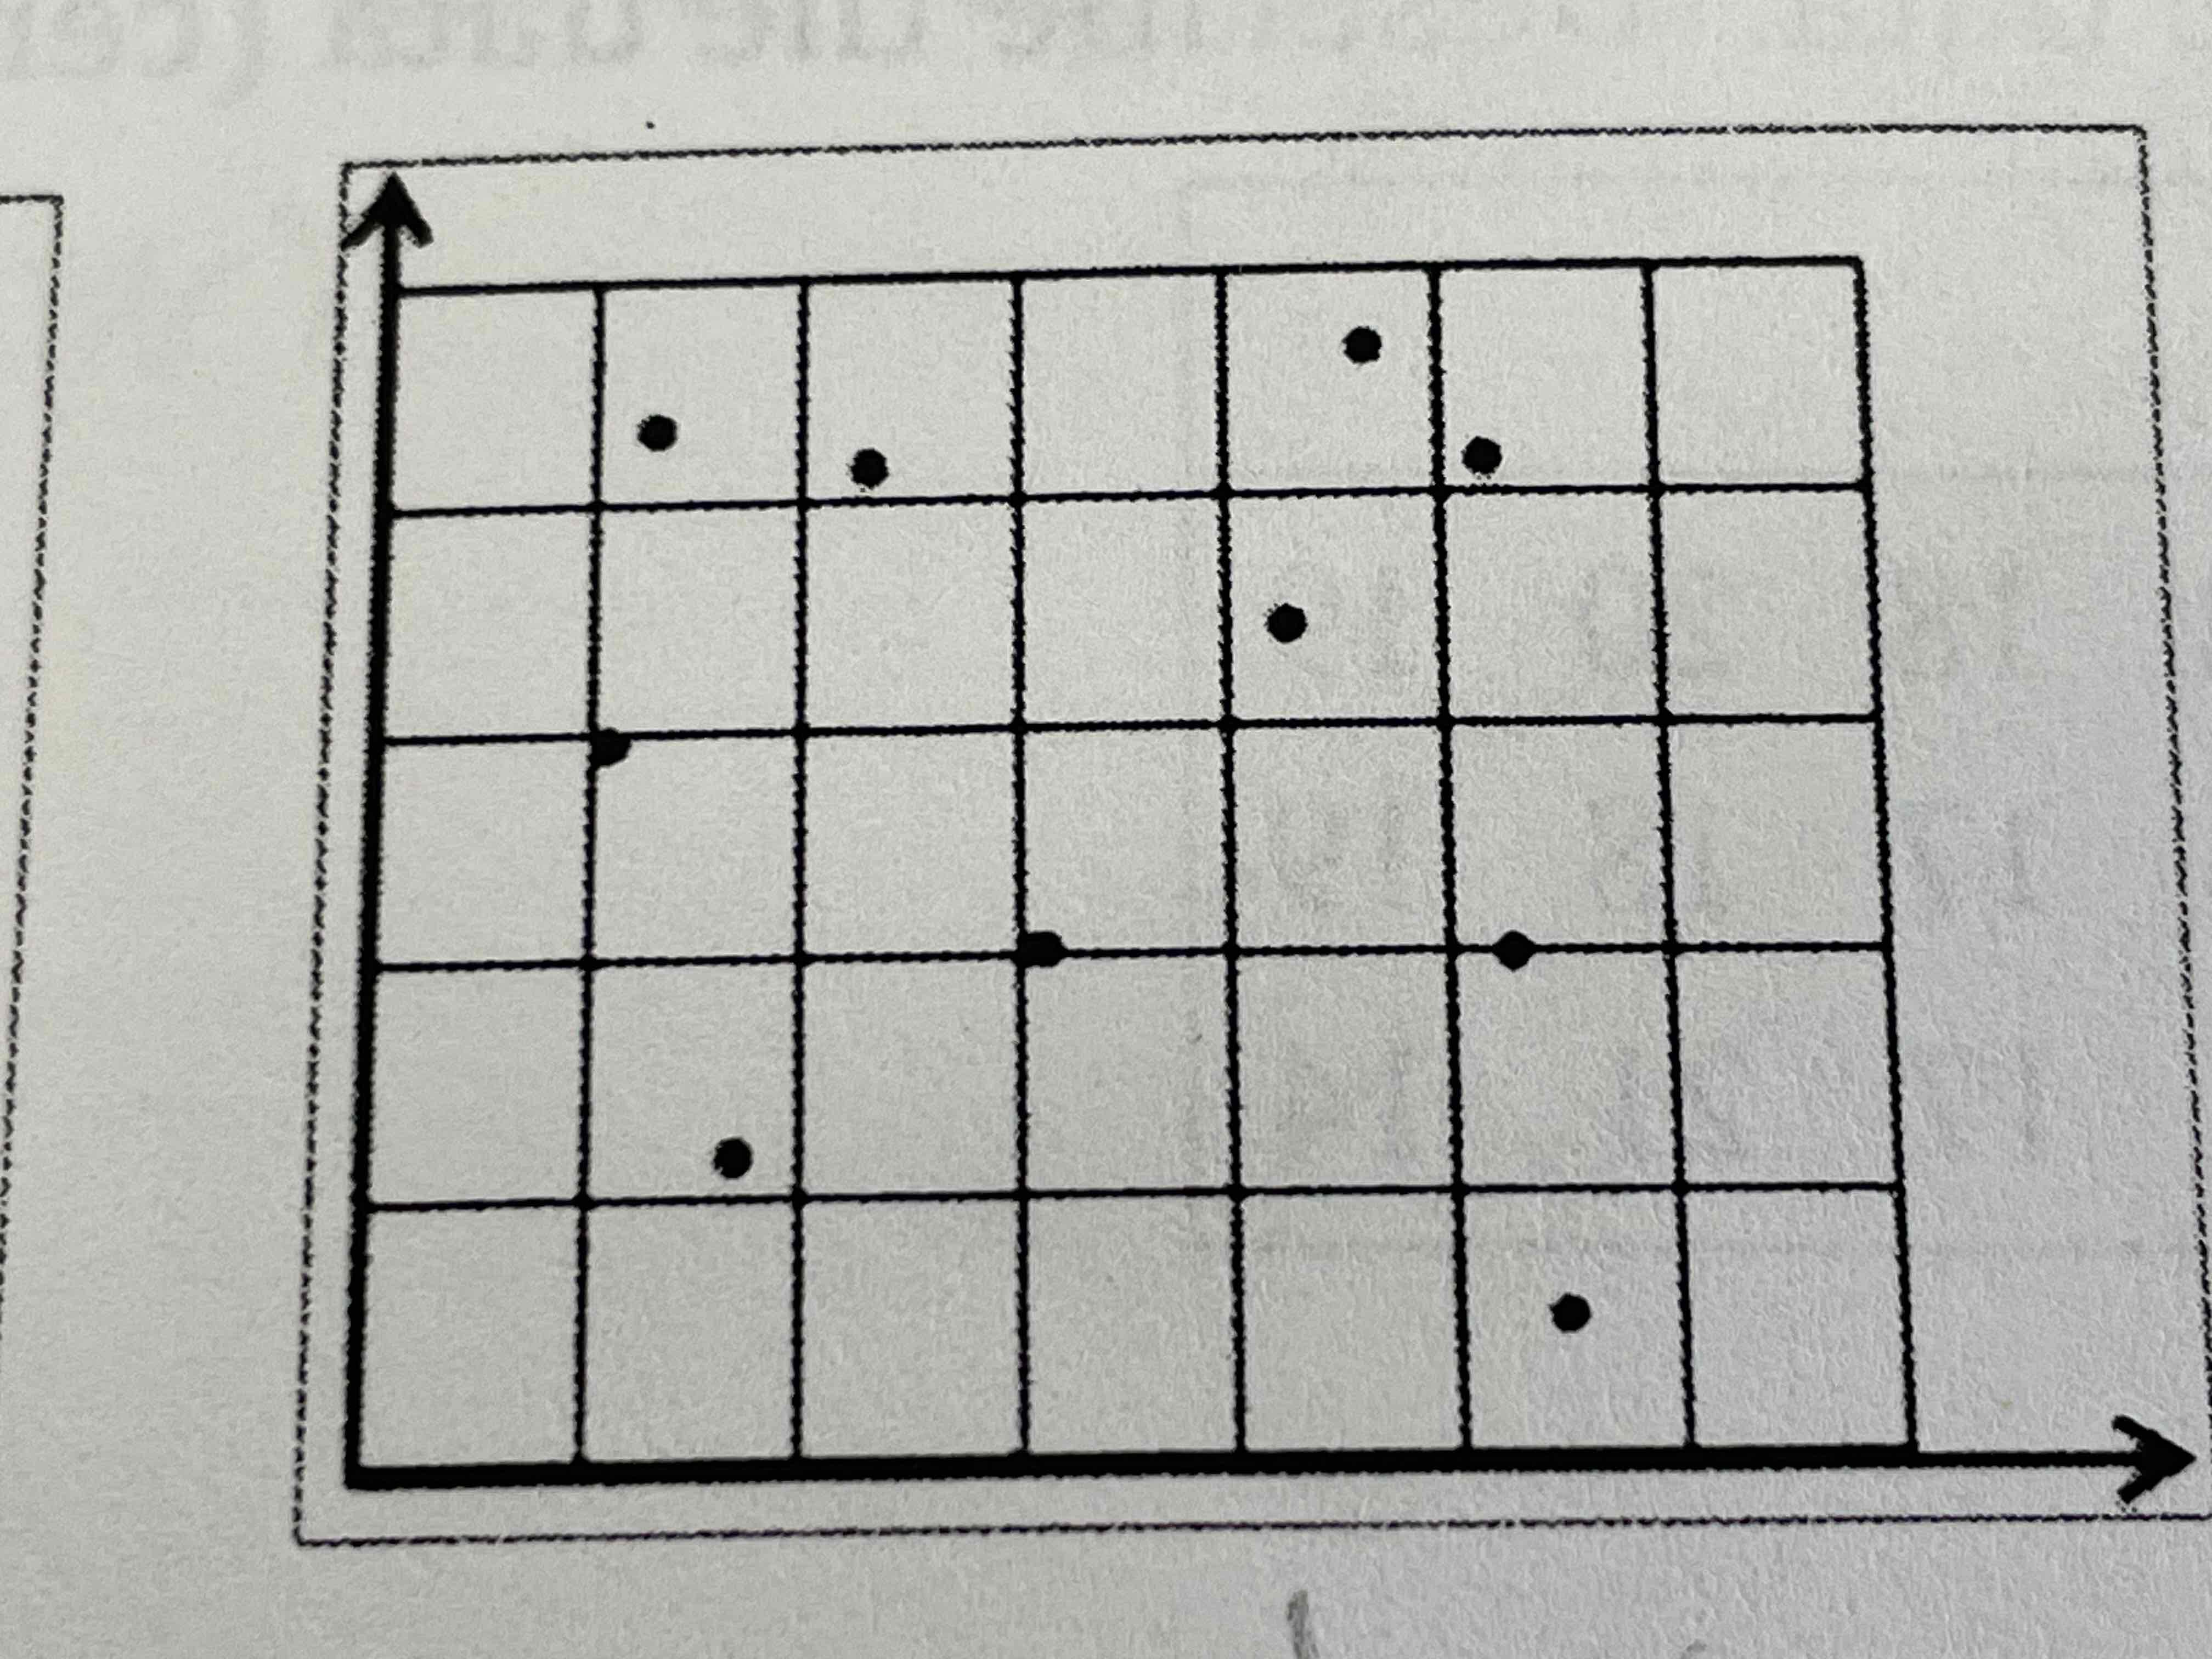
What correlation does this scatter plot have?
No correlation
What is each part of a box and whisker plot worth in percentage?
25%
How to find outlier in less than
Q1-1.5IQR
How to find outlier in greater than
Q3+1.5IQR
entire set of items from which data is drawn
population
numerical value that states something about an entire population
parameter
collects info/data on every number of a population
census
a subset or a part of a population
sample
numerical value that states something about a sample
statistic
a study in which researchers gather existing info by observing subjects, recording records, etc
observational study
a study in which researchers apply a treatment to group and observe the effects of the treatment
experiment
the imitation of a real world process that requires a model to be developed
simulation
an investigation of one of more characteristics of a population
survey
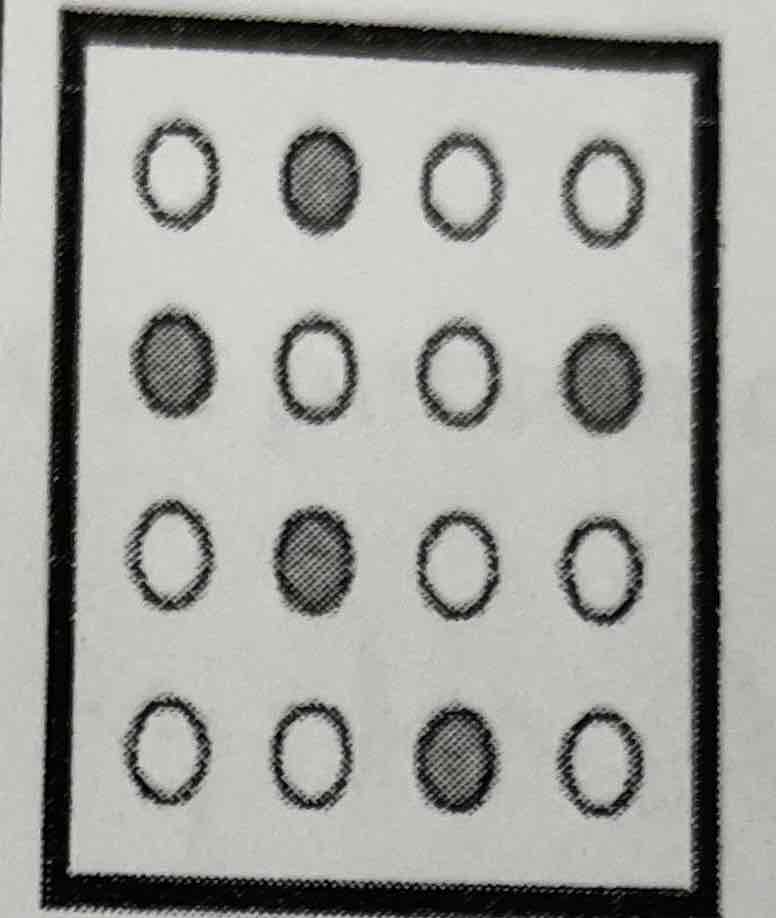
Members are chosen using a method that gives everyone an equally likely chance of being selected
Simple random sample
Members are chosen using a pattern such as selecting every other person. Nth
Systematic sample
The population is first divided into groups. Then members are randomly chosen from each group
Stratified sample
The population is first divided into groups. A sample of the groups is randomly chosen. All members of the chosen group are surveyed
Cluster sample
Members are chosen because they’re easily accessible
Convenience sample
Members volunteer to participate
Self selected sample
error introduced by the sampling method. may skew the data and the results may not be accurate or truly represent the population
Bias
in right skewed distributions are mean or median greater
mean
in left skewed distributions are mean or median greater
median