Introduction to Data Analysis (Engineering Data Analysis)
1/97
Earn XP
Description and Tags
These flashcards provide key terms and definitions related to the concepts of data analysis covered in the course.
Name | Mastery | Learn | Test | Matching | Spaced |
|---|
No study sessions yet.
98 Terms
What is The key Engineering Mindset?
-Statistics
-Decision Making
-Efficient Application
-Process Improvement
Statistics
a science that helps us make decisions and draw conclusions in the presence of variability
Decision Making
Engineers are the professionals that formulates [BLA-NK] based on technical data and reliable data
Efficient Application
An engineer is someone who solves problems of interest to society by the [BLA-NK] of scientific principles
[Process Improvement](The Engineering Method)
Engineers solves the problem this by either refining an existing process or by designing a new process that meets clients’ needs

Scientific Data
The use of statistical methods various sectors including industries, research and development, and many other areas involves the gathering of information or WAT?
Statistics my love
The field of [MEOW?] deals with the collection, presentation, analysis, and use of data to make decisions, solve problems, and design products and processes
Statistical techniques
[BLAAANK] can be powerful aids in designing new products and systems, improving existing designs, and designing, developing, and improving production processes.
THATS THE STARING LINE LMAO
HARDMODE IN COMIN love u tho
Mean
It is simply numerical average

Other Mean Formula?
Geometric | Weighted

Median
It is the midpoint of the data array

Mode
It is the most frequent data value in a data set.
-If the data set is said to have 2 modes, it is bimodal.
-If the data set is said to have 3 modes, it is trimodal.
U GOOD? TAKE 3 mins rest
BREATHEEEEEEEEEEEEEEEEEEE
Fractiles and Quantiles
It is describes or locate the position of a certain piece of data relative to the entire set of data
Quartile
It is the fractile obtained by dividing the set of data into four equal parts
Four parts Of Quartile habibi?
Q1: lower quartile- which contains the lowest 25% of the data.
Q2: median- which divides the data into two equal parts.
Q3: higher quartile- which contains the lowest 25% of the data.

Deciles?
It is the fractile obtained by dividing the set of data into ten equal parts
Percentile YA KNOW DIS YES?
It is the measure of position made by dividing the set up to one hundred equal parts
Finding Quartiles, Deciles and Percentiles lemme tell u :3
1. Arrange the data set from least to greatest. 2. Calculate the position of the fractile element by the formula:

Five Number Summary
The group of numerical presentation of the following values:
- Minimum(Lowest Value)
- Q1: lower quartile
- Median
- Q3:higher quartile
- Maximum(Highest Value
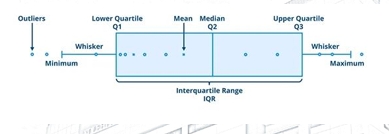
Box and Whisker Plot
The graphical representation of the five-number summary:
-Minimum(Lowest Value)
-Q1: lower quartile
-Median
-Q3:higher quartile
-Maximum(Highest Value)
-Fences
Lower Fence = Q1– 1.5IQR
UpperFence = Q3 +1.5IQR
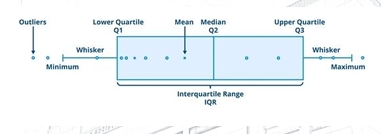
GO TO SLEEP M8
LATE AT NIGHT UTUTUTUTUUTUTUTUTUTTUT
Range
The difference between the largest and smallest number in the set.

Mean Absolute Deviation
The average of unsigned deviations from mean.

Standard Deviation
The measure of closeness of data value set to each other.

Variance
The measure of variation equal to the square of the standard deviation.

Coefficient of Variation
The percentage of the ratio of the standard deviation to the mean.

FAR MORE AWAY SO BREATHEEE AND MAYBE REST pls :3
U get kisses for finding this
Skewness
-The degree of asymmetry of distribution about a mean.
-Based on the computed values of skewness, with a certain degree of tolerance, the data distribution can be interpreted as symmetric, positively skewed or negatively skewed.
Skewness (skewness coefficient)
The skewness coefficient of the distribution can interpreted the skewness of a data set as shown:

The skewness coefficient of the distribution can be determined using the following:
❑ Moment-Based Coefficient of Skewness
❑ Bowley’s Coefficient of Skewness
❑ Pearsonian Coefficient of Skewness
Moment-Based Coefficient of Skewness
The third degree moment from the mean
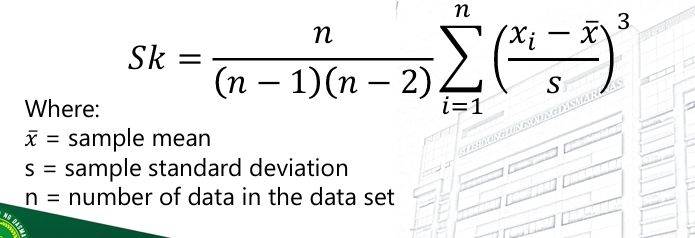
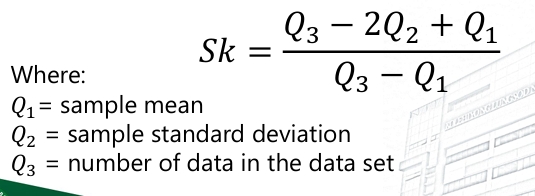
Bowley’s Coefficient of Skewness
The coefficient of skewness based on three quartiles in a given data set.
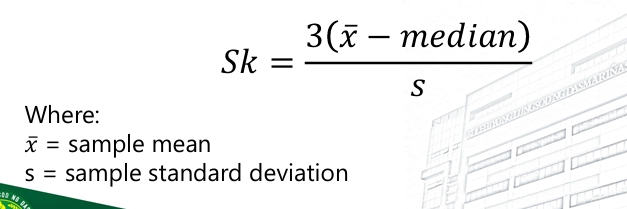
Pearsonian Coefficient of Skewness
Themost practical estimation of skewness of a data set
SAKIT SA MATA NYAN PERDS
HEHEHEHEHHEEHHEHEHEHE
Kurtosis
-The degree of peakedness of distribution about a normal distribution
-Based on the computed values of kurtosis, with a certain degree of tolerance, the data distribution can be interpreted as leptokurtic, platykurtic or mesokurtic
Kurtosis (The kurtosis of the distribution)
The kurtosis of the distribution can interpreted the skewness of a data set as shown:

Kurtosis DATA YES DATA FORMULAAAAAAAAAAAA
The kurtosis of the data set can be computed as:

Data
-A factual information used as a basis for reasoning, discussion, or calculation
-A group of raw information from which statistics are created
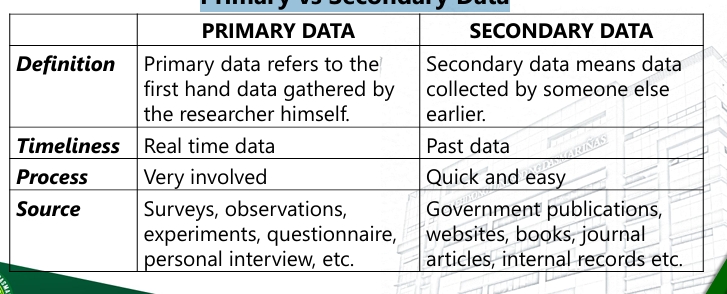
Primary Data
a set of data obtained or directly generated by the researcher through surveys, interviews, experiments
Secondary Data
a set of existing data which were obtained by previous researcher by presenting it on a publication such as journals, research articles, census, reports, previous records by various institutions and organizations
Primary vs Secondary Data nigga data
Parameter
a numerical measurement describing some characteristic of a population.
Statistic
a numerical measurement describing some characteristic of a sample.
Types of Data:

Quantitative Data
A set of data consists of numbers representing counts or measurements with units
Discrete Data
refers to the data values that are finite or countable
Continuous Data
refers to the data value that result from infinitely many possible quantitative values (which is no longer countable
Types of Data AGAIN
Qualitative Data
A set of data consists of names, labels, (or even a number but it does not represent any count for measurement).
Nominal Data – characterized by data that consist of names, labels, or categories only and the data cannot be arranged in some order (such as low to high).
Ordinal Data – data that can be arranged in some order, but differences (obtained by subtraction) between data values either cannot be determined or are meaningless
JUST READ THE HIGHLTED IF SKIMMIN
Common Data Collection Methods
Sample Survey
Census
Experiment
Observational Study
Sample Survey
the data collection process in which a sample is collected and studied to gain information about a population
Census (Big Sample Survey)
the process of complete enumeration. It is a process of collecting information from every unit in the target population.
Experimental Study (Designed Experiment)
a study that makes deliberate or purposeful changes in the controllable variables of the system or process, observes the resulting system output, then makes an inference or decision about which variables are responsible for the observed changes in output performance
Experiment
a planned activity designed to compare “treatments.”
Observational Study
a data collection activity in which the experimenter merely plays the role of an observer
Retrospective Study
a studies that utilizes past or historical data collected (typically log records or past journal data)
Population
is the entire group of individuals or items in a study
Sample
a part of a population that is actually studied
Sampling Techniques
-Non-Probability
Convenience Sampling
Quota Sampling
Purposive Sampling
-Probability
Simple Random Sampling
Systematic Sampling
Cluster Sampling
Stratified Sampling
Non-Probability Sampling
❑Convenience Sampling– a sampling technique based primarily on the availability of the respondents (or experimental conditions)
❑Quota Sampling– a sampling technique where there is a desired number of sample and the respondents were taken as volunteers,
❑Purposive Sampling– a type of sampling where the sample is obtained based on a certain premise.
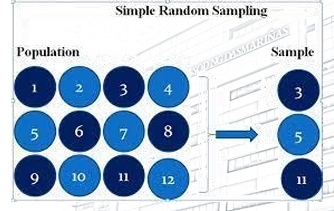
Probability Sampling - Simple Random Sampling
a sampling technique performed by arranging the population according to a certain rule, each element being numbered and a sample is taken by various randomizing principles.
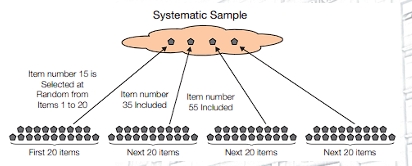
Probability Sampling - Systematic Sampling
a sampling technique done by arranging the population in accordance to a certain order and the sample will be taken by dividing the population into equal groups and obtaining the kth element in each group
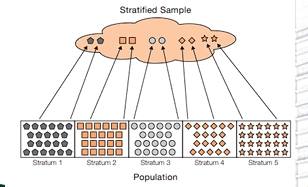
Probability Sampling - Stratified Sampling
a sampling technique performed by arranging the population according to strata or subpopulation, with generally homogeneous or similar characteristics. Then a random sampling is performed per strata proportional to the size of each strata.
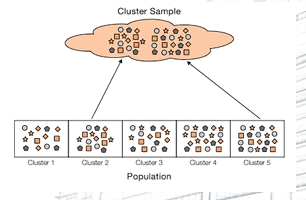
Probability Sampling - Cluster Sampling
a sampling technique performed by arranging the population according to clusters, with elements as heterogeneous or diverse characteristics as possible.
Qualitative Data (DESCRIPTIVE/CATEGORICAL)
-Bar Chart
-Pie Chart
-Frequency Polygon
-Pareto Chart
Bar Chart
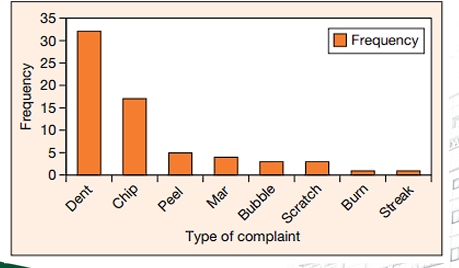
❑ A bar chart is created by plotting all the categories in the data on one axis and the frequency (or relative frequency or percentages) of occurrence of each category in the data on the other axis.
❑ Either horizontal or vertical bars of height (or length) equal to the frequency are drawn.
Pie Chart
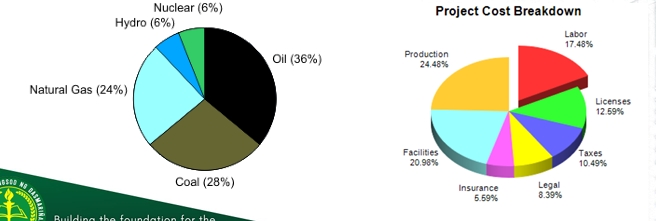
A circular chart representing the percentage occurrence of each group in the sample.
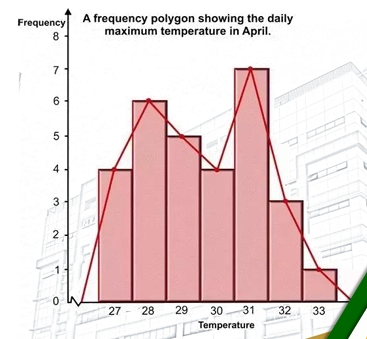
Frequency Polygon
A line graph that is used to compare the rate of increase and decrease per class interval (class marks versus frequency.
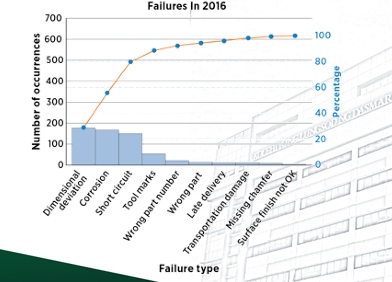
Pareto Chart
the process of sorting out the few vital causes from the trivial many.
Pareto Chart is a result of the ‘Pareto Principle’ due to imbalance of land distribution and ownership in Italy
“80% of consequences come from 20% of the causes”
Quantitative Data (NUMERICAL)
Stem and Leaf Diagram
Histograms
Scatter Diagrams
Boxplots
Time Sequence Plots
Stem and Leaf Diagram (Dotplot)
❑ The dotplot is a useful data display for small samples up to about 20 observations.
❑ If used for many data observations, dotplot is no longer efficient
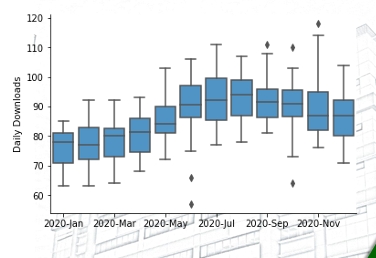
Boxplot (Box-and-Whisker Plot)
A graphical display that simultaneously describes several important features of a data set, such as center, spread, departure from symmetry, and identification of unusual observations or outliers.
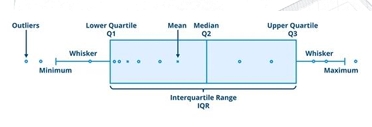
Boxplot (Box-and-Whisker Plot)
The graphical representation of the five-number summary:
❑ Minimum(Lowest Value)
❑ Q1: lower quartile
❑ Median
❑ Q3:higher quartile
❑ Maximum(Highest Value)
❑ Fences
❑ Lower Fence = Q1– 1.5IQR
❑ UpperFence = Q3 +1.5IQR
Time Sequence Plots
❑ Time Series - a data set in which the observations are recorded in the order in which they occur.
❑ Time Series Plot - a graph in which the vertical axis denotes the observed value of the variable (x) and the horizontal axis denotes the time (which could be minutes, days, years, etc.).
❑ When measurements are plotted as a time series, we often see trends, cycles, or other broad features of the data that could not be seen otherwise
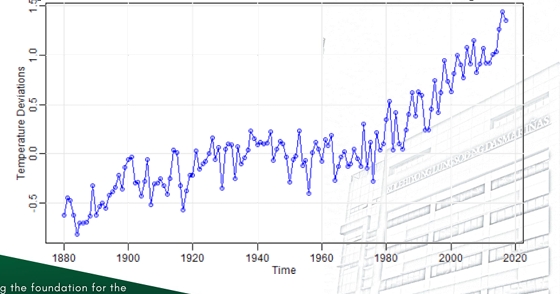
Time Sequence Plots
a graph combination of stem-and-leaf plot and time series plot.

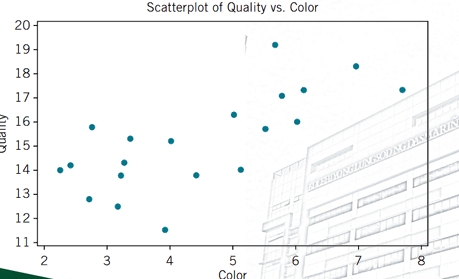
Scatter Diagram
It is a graphical representation of possible relationship between two measurement variables.
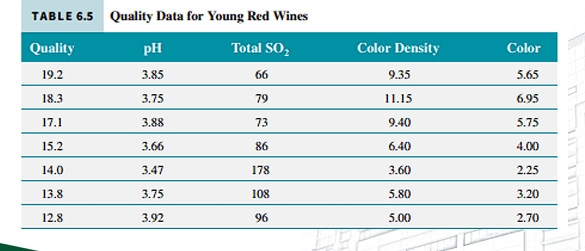
Scatter Diagram - Illustration
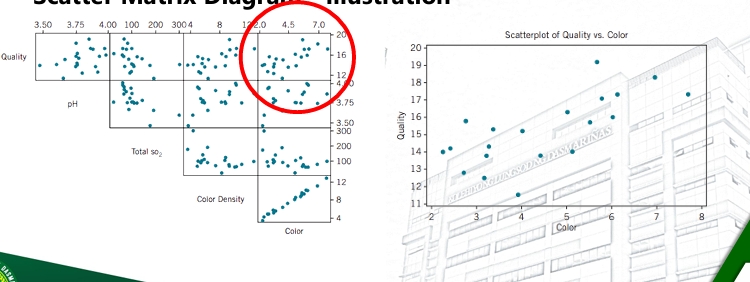
Scatter Matrix Diagram
A set of scatter diagram when two or more variables are analyzed for pairwise relationships between the variables in the sample.
Sample Correlation Coefficient
a quantitative measure of the strength of the linear relationship between two random variables (as x and y).

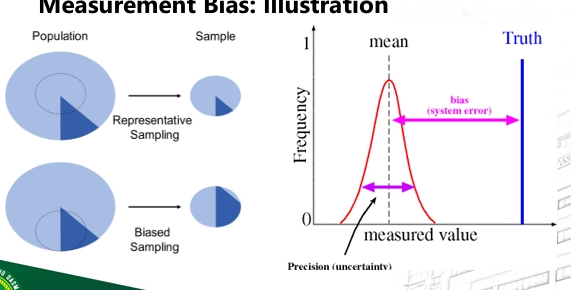
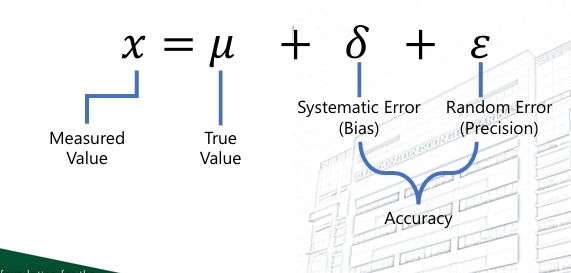
Measurement Bias
A sampling method is biased if it tends to give samples in which some characteristic of the population is underrepresented or overrepresented
Measurement Bias: Mathematical Representation
Key Elements of a Survey
❑ Stating Clear Objectives (General and Specific)
❑ Defining Target Population.
❑ Sample Selection Plan (to reduce bias)
❑ Methodof Measurement (to minimize bias) ❑ Pretest/Simulation
❑ Organized Data Collection and Data Management
❑ Thorough Data Analysis
❑ Conclusions (in line to the objectives)
Sources of Bias in Surveys
Wording Effect Bias - Improper wording of a question
Nonrandom selection of sample
Response Bias – bias that occurs due to the behavior of the interviewer or the respondent.
Nonresponse Bias – bias that occurs when the selected sample refuse to answer
Undercoverage Bias – bias that occurs if a part of the population is left out of the selection process
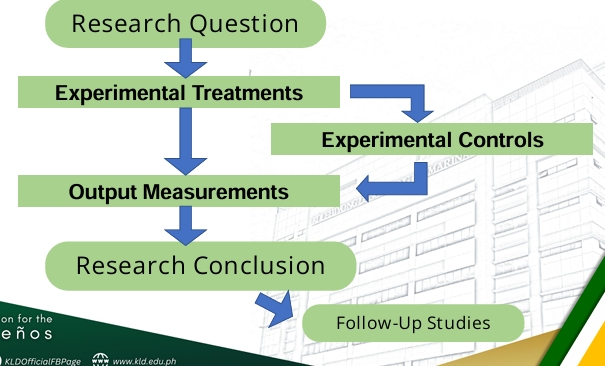
Experiment Flowchart: In a Glance
❑ In a designed experiment, a researcher makes deliberate or purposeful change in the variables of the system or process, observes the resulting system output data, and then makes an inference or decision about which variables are responsible for the observed changes in output performance.
❑ Experiments designed with basic principles such as randomization are needed to establish cause-and-effect relationships.
Types of Experimental Studies
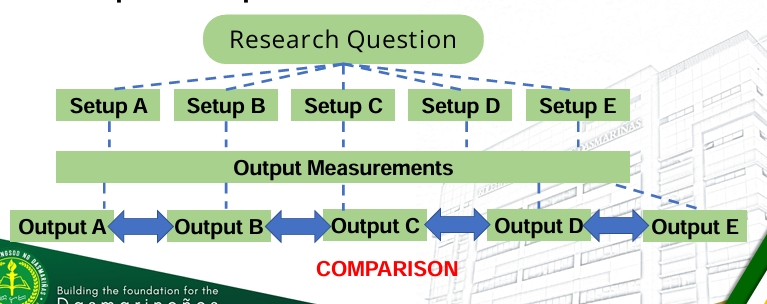
❑ Comparative Experiment – when a research study investigates the difference in output of two or more than setups.
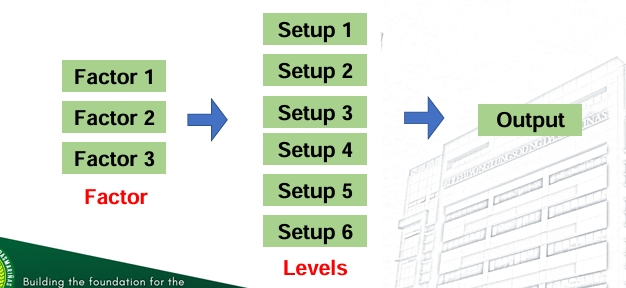
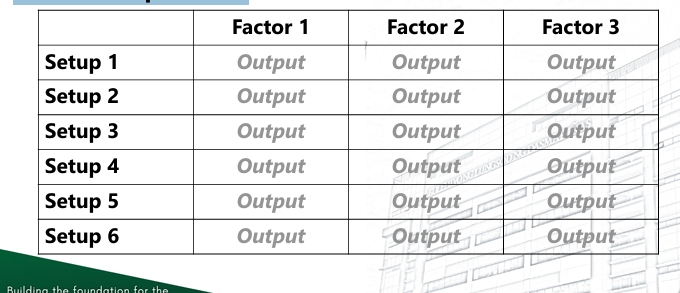
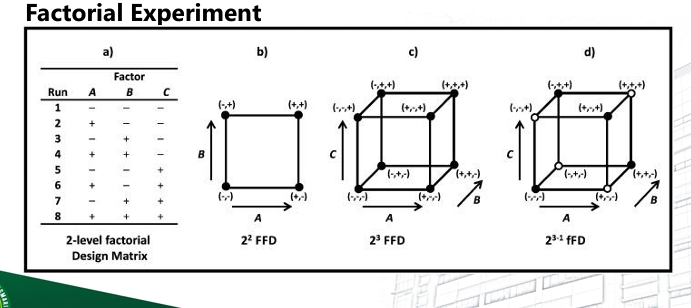
❑ Factorial Experiment – a research study that investigates different factors (or treatment) towards a certain output measurable as an indicator.- Each factor form a basic experiment of more than two settings
WERE SO CLOSEEEEEEE;)
🙂 😉 plsssssssssss
Comparative Experiment
Factorial Experiment
Factorial Experiment
Factorial Experiment
❑ An important advantage of factorial experiments is that they allow one to detect an interaction between factors.
❑ A fractional factorial experiment is a variation of the basic factorial arrangement in which only a subset of the factor combinations is actually tested
Key Terminologies in Experimental Study
❑ Factor– a variable whose effect on the response is of interest in the experiment
❑ Levels – the values of a factor used in the experiment
❑ Treatments – the factor-level combinations used in the experiment
❑ Experimental Unit – the smallest unit to which a treatment is applied
Key Terminologies in Experimental Study
❑ Response (Output) Variable - the outcome of interest to be measured in an experiment. (This is sometimes called the dependent variable.)
❑ Explanatory variable - a variable that attempts to explain differences among responses. (This is sometimes called the independent variable.)
❑ Confounding variable - a variable whose effect on the response cannot be separated from the effect of the treatments.
Key Terminologies in Experimental Study
❑ Block – a group of homogeneous (similar in characteristics) experimental units.
❑ Interaction Effect – when one factor produces a different pattern of responses at one level of a second factor than it does at another level
❑ Replication– the number of times a treatment appears in an experiment or the number of experimental units to which each treatment is applied in an experiment
Design of Experiments
❑ A protocol that describes exactly how the experiment is to be done is known as the design of an experiment.
❑ In order to develop an appropriate design for an experiment, first the researcher must identify major sources of variation that possibly affect the response.
Designs of Experiments
❑ Completely Randomized Design – treatments are assigned randomly to the experimental units
❑ Randomized Block Design – all experimental units are grouped by certain characteristics to form homogeneous blocks, and a completely randomized design is applied within each block.
DAs all mylove
well done
