AP stats unit 1
1/56
Earn XP
Description and Tags
Name | Mastery | Learn | Test | Matching | Spaced | Call with Kai | Chat |
|---|
No analytics yet
Send a link to your students to track their progress
57 Terms
define indivduals
person or thing described in set of data
define variables
attribute for individuals
define categorical variables
types and labels for responses
define quantitative variable
number-based responses, where a mean makes sense
equation for finding the whole with a part
%*(T)=P
T= total
P=part
how to show what a percentage of a variable in data is
P(a)=%
a=variable
How to show the percentage of 2 or more variables
P(AnB)=%
A and B= variables
n= and
How to show precentage of one thing given another (conditional probability)
P(a|b)=%
|=given that
A and B= variables
∩ =
intersection
∪ =
union
Bar graph are used for what kind of data
categorical
In bar graphs, the bars are…
not connected
You should use relative frequency instead of frequency when…
comparing 2 groups of different sizes
in side by side and segmented bar graphs, the x axis is…
explanatory
in side by side and segmented bar graphs, the y axis is…
response
do not use pie charts when..
individuals can fit into multiple categories
y axis should always…
start at 0.
In stem and leaf plots, one must always..
add a key
In histograms, there are no
gaps between bars
In histogram bars, the left side is __ and the right is _
included, excluded
define discrete data:
countable, not measureable (inf. sig-figs)
define continous data
infinate # of values, anything someone meaures phyically
for describing data, use the acronym:
SOCS
S=
shape
how to know which side a graph is skewed on
whichever side tails off
1 peak=
unimodal
2 peaks=
bimodal
evenly ish height=
uniform
always include ___ when describing a graph
context
O=
outlier
equation for high outlier:
Xi > Q3 + 1.5(IQR)
equation for low outlier:
Xi < Q1 -1.5(IQR)
Atl. outlier rule:
x̄ ± 2(Sx)
If there’s a question asking if there are any outliers…
You must prove there are or are not by testing both high and lowest values. Then prove by writing if it is or isn’t greater or less than ___.
C=
center
To find rank number of the median..
(n+1)/ 2
M=
population mean
x̄ =
sample mean
equation for mean:
x̄= 1/n ∑ xi
S=
spread
IQR=
Q3- Q1
Q1 and Q3 are
the medians of each half of data
IQR describes
how spread the middle 50% values are
Sx=
sample standard deviation
Sx equation:
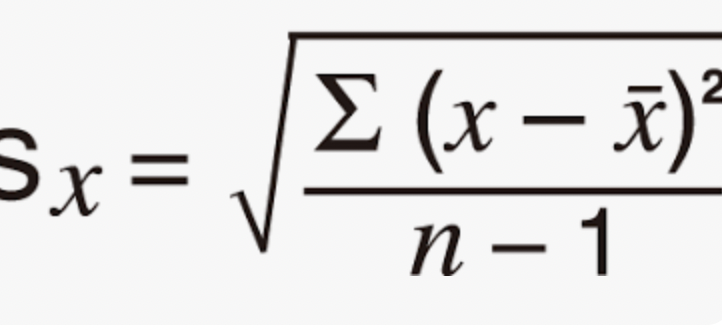
σ=
population standard dev.
When describing Sx, say…
The typical individual varies from the mean by Sx amt.
For skewed date, use:
median and IQR
for symettric data, use
mean and standard deviation
generally, when mean> median…
skewed right
generally, when mean< median…
skewed left
define statistic…
data on a sample
define parameter…
data on a population
Order of 5-number summary:
(min, Q1, med, Q3, max)
Box plots break data into..
quarters
box plots do a bad job at..
showing the shape of the data