Biostatistics
 Call Kai
 Learn
Learn Practice Test
 Spaced Repetition
 Match
Match Flashcards
 Knowt Play
1/72

There's no tags or description
Looks like no tags are added yet.
Name | Mastery | Learn | Test | Matching | Spaced | Call with Kai | Chat |
|---|
No analytics yet
Send a link to your students to track their progress
73 Terms
population
entire set of measurement for a given parameter (N)
sample
subset of population, measurements actually made (n)
frequency distribution
an arrangement of data that indicates how often a particular score or observation occurred
measures of central tendency
mean, median, mode
population mean vs sample mean
pop - 𝜇
sample - 𝑋
mean equation
𝜇 = ∑𝑋/𝑁 - population
sample = X = ∑𝑋/n
∑𝑋 = raw scores (sum of all the data points)
N = population size
n = sample size
mean
- balance point
- average
- sum of all the data points divided by the number of points
- measure of central tendency
- sensitive to all raw data points
average distance from the mean
mean is the value that the sum of the differences between the mean and all other values is 0
- so avg difference is 0
mean of frequency distribution
measure of central tendency of the distribution but does not describe the entire distribution
mean is used when calculating what other measures?
standard deviation, coefficient of correlation, standard errors
asymmetrical distribution
a distribution of scores in which there is not an exact correspondence in arrangement on the opposite sides of the middle line
median
the middle score in a distribution; half the scores are above it and half are below it
- divides the distribution in half
- not sensitive to every data point
what is a better measure for an asymmetrical distribution?
median
mode
the most frequently occurring score(s) in a distribution
- greatest frequency
- easiest to compute
standard deviation
measure of the variability of the distribution
- square root of deviation
- measure of the average deviation from the mean
population - 𝜎 (sigma)
sample - S
average deviation
An alternative measure of variation that, like the standard deviation, indicates the average difference between the scores in a distribution and the mean of the distribution.
variance
standard deviation squared
standard deviation in excel
uses n-1, due to the central limit theorem
interquartile rage
middle 50% of the data (the box)
Q3-Q1
distributions are split into
4 equal areas or quartiles
- 25%
q1
25th percentile
q2
up to 50%, median, divides into half
q3
75th percentile
q4
maximum value, 100th percentile
range
maximum raw value - minimum raw value
percentiles
indicate the distance of a score from 0
- 100 equal parts (1% each)
box and whisker plot
A graph that displays the highest and lowest quarters of data as whiskers, the middle two quarters of the data as a box, and the median
max and min values on box and whisker plot
do NOT include outliers
outlier
value greater than Q3 + 1.5x IQR
or
value less than Q1 - 1.5x IQR
mean measure of variability
standard deviation
median measure of variability
interquartile range
mode measure of variability
range
probability experiment
a chance process that leads to well-defined results called outcomes
outcome
the result of a single trial in a probability experiment
sample space
the set of all possible outcomes of a probability experiment
probability equation
P(E)= (Number of outcomes E) / (Total number of outcomes in sample space S)
E = event
probability of any event E is a number between?
0 and 1
the sum of all probabilities of all the outcomes in a sample space is
1
If an event cannot occur (i.e. is not a member of the sample space), its probability is?
0 → P(E) = 0
If an event is certain, its probability is?
1 → P(E) = 1
Two events are mutually exclusive events if they?
cannot occur at the same time.
probability of mutually exclusive events
P(A or B) = P(A) + P(B)
Two events are not mutually exclusive events if they can?
occur at the same time.
probability of non-mutually exclusive events
P(A or B) = P(A) + P(B) - P(A and B)
Two events A and B are independent events if the fact that?
A occurs does not affect the probability of B occurring
probability of independent events
P(A and B) = P(A) x P(B)
relative risk
probability of disease in exposed group/ probability of disease in unexposed group (controls)
odds in favor of an event with a probability p is
p/1-p
if p is 1/2, the odds are?
1:1 odds in favor
if p = 2/3 then the odds are
2:1 odds in favor
odds ratio (OR)
odds of disease in exposed group/odds of disease in unexposed group
Odds ratio is often a better?
statistical parameter
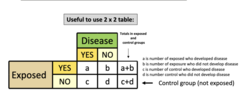
odds ratio: 2 x 2 table
a is number of exposed who developed disease
b is number of exposure who did not develop disease
c is number of control who developed disease
d is number control who did not develop disease
odds of disease in exposed group
((a/a) + b) / (1-(a/(a+b))) = a/b
odds of disease in unexposed group
((c/c) + d) / (1-(c)/(c+d)) = c/d
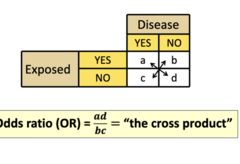
odds ratio in a case control study is a?
cross product
= ad/bc the cross product
variable
Any characteristic that can be measured
discrete variable
can assume only a finite or countable number of outcomes
continuous variable
can take on any value within a specified interval
sum of all probabilities must equal?
1
binomial distribution
- There must be a fixed number of trials
- Each trial can have only two outcomes
- The outcomes of each trial must be independent of each other
- The probability of success must remain the same for each trial
a binomial distribution can be used to describe?
Can be used to describe:
1. Number of siblings who inherit a certain genetic trait
2. Number of patients who experience adverse reaction to drug
3. Quanta release (or not release) from synaptic cleft
binomial distribution formula
P(X)= n!/((n− X)!X!)p^xq^(n-x)
P(x) is the probability of X successes in n trials
X is the number of successes for n trials
n is the number of trials
p is the probability of success
q is the probability of failure
Excel binomial formula
+binom.dist(x,n,p,true/false)
true - looking for success probability
false - looking for exactly x success
Poisson Distribution is useful when?
n is large and p is small
Poisson Distribution conditions
1. The random variable X is the number of occurrences of an event over some interval. The interval can be for example: time, length, area, volume, etc...
2. The occurrences occur randomly
3. The occurrences are independent of one another
4. The average number of occurrences over an interval is known.
Poisson Distribution can be used to model
• number of particles emitted from radioactive material
• number of bacterial colonies growing on a Petri dish
• number of motor vehicle accidents per year
• number of plants growing per acre
• number of nucleotide based substitutions in a gene over a period of time• number of offspring
• number of Koala per square mile in Australia
poisson distribution formula
P(X )= (e^-λ)(λ^x)/x!
P - probability of X occurrences in interval for a variable
λ - the mean number of occurrences per unit
normal/gaussian distribution is a function described by what two variables?
u: mean
o: standard deviation
normal/gaussian distribution with a different mean and the same SD
same width

normal/gaussian distribution with a different SD and the same mean
different widths

z score
a measure of how many standard deviations you are away from the norm (average or mean)
- quantitative comparison of different normal distributions
= (value - mean)/standard deviation
In statistics it is often useful to be able to calculate the ____ under a normal distribution
area