PSYC 210 Lecture 7: One-Sample and Two-Sample t-Tests
 Call Kai
 Learn
Learn Practice Test
 Spaced Repetition
 Match
Match Flashcards
 Knowt Play
1/65

There's no tags or description
Looks like no tags are added yet.
Name | Mastery | Learn | Test | Matching | Spaced | Call with Kai | Chat |
|---|
No analytics yet
Send a link to your students to track their progress
66 Terms
Z-test vs. One-sample t-test
Z-test uses population standard deviation; t-test estimates it using sample standard deviation.
Degrees of freedom (df) for a one-sample t-test
df = n − 1
Estimated standard error of the mean formula
s / √n
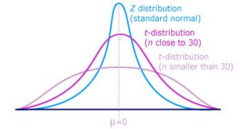
Relationship between t-distribution and sample size
As sample size increases, the t-distribution approaches the standard normal Z-distribution.
One-sample t-test formula
t = (x̄ − μ) / sx̄
Cohen's d for a one-sample t-test
d = (x̄ − μ) / s
Cohen's d small effect size threshold
0.2
Cohen's d medium effect size threshold
0.5
Cohen's d large effect size threshold
0.8
Null hypothesis for a two-independent-samples t-test
H0: μ1 − μ2 = 0
Pooled variance (s²p) formula
s²p = (SS1 + SS2) / (df1 + df2)
Degrees of freedom (df) for two independent samples
df = n1 + n2 − 2
Standard error of the difference between two means
√((s²p / n1) + (s²p / n2))
Homogeneity of variance assumption
The assumption that both compared populations have equal variances.
Welch Correction
An unpooled t-test adjustment used when population variances are unequal.
Independent samples t-test formula
t = (x̄1 − x̄2) / s(x̄1 − x̄2)
What Cohen's d represents
The standardized difference between two means, measured in standard deviation units.
Unit of analysis for an independent-samples t-test
The difference between two sample means (X₁ - X₂).
Why is the t-distribution a "family" of distributions?
There is a different t-distribution shape for every degree of freedom (N - 1).
Pooled variance (s²p) conceptual definition
A weighted average of the individual group variances.
Confidence interval formula for a one-sample t-test
CI = x̄ ± (tcrit × sx̄)
Confidence interval formula for an independent-samples t-test
CI = (x̄₁ - x̄₂) ± (tcrit × s(x̄₁ - x̄₂))
When is a confidence interval typically omitted in NHST?
For one-tailed hypothesis tests.
Four steps of NHST for independent-samples t-test
1) Specify hypotheses, 2) Set decision criteria/null distribution, 3) Calculate test statistic, 4) Make binary decision.
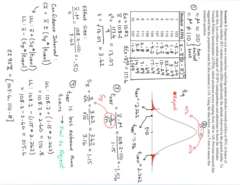
SFU sample statistics in the satisfaction scenario
n = 10, mean = 7.2, sum of squared deviations = 67.6, variance = 7.51, SD = 2.74.
UBC sample statistics in the satisfaction scenario
n = 10, mean = 4.6, sum of squared deviations = 64.4, variance = 7.15, SD = 2.67.
Degrees of freedom calculation in the SFU vs. UBC scenario
df_total = 10 + 10 − 2 = 18.
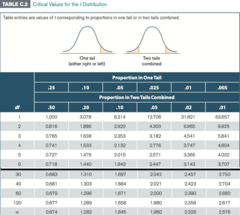
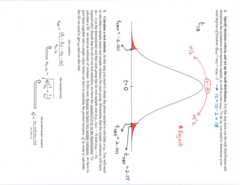
Critical t-value (t_crit) for α = .05 (two-tailed, df = 18)
t_crit = ±2.101.
Pooled variance (s²_p) result in SFU vs. UBC scenario
s²_p = [9(7.51) + 9(7.15)] / 18 = 7.33.
Standard error (s(x̄₁−x̄₂)) result in SFU vs. UBC scenario
s(x̄₁−x̄₂) = √(7.33 × (1/10 + 1/10)) = 1.21.
Obtained t-statistic (t_obt) in SFU vs. UBC scenario
t_obt = (7.2 − 4.6) / 1.21 = 2.15.
Binary hypothesis decision in SFU vs. UBC scenario
Reject H₀ because t_obt (2.15) is more extreme than t_crit (2.101).
Calculated effect size (Cohen's d) for SFU vs. UBC scenario
d = 2.6 / √7.33 = 0.96 (a large effect).
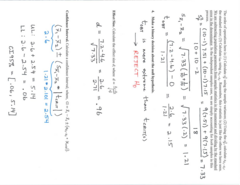
95% Confidence Interval for mean difference (SFU vs. UBC)
CI_95% = 2.6 ± (1.21 × 2.101) = [.06, 5.14].
Why t-distributions have heavier tails than the Z-distribution
Using sample standard deviation adds extra uncertainty, increasing tail probability for extreme values.
Role of the Central Limit Theorem in t-tests
It ensures sampling distributions of means approximate normality as sample size grows.
Theoretical purpose of pooling variance
It combines group information to get a better overall population variance estimate.
Consequence of violating homogeneity of variance
It distorts Type I error rates, making standard t-tests unreliable.
Why effect size is necessary alongside hypothesis testing
Hypothesis tests show if an effect exists; effect size measures practical magnitude.
How larger sample size affects t-test power
Larger samples reduce standard error, making true population differences easier to detect.
Theoretical meaning of degrees of freedom in variance estimation
The number of values free to vary after sample mean calculation.
Shared assumptions of Z-tests and T-tests
Random sampling, independent observations, and normal population distribution (or large sample).
Z-test vs T-test distribution type
Z-test uses the standard normal distribution; T-test uses the t-distribution.
Shape flexibility of t-distribution vs Z-distribution
Z-distribution has a fixed shape; t-distribution shape changes based on degrees of freedom.
Main reason t-tests are used over z-tests in research
Population standard deviation (σ) is almost always unknown in real research.
Standard deviation parameter difference in formulas
Z-test formula uses population SD (σ); t-test formula uses sample SD (s).
When to use a one-sample t-test
Comparing sample mean to population mean when population standard deviation (σ) is unknown.
Step 1: Given information needed for a one-sample t-test
Population mean (μ), sample mean (X̄), sample SD (s), sample size (n), alpha (α).
Step 2: Key phrases for a two-tailed test hypothesis
"Different," "affect," or "change" (H₀: μ = μ₀, H_A: μ ≠ μ₀).
Step 2: Key phrase for a right-tailed test hypothesis
"Greater than" (H_A: μ > μ₀).
Step 2: Key phrase for a left-tailed test hypothesis
"Less than" (H_A: μ < μ₀).
Step 3: Degrees of freedom formula for one-sample t-test
df = n − 1
Step 4: Standard error (SE) formula for one-sample t-test
SE = s / √n
Step 5: Formula for calculated/obtained t-value
t = (X̄ − μ) / SE
Step 6: Inputs required to find critical t-value in t-table
Alpha level (α), degrees of freedom (df), and number of tails (one vs. two).
Step 7: How to compare obtained t-value to critical t-value
Ignore the sign and compare absolute values (|t_obt| vs. |t_crit|).
Step 8: Decision rule to reject H₀
Reject H₀ if |t_obt| > |t_crit|.
Step 8: Decision rule to fail to reject H₀
Fail to reject H₀ if |t_obt| < |t_crit|.
Step 9: Wording when rejecting H₀
There is sufficient evidence to conclude a significant effect exists.
Step 9: Wording when failing to reject H₀
There is insufficient evidence to conclude a significant effect exists.
Memory Trick acronym for one-sample t-test steps
S-H-D-S-T-C-D-C (Statistics, Hypotheses, df, SE, t-obt, t-crit, Decision, Conclusion).
Relationship between independent-samples and two-sample t-tests
An independent-samples t-test is a specific type of two-sample t-test used for unrelated groups.
Types of two-sample t-tests
Two-sample t-tests include independent-samples t-tests (unrelated groups) and paired-samples t-tests (matched/repeated measures).
Independent-samples vs. Paired-samples t-test target data
Independent-samples tests compare separate groups; paired-samples tests compare two measurements from the same or matched subjects.
Core assumption of independent-samples t-tests
Observations between and within the two groups must be completely independent.
Sample size requirement difference
Independent-samples t-tests can have different group sizes (n₁ ≠ n₂); paired-samples t-tests require equal sample sizes.