1) Relationship between population and the environment
1/39
There's no tags or description
Looks like no tags are added yet.
Name | Mastery | Learn | Test | Matching | Spaced |
|---|
No study sessions yet.
40 Terms
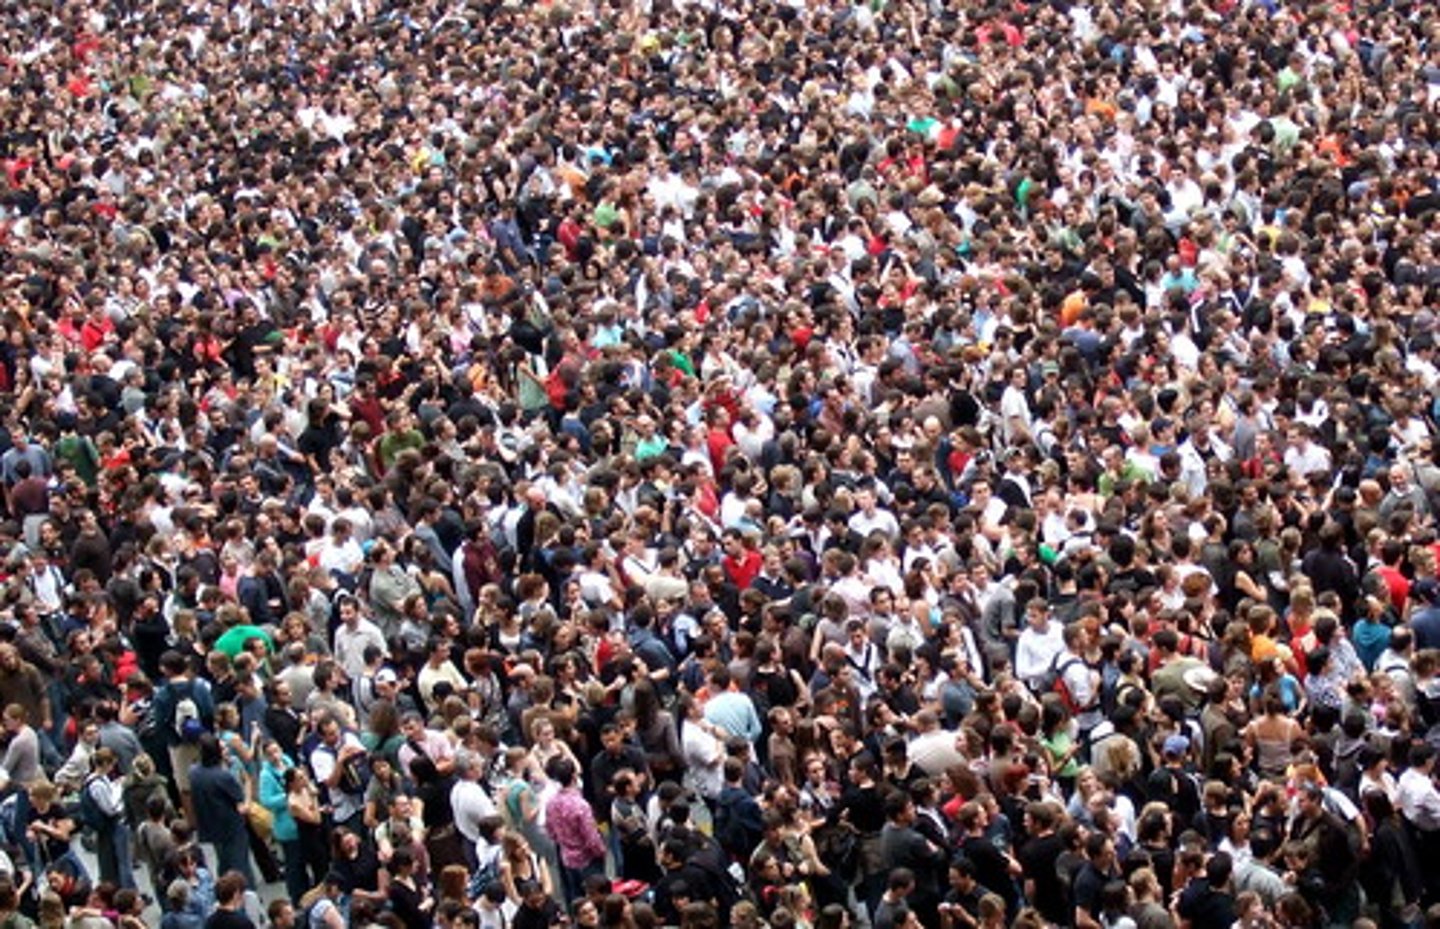
how many people are there on earth
8 billion
how much of the world is covered by water
3/4 of the world = bodies of water
difference in populations between HICs, LICs and NEEs
LICs and HICs tend to have smaller, more stable populations
NEEs tend to have fast growing populations
Population parameters
Population distribution
Population density
population distribution
= the pattern of where people live
population density
= the number of people living in an area (usually given as people/km2)
e.g.,
outer Hebrides = 1 persons/km2
London = 5,500 people/km2
Manilla = 44,500 people/km2
if the population of the world was evenly distributed, there would be just 50 people per km2
factors affecting population density
climate
soil
distribution of resources
water supply
climate
- temperate climate is needed for livestock and crop cultivation
- rainfall and sunlight are needed for plant growth
- diseases breed in hot countries
- climate change
- work conditions (Svalbard, frostbite when working outside, darkness)
soils
fertile soils allow crop cultivation
- only 1/32 of the world is cultivatable
- permafrost or dry land are not suitable for crop growth, and therefore cannot support a populations food demands/economic activity
- type of farming depends on soil fertility
- more fertile soils may come with a risk of natural hazards, decreasing population densities
distribution of resources
- concentration of resources allows industrialisation to occur, attracting people to the area so it becomes more densely populated
- fossil fuels
- minerals
- lack of resources can cause people to move away from an area so it becomes less populated
water supply
- water needed for sanitation, farming, drinking, industry, energy, etc.
- dry areas are scarcely populated due to lack of water supplies
- 3/4 of world = covered in water, but only 1.2% of this is drinkable
- 95% of Egypt's population are situated by the Nile
population parameters EGYPT
95% of Egypt’s population lives within 12 miles of the Nile, even though this region accounts for only 4% of the country’s land area.
Major cities, including Cairo and Alexandria, have grown along the Nile due to the availability of water. These areas have high economic activity, driven by agriculture, manufacturing, and trade.Without the Nile, Egypt’s ability to support its population would be severely limited, as most of the country is too dry and inhospitable for large-scale habitation
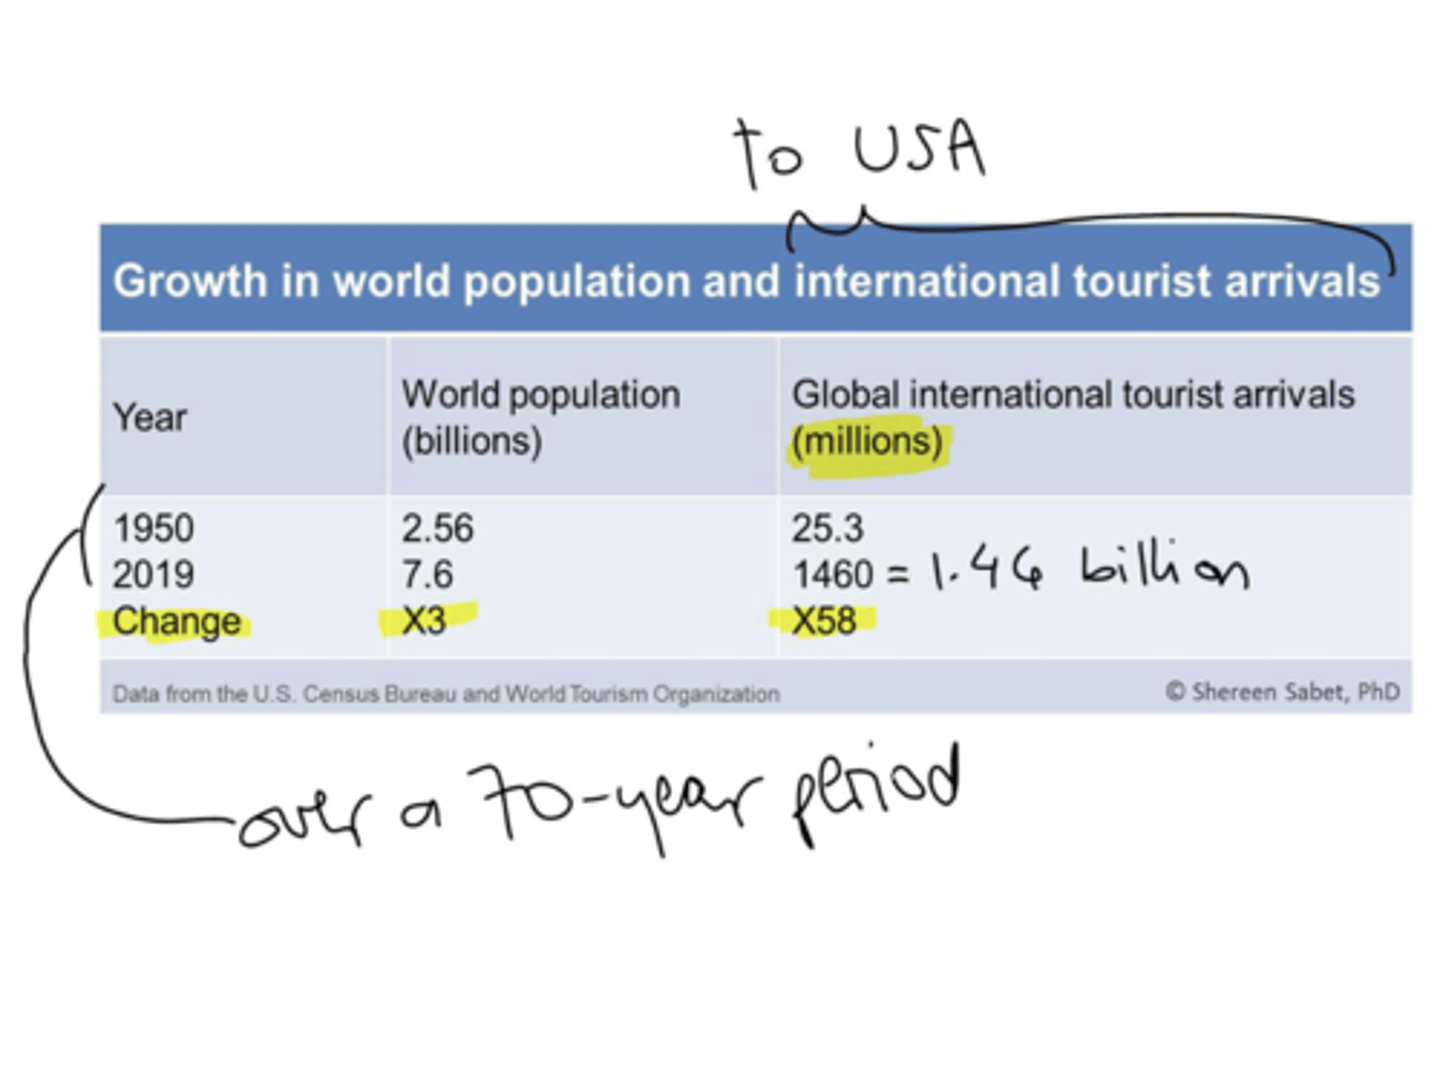
How has global population changed over time?
population has been growing at the slowest rate since the 1950's
2/3rds of the population live in countries where fertility is below 2.1 births/woman
the level for 0 growth in long run = a population with very low mortality
global patterns of population change and density
highest in central africa and central america
lowest in more developed countries in EU and USA + canada
Montenegro is an anomaly as the rest of EU growth rate is relatively low
projected increased in global population for 2050
over 1/2 of the projected increase in global population (2050) is concentrated in 8 countries
1. DRC
2. Egypt
3. Ethiopia
4. India
5. Nigeria
6. Pakistan
7. Philippines
8. Tanzania
countries of sub-saharan Africa are expected to contribute more than 1/2 of the increase anticipated through 2050
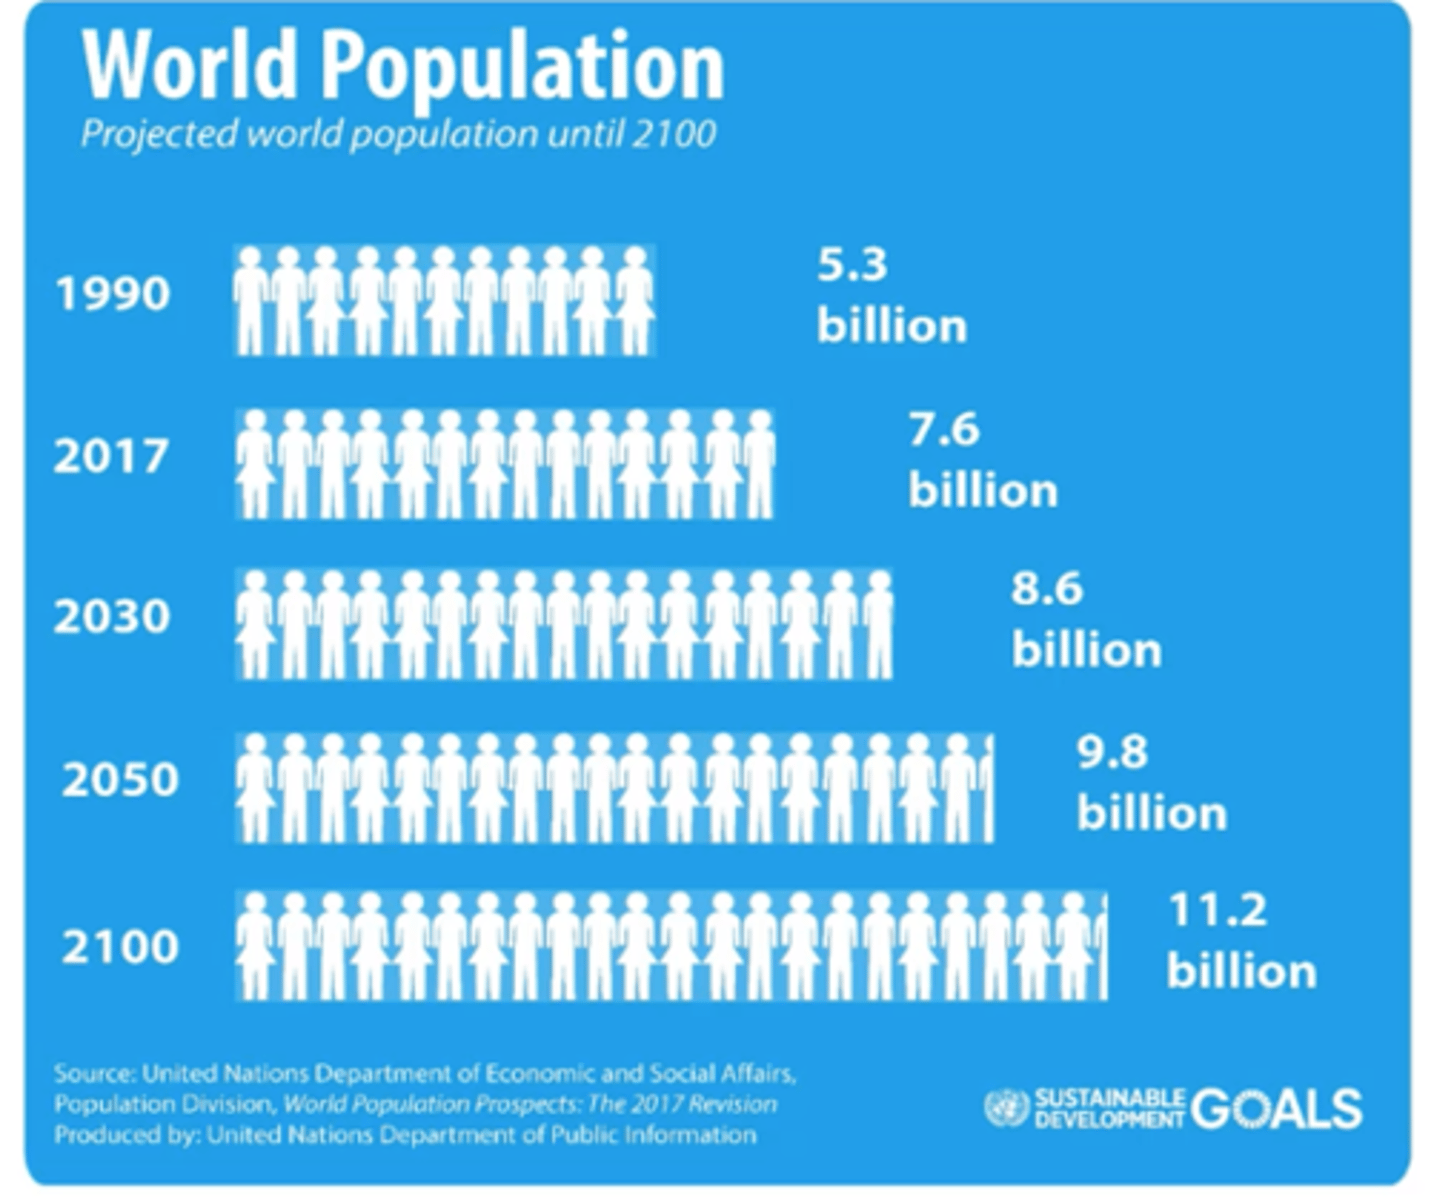
UN on global population increase
"amid falling growth rates, global population projected to peak around 10.4 billion in the 2080's"
total population numbers
the raw figure of total population in an area at any scale
percentage change in population
the number of people added to or subtracted from a population in a year - expressed as a %
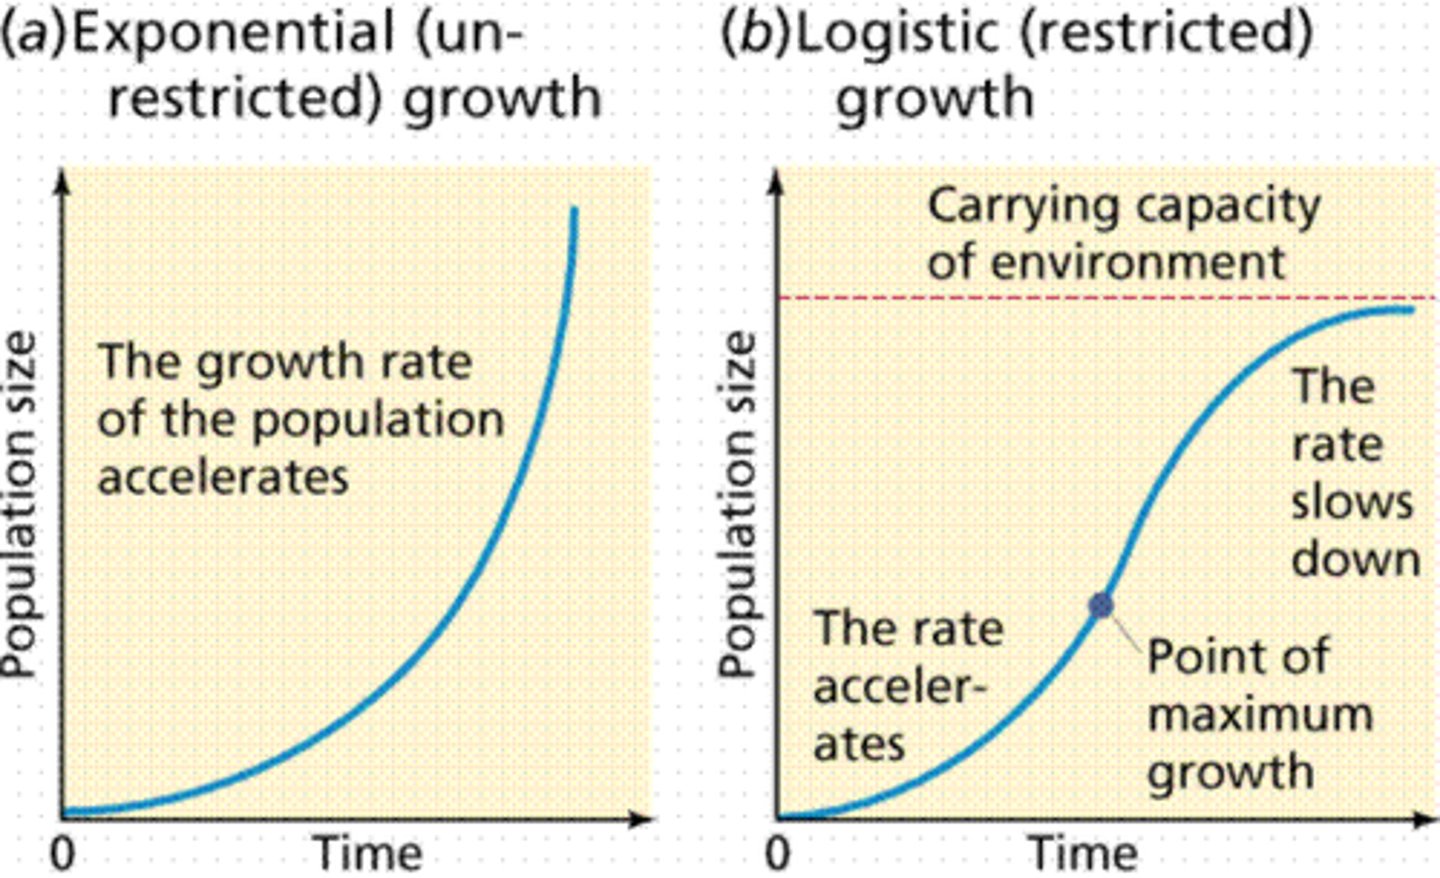
population growth graph
exponential graph
at first a "J" curve
(a growth curve that depicts exponential growth)
will eventually turn into an "S" curve
(exponential growth of J-curve is bent to horizontal and converted to S-curve; population die-back)
Reasons for population growth
1. improved medical conditions
2. better quality of life
3. lower infant mortality rates
4. industrialisation
5. sources of labour
6. traditional and cultural significance of family
1. improved medical conditions
= health care improvement so less people die of disease and illness
higher life expectancy and lower death rate
e.g., NHS, development of drugs to treat diseases and new medical treatments (chemotherapy)
2. better quality of life
= improved sanitation, housing standards, physical and mental wellbeing, jobs and economic development
e.g., removing asbestos from houses, mindfulness about diet and exercise, washing hands
people who want families are now able to have them
less people contracting illness and disease
3. lower infant mortality rates
= vaccinations, medical procedures, care for babies and for women
washing medical tools before use, knowledge about drinking and smoking whilst pregnant, care for newborns and mother
fewer stillbirths + miscarriages as well as fewer deaths of women from giving birth
4. industrialisation
= more resources available to more people
transport and flows of goods
globalisation and urbanisation as a consequence of industrialisation
e.g., more jobs become available in cities, more people move there, have a better quality of life + access to health care
5. sources of labour
= children a considered as sources of labour in LICs
... can work to provide an income
with high infant mortality rates, mothers often birth as many children as possible to ensure some survive to adulthood
children can work to support family, the more children = the more sources of income
6. traditional and cultural significance of families
pride in having large families, collectivist societies
carrying on traditions
e.g., India, having a large family is seen as an accomplishment
prohibition of abortion and contraceptives
e.g., catholic countries (Ireland, banned until 1978), Southern states in USA Roe vs. Wade
e.g., African countries among the most morally against contraceptives
Reasons for a decrease in population
1. death rates begin to overtake birth rates
2. women give birth later in life
3. disease
4. government policies and laws
5. contraception
1. death rates begin to overtake birth rates
= ageing populations
e.g., Japan, recorded fewest number of child births in 2022 in 123 years
e.g., UK, death rate began to overtake birth rate for the first time since 1976
2. women give birth later in life
= the emancipation of women
...can now have jobs, careers and average age for giving birth is now 31 in England and Wales
= less years available to get pregnant, harder to get pregnant as women get older
average age for first pregnancy in 1940 was 25 (UK)
2021 figures showed average age was 31
3. disease
bubonic plague
... epidemic killed an estimated 30% to 50% of the entire European population
covid-19
... epidemic caused an increase in mortality rates and a lower life expectancy for elderly, contributing to 12% of all global deaths that year
4. government policies and laws
China's one child policy
... control the growing population
= reduced fertility rate
= skewed sex ratio to males, fewer females in 20 years time to give birth
COUNTER
North Korea
... Kim Jong Un banned contraceptives and abortions
5. contraception
more education around topic
less stigma as religion becomes modernised
UK and Australia most common method = the pill
male and female condoms
contraceptive ban lifted in Ireland in 1978
development process
- Farming and agriculture
... more food available to population, allowing it to grow
- Empires and cities
e.g., roman empire, Han dynasty, Mongolian empire, etc.
... all contributed to a sharing of resources and ideas
- Silk Road Trade
... more resources available to more people, food and goods traded to each other
- Age of exploration
... discovery of new countries + continents meant that there was more land for people to live on, migration occurred new cities became populated
e.g., discovery of North America
- Industrial Revolution
... more resources became available, urbanisation
- Information age
... modern technology, improvements to health care, communications, quality of life improved
e.g., globalisation
Niger
highest fertility rate in the world of 6.6 (2023)
- poorest place on earth (UN human development)
- drought stricken country, malnutrition, and starvation
... 2.5 million of the 17 million people have no secure food source
Poverty, Ignorance and a lack of access to contraception
... Men in Niger tend to be polygamous, and spouses try to "prove their value" by competing against each other for number of child's birthed
(also believed that the pill causes haemorrhages or makes unborn children anaemic)
- at current projections, no. of inhabitants will have tripled from 2015 to 2050 at 55 million people
- political will to improve things is weak and government professes support, allocating only tiny proportions of budget to family planning
- only 1/4 of women express any desire to space out their births, let alone reduce number
improvement to Niger fertility rate
- Foreign funded health centres are promoting long-term options like contraceptive implants
- local health workers are being trained to distribute other prophylactics
- UNFPA (UN population fund) import millions of dollars worth of contraceptives
- "Schools for husbands" to teach men the importance if contraception and family planning
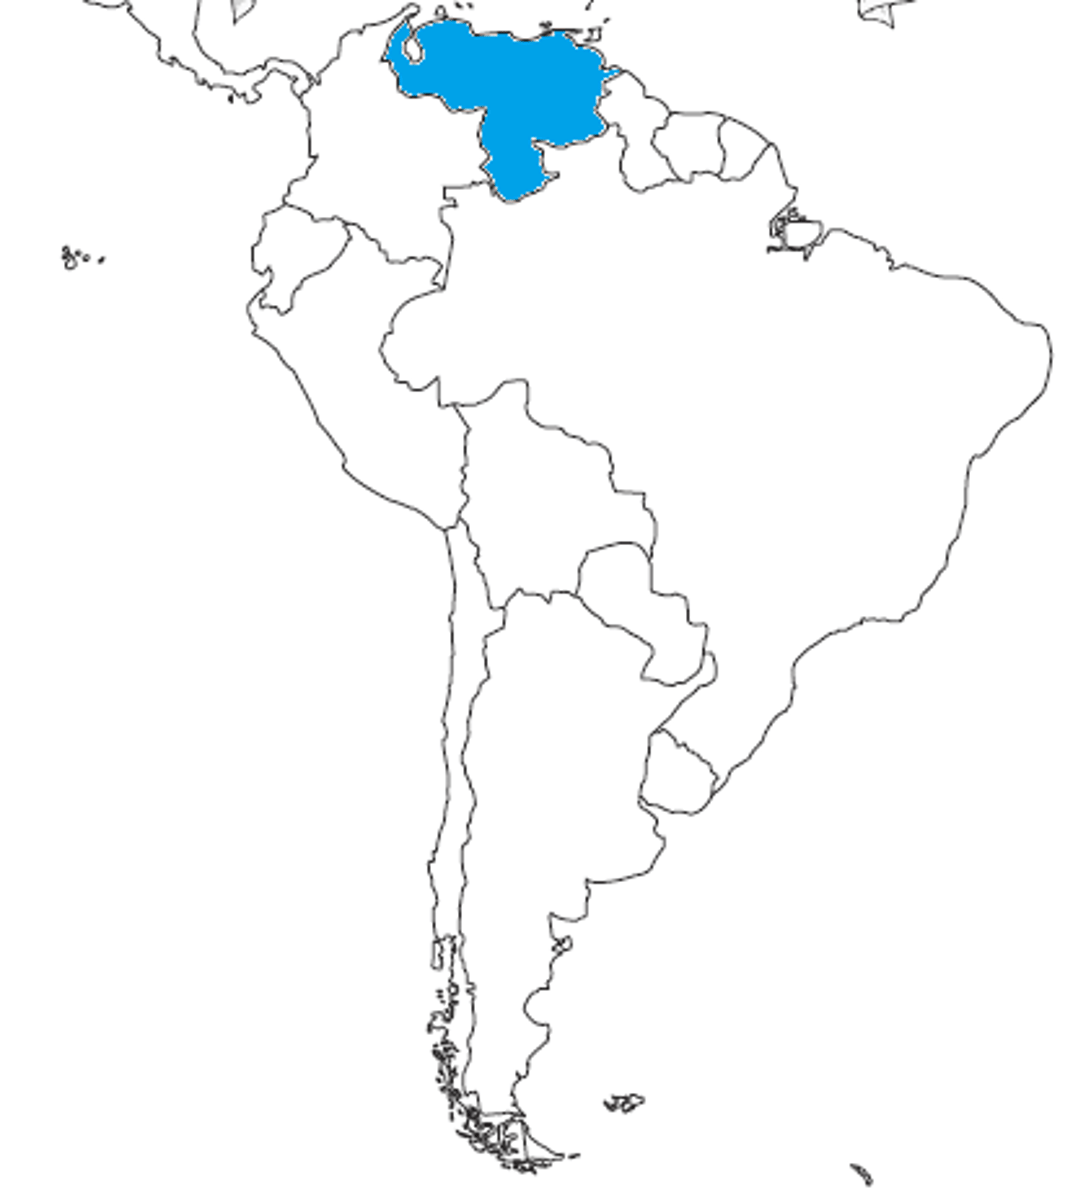
Venezeula
Level of development (GDP per cap):
= $2,624.41 USD
HDI value = 0.691 points (2021) = 120th
BR (per 1000):
16.99 births/1000
DR (per 1000):
6.55 deaths/1000
Physical environment:
Northern South America
- tropical climate
- Andes mountain range and highlands
- 52.1% forest
Population Parameters:
= 28,991,117 (2023)
- equivalent to 0.36% of world population
- 33 people/km2
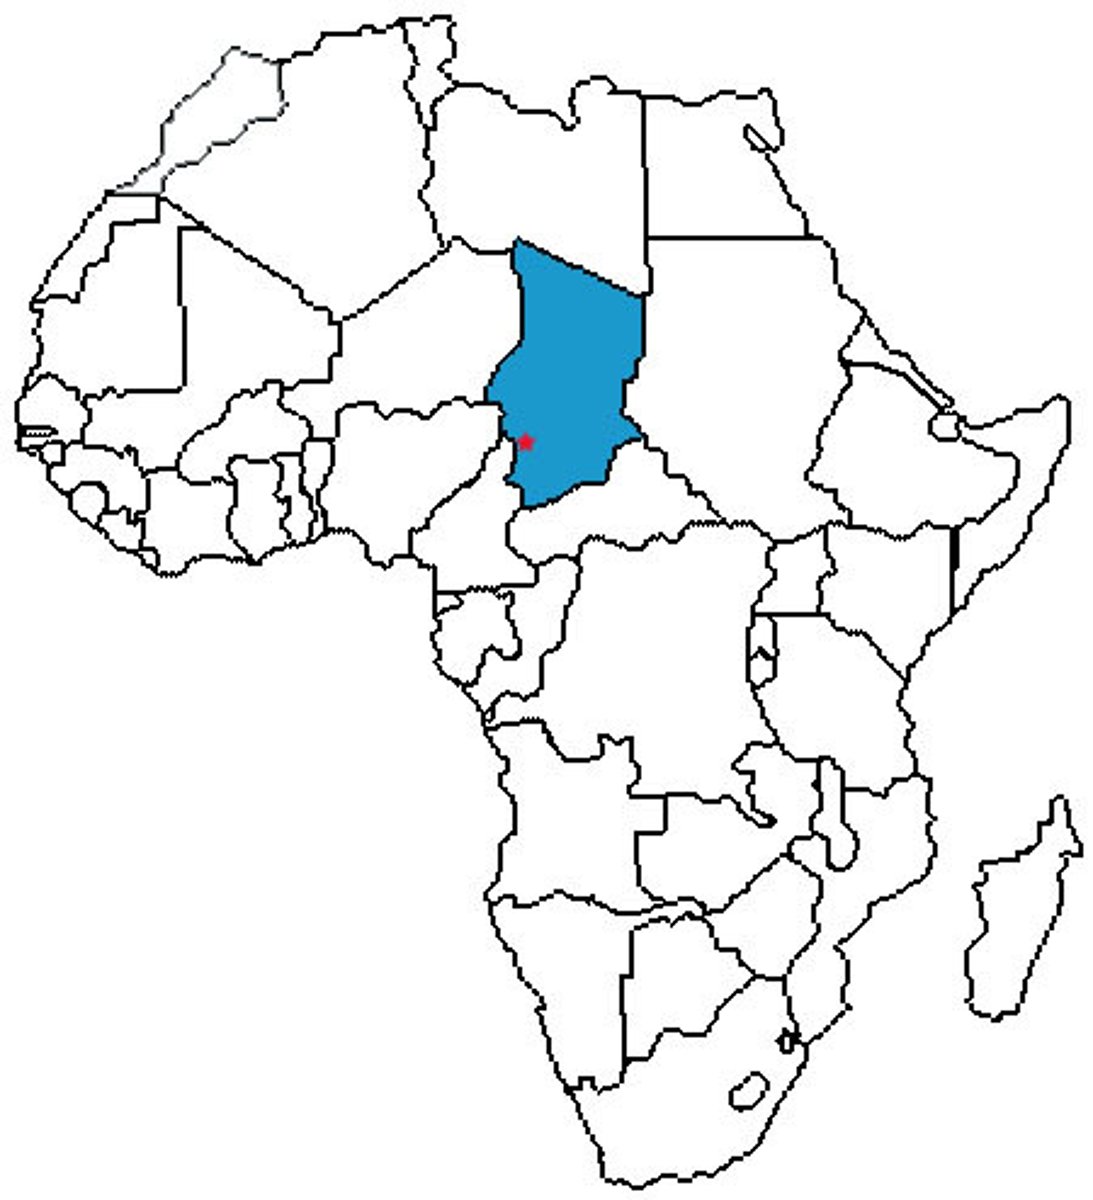
Chad
Level of development (GDP per cap):
= $717 USD (2021)
HDI value = 0.394 points (2021) = 190th
BR (per 1000):
40.417 births/1000
DR (per 1000):
12.1 deaths/1000
Physical environment:
Central Africa, South of Libya
- Landlocked, tropical in south
- desert in north
Mountains in the northwest
- arid plains in the centre
- lowlands in the south
- 39.6% agricultural land
Population Parameters:
= 18,433,510
(2023)
- Equivalent to 0.23% of world population
- Ranks 67th in list of countries by population
- 15 people per km2
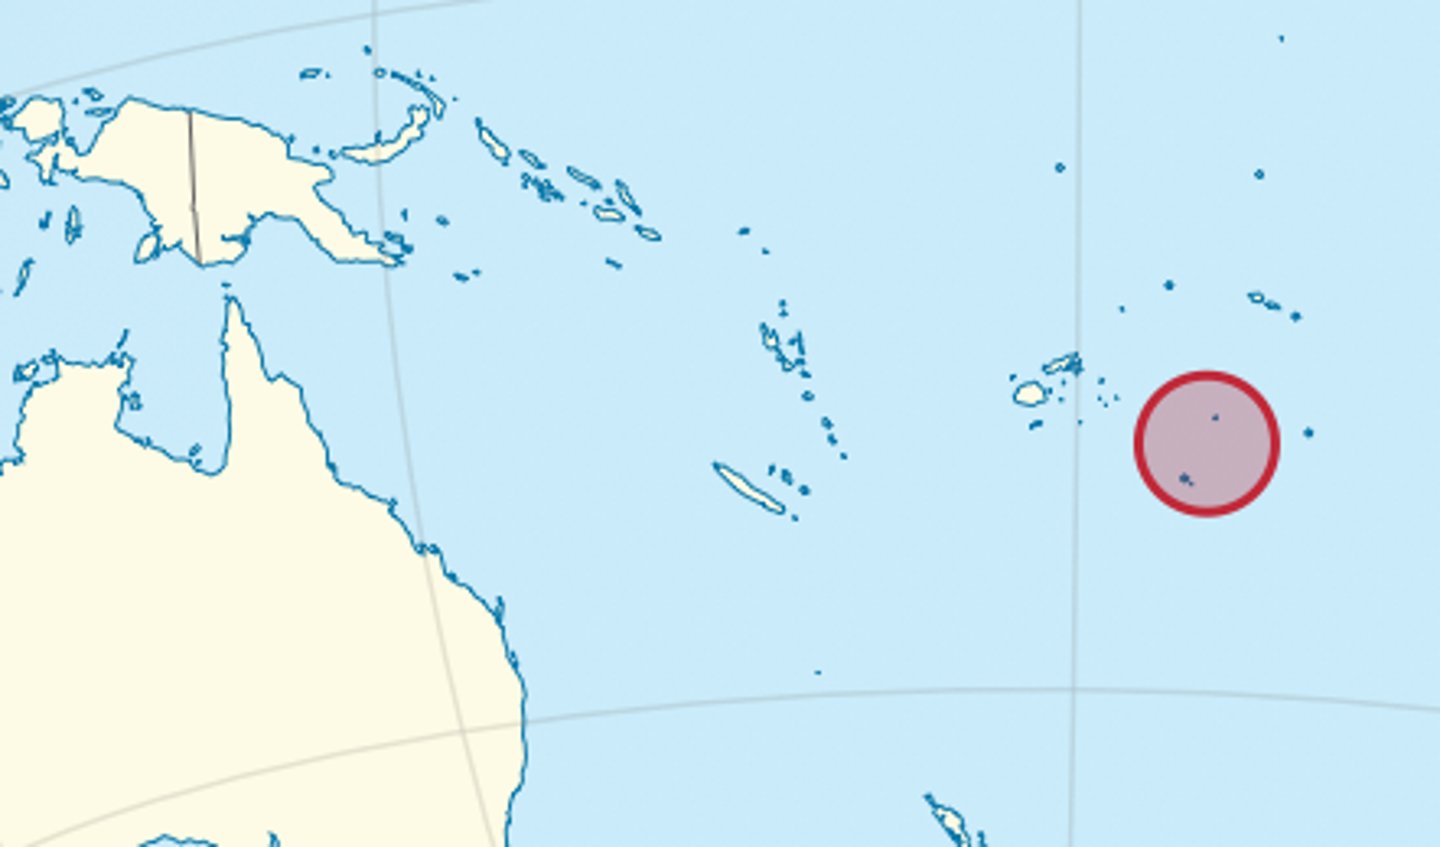
Tonga
Level of development (GDP per cap):
= $4,426 USD (2021)
HDI value = 0.745 points (2021) = 104th
BR (per 1000):
23.273 births/1000
DR (per 1000):
6.97 deaths/1000
Physical environment:
Oceania, archipelago in the South Pacific Ocean
- Tropical climate, modified by trade winds
- Mainly flat with limestone bedrock and volcanic rock
Population Parameters:
= 108,029
- Equivalent to 0% of world population
- 150 people per km2
Thailand
Level of development (GDP per cap):
= $7066.19 USD (2021)
HDI value = 0.800 points (2021) = 66th
BR (per 1000):
9.532 births/1000
DR (per 1000):
7.5 deaths/1000
Physical environment:
South-eastern Asia, borders the Andaman Sea and the Gulf of Thailand
- Tropical climate, rainy, warm, cloudy southwest monsoons + dry, cool, northeast monsoon
- Plains with mountains and plateaus in the east
Population Parameters:
- Equivalent to 0.89% of world populations
- 52% of population is urban
- 141 people per km2

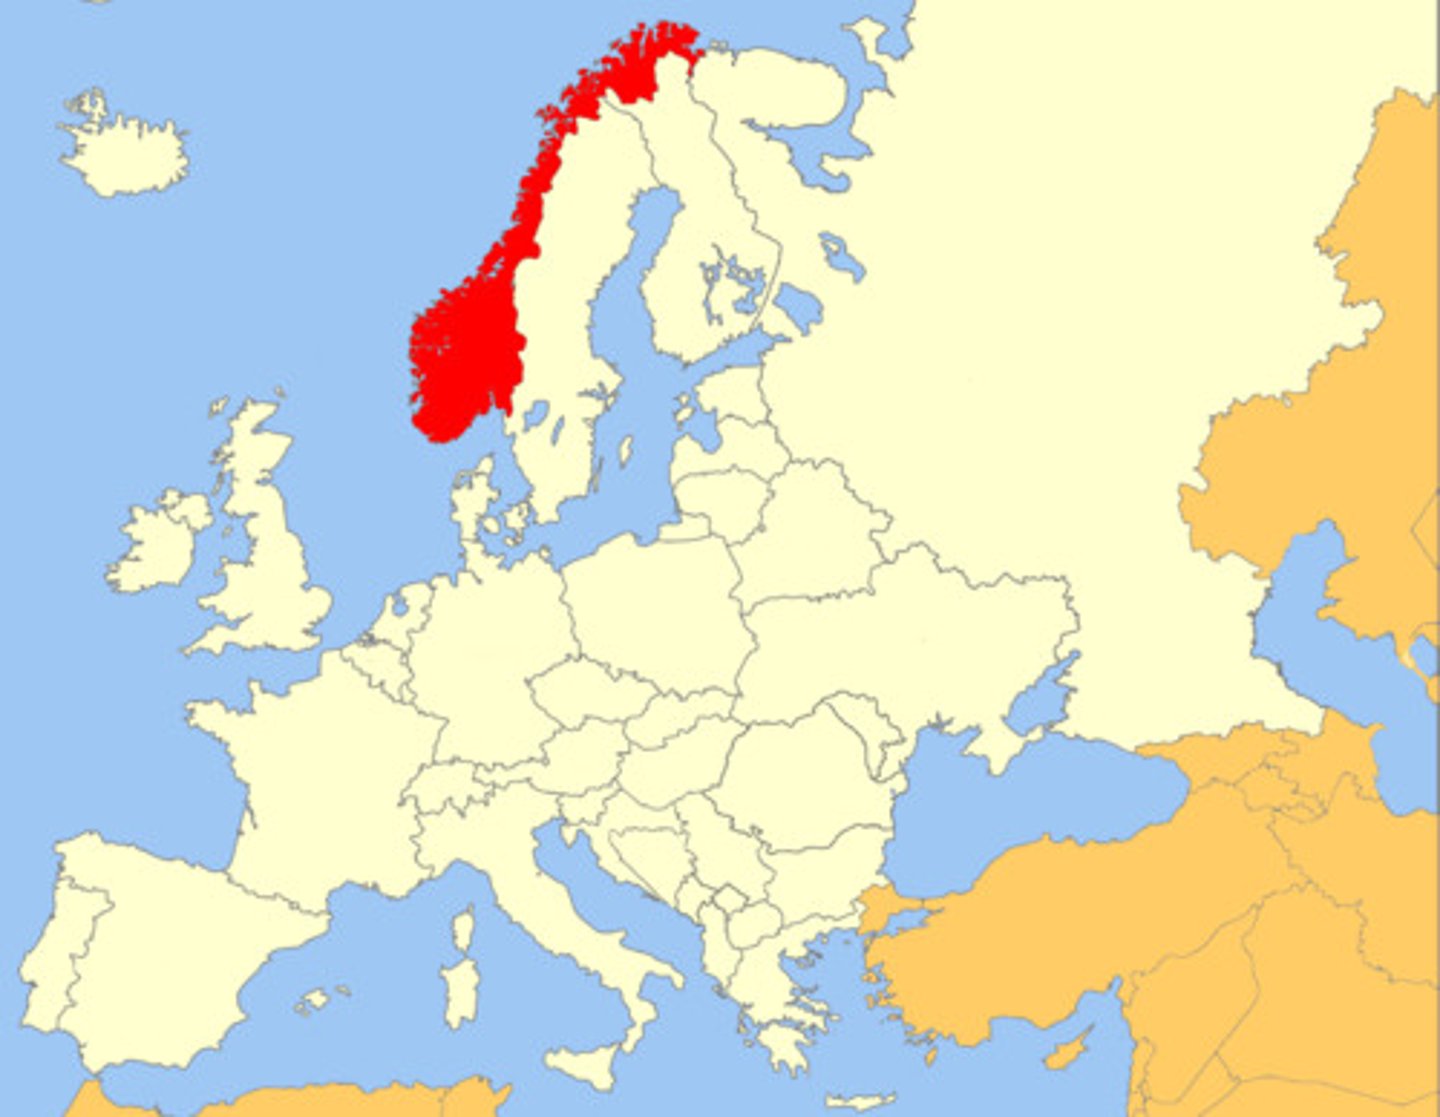
Norway
Level of development (GDP per cap):
= $89,154.28 USD (2021)
HDI value = 0.918 points (2021) = 2nd
BR (per 1000):
11.151 births/1000
DR (per 1000):
7.7 deaths/1000
Physical environment:
Northern Europe, bordering the North Sea and the North Atlantic Ocean
- Temperate climate along the coast
- modified by North Atlantic Current - colder interior with increased precipitation
Population Parameters:
- Equivalent to 0.07% of world population
- 86% of population is urban
- 15 people per km2