Biostats Midt1
1/108
There's no tags or description
Looks like no tags are added yet.
Name | Mastery | Learn | Test | Matching | Spaced |
|---|
No study sessions yet.
109 Terms
Why do statistical tests
-Determine whether patterns in data are real
-Quantify Confidence/uncertainty in a result/outcome
-Decide between alternative models/hypotheses
-Predict/extrapolate
-Avoid being mislead
-Make rigourous/informed decisions
-Deal with multiple comparisons
-Make inferences about population samples
Two types of science
- Hypothesis science
- Descriptive science
Hypothesis science
Tests one or more (scientific/biological) hypothesis
-A hypothesis is a causal explanation for a given phenomenon
-A prediction is what you expect to see, under the conditions of a specific study, if the hypothesis is true
Descriptive science
Characterizes and/or quantifies patterns in nature
-What are the important observed patterns?
->Are they real?
Types of study
-Manipulative
-Observational
Manipulative studies, explain descriptive VS hypothesis
Actively manipulating different kinds of parameters (adding, removing, transforming, etc.) to either.....
-Qualify/Quantify an event
-Test the hypothesis of a certain phenomenon
Observational studies, explain descriptive VS hypothesis
NOT manipulating (observe) different kinds of parameters and events happening in the context of wanting to...
-Qualify/Quantify an event
-Test the hypothesis of a certain phenomenon
What is a biological hypothesis (define)
Causal explanation for some pattern and predicts a certain result/outcome (i.e. pattern) given a particular study performed
What is statistical hypothesis testing (define)
A process of pattern testing that is used to help determine whether this outcome is observed
What is statistical significance?
A result that is statistically different from zero
What is biological significance
A result that is biologically relevant/important
Deduction (define)
Logical process used to derive a prediction from a hypothesis
-If H=true then, if we do study X, we should see prediction Y
Two types of probabilities
-Objective/physical (Out there)
-Subjective (Strength of Belief)
Probabilities: Objective/Physical (define)
Probabilities based on long-term frequencies (i.e. prior data) or a biological/physical model
Probabilities: Subjective (define)
A subjective assessment of the degree of belief
Frequentist statistics
Stats that use objective probabilities to draw true/false conclusions from a sample data
-Only the current data set is used
-P-value is interpreted as a long term frequency among an imagined set of repetitions
Bayesian statistics
Stats where prior probabilities are quantified and used as part of the calculations.
-Prior probabilities can be based on objective or subjective probabilities
-Combined with current data not to draw a yes/no conclusion, but to generate a credible interval for parameter estimates.
Parameters (General concept in stats)
Characterization of the observed population. For example: height, weight, age, lifespan, etc...
Statistics (In general)
Statistics are estimates of a population parameters
These are obtained from a finite sample of the population
Population (Define as a general concept)
Group about which researchers want to make inferences. Note: Same data can often be used to make inferences about different populations
-Need to have a population that matches your study
Accuracy
An accurate statistic is one for which its value, averaged over repeated samples from the same population, approaches the true population parameter.
-Low accuracy usually implies bias
Bias (define)
A systematic deviation of observations from the true value
Precision
A precise statistic varies little among repeated samples drawn from the same population
Examples of Independent observations
-Unrelated individuals/sampling units
-Spatial and temporal autocorrelation
-Phylogenetically distinct species
Explain what a Regression to the Mean is
A phenomenon where if a variable is extreme on its first measurement, it will tend to be closer to the average on its second measurement.
If its still extreme on the second try, it will tend to have been closer to the average on its first.
Why does a Regression to the Mean occur, explain
If CHANCE is partially responsible for the variability in the results obtained,
then if you select all the extreme values and re-test, the likelihood that CHANCE will cause them to all be very high again is extremely low;
meaning that their average will tend to be closer to the mean of the larger group
Different measures of central tendency (hint:two)
-Mean
Average of set of numbers
-Median
Middle number in a set of numbers
Why use mean
-Easy to compute
-Distribution properties is well known
-Influenced by outliers so most useful for symmetrical distributions
Why use the median
-More complex distribution properties
-Less influenced by outliers so can be useful for skewed distributions
Statistical Range (define & give the issue with it)
Largest and smallest values in sample
BIASED, because it consistently underestimates the population parametric range. This is because you can only get the extreme values by chance.
Confidence Intervals
Index of uncertainty - it quantifies the precision with which the population parameter has been estimated. The LARGER the interval, the LESS PRECISE (the less confidence we have in) our estimate.
Only account for sampling variance, not for uncertainty from other sources (bias)
The larger the sample size, the less likely it is that the sample estimate will be far off the mark
What does 95% Confidence intervals tell you
Does NOT tell you that there's a 95% chance of the true value being withing that CI
Tells you that with N repeated samples, 95% of the confidence intervals you obtain from those sampling would hold the true value
What are the components of a model
Dependent Variable
Independent Variable
Parameters
Unexplained Variability
Eg: Mental [ ] = Region + error
What are statistical models
A statistical analysis that uses data to estimate the parameters of a mathematical model
These models make certain assumptions about the population from which the data were sampled.
By estimating the parameters of the model, you can say smt about this population
Dependent Variable
Outcome or quantity of interest, to be predicted.
Eg. Metal [ ] in invertebrates
Independent Variable
Variable(s) hypothesized to affect (cause) the dependent variable or help predict it (correlate)
Eg. Location
Unexplained Variability
Variability in the dependent variable that can't be explained or accounted for by the independent variable(s).
Includes:
Error of instrument used to measure
Human error
Natural (eg. space/time) variability
Linear Regression equation (Basic model equation)
Y = a + b * X + E
Y: Dependent variable
a: parameter
b: parameter
X: Independent variable
E: Unexplained Variation
Difference/relation between statistical analysis and models
All stat analyses begin with a mathematical model that DESCRIBES the data (eg. regression)
What is model fitting
The process in which the model PARAMETERS are estimated
Types of Variables
Nominal
Ordinal
Interval
Ratio
Discrete/Continuous
Nominal Variable (define)
A unordered categorical variable
Can be binomial or multinomial (gender;nationality)
Ordinal Variable (define)
Ordered Categories
Eg. Performance: poor, ok, excellent
Interval Variable (define)
Numerical Values without a true 0 point
Eg. Temperature in C
Ratio Variable (define)
Numerical with a true 0 point
Eg. Metal [ ]
Interval/Ration Variable; Discrete VS Continuous
Discrete: Whole numbers
Continuous: Any numbers including decimals
Why care about the kind of variable
Will determine what kind of model we are going to apply to our statistical analyses
Independent variables will determine what kind of linear model (general or generalized) you're going to use
What is Dispersion
A measure of scatter or variability among data points
You can have three frequency distributions with identical means and sample sizes but differing in dispersion
The different kinds of measure of dispersion (hint: two)
Variance
Standard Deviation
Also: Coefficient of Variation
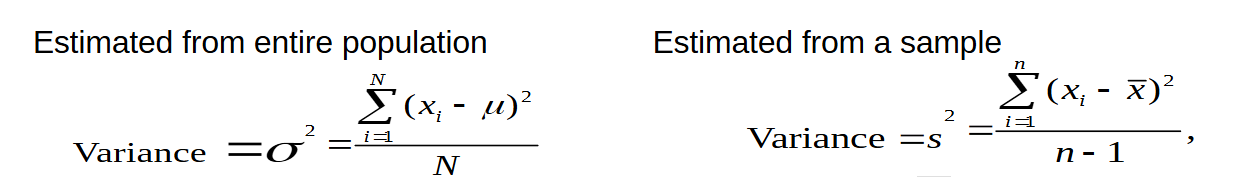
Dispersion; Variance
Sum of squared deviations from the mean divided y the sample size. Units are those of the data squared
Measures how much the data spread on average in squared
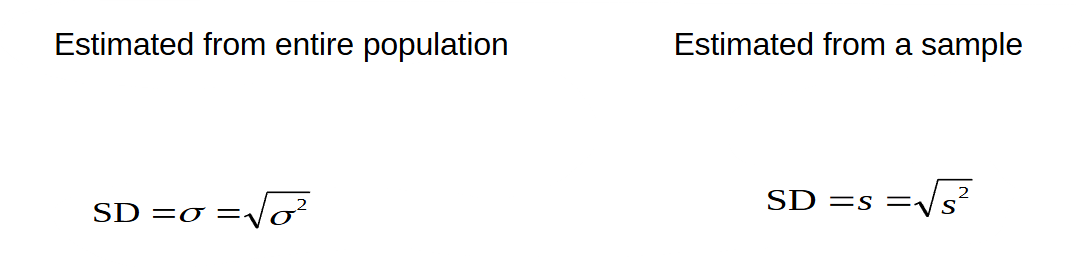
Dispersion; Standard Deviation
The square root of the variance. Same units as data
Measures how spread out or clustered a set of data is around its mean
Dispersion; Coefficient of Variation
The Standard deviation divided by the sample mean times 100
This expresses the standard deviation in relation to the mean.
Useful for comparing dispersion for variables with different units or widely different means
Why is the denominator of the formula for variance and SD from a sample: “n-1” rather than “n”
To remove the bias in our estimate of the population variance/SD.
Dividing by “n” is biased because the observations we take will be closer to the sample mean, rather than the population mean.
So, we need to decrease the size of the denominator ( “-1” ) to compensate for this.
What are Gaussian (normal) distributions
Distributions arise when many individual sources of random variation contribute additively to determining a value.
Bell shaped and symmetrical
Note: True normal distributions, median = mean
What are the Properties of a normal distribution
If within 1 of the mean:
68.3%
If within 2 of the mean:
95.4%
If within 1.96 of the mean:
95%
How do you obtain a standard normal distribution and what are their use
Obtained by scaling the distribution by converting observed values to standard normal deviates
It is used to make it easier to relate individual observations to the mean and SD, and to compare values sampled from different normal distributions
What does a Z transformation entail and under what context do we use it
When you want to standardize a Gaussian (normal) distribution
For each value, subtract the mean then divide by the SD
Note: Does not change overall shape of the distribution
Result:
Mean = 0
SD = 1
Normal Distribution = Standardized
What is “Normalization”
Main idea:
Normalizing a set of data is to transform values to lie between 0 and 100 (%)
For each value, subtract the min, divide by the range (max - min), then multiply by 100
Standard Error
Value that quantifies how precisely you’ve estimated the population mean
SE = s / SQRT(n)
Assumptions for Caclulating Confidence Intervals
Random or Representative Sample
Independent Observations
Accurate Data
Popu. is Gaussian or approximately so
Four things that determine the Confidence Interval of the mean
Sample mean
Unbiased estimate; center of CI
SD
Width of CI is proportional to s
Sample size
Width of CI is proportional to 1/n
Degree of Confidence
>Confidence = wider CI )80 vs 95%
Student’s t-distribution and how does it arise
A symmetric, bell shaped distribution but with “heavier tails” than Gaussian. Made to accommodate small sample sizes
Arises when estimating the mean of a normally distributed population by sampling from it
Distribution varies depending on sample size
Distribution converges into Gaussian as sample size increases
Central Limit Theorem
States that even if a population is not Gaussian, the sampling distribution of a statistic from it, will be normal, or nearly normal, provided the sample size is large enough
So, distributions of statistics tend to be more Gaussian than the distribution observations from which they are calculated.
Despite what we may believe, biological data are rarely normal. What do you do to accomodate for that
Proceed like normal and assume robustness
Data transformation
Non-Parametric Tests
Resampling/Bootstrapping methods
What is a p-value
Formally, it is the probability of seeing something that is ≥ than what we observe IF the null hypothesis is TRUE. If that probability is small enough (i.e. <0.05), then we accept that there potentially IS a pattern.
The p-value tells you how surprising your data would be if the null hypothesis were correct.
A small p-value = your data are very surprising under H₀ → maybe H₀ isn’t true.
A large p-value = your data are not surprising under H₀ → no reason to doubt it.
What are the three things that we intuitively understand to be Important to a patterns strenght
The raw size of the apparent effect
How different are the two means
The amount of noise in the data
↑ = bad
The amount of data we have
↑ = good
What is the MAIN thing we are assuming when obtaining a p-value
The main thing we are assuming is that there is NO PATTERN being observed
Whether there is one or not will depend on the probability we obtain and whether that shows surprising results under the context of no pattern being observed
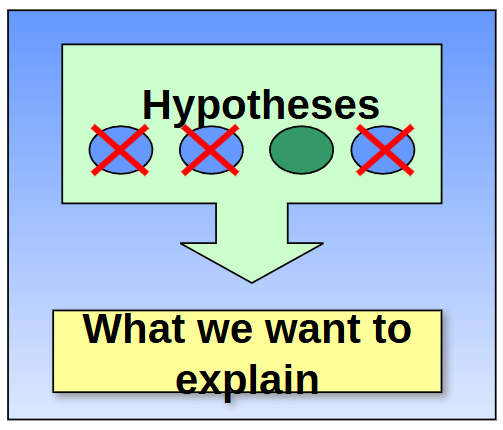
In research, why do we focus on H0 so much
Simply because it helps us go through hypothesis through hypothesis until we get the one that matches the closest.
Think of it like process of elimination
Why do we say: “We reject our null” or “fail to reject our null” and not “We accept our H1”
You can never prove that a hypothesis is true (may be different factors not observed at play).
But…you can prove that a hypothesis is false (only need one antagonistic proof to your hypothesis)
So, prove that the hypothesis of opposite interest is false (i.e. falsify the statisical null hypothesis)
Syllogism
Logical reasoning based on a premise leading to a logical conclusion
Sophism
Fallacious reasoning that might sound OK but is fundamentally wrong
Frequentists Approach; Focus on P-value
Pr(data | H0 )
Calculates the probability of the data, given that H0 is true
Bayesian Approach; Focus on p-value
Calculates the probability of a hypothesis given the data
P(H0 | data) =
[ P(H0) * P(data | H0) ] / P(data)
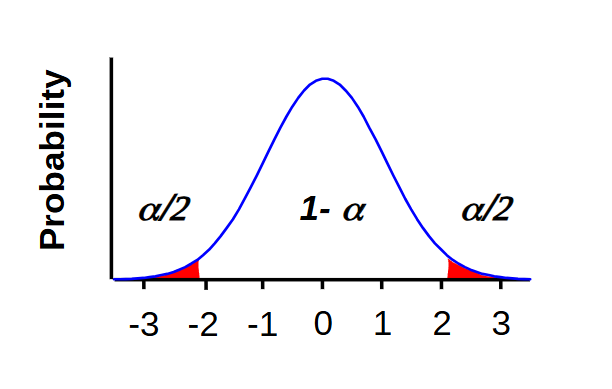
What is a 2-tailed hypothesis
A two-tailed (or non-directional) hypothesis test checks for a difference in both directions — whether the sample mean is either greater than or less than the population mean.
So, there are two rejection regions of size α/2 each
ex. testing to see if students keep a 75% average after a class change (results could either be higher or lower)
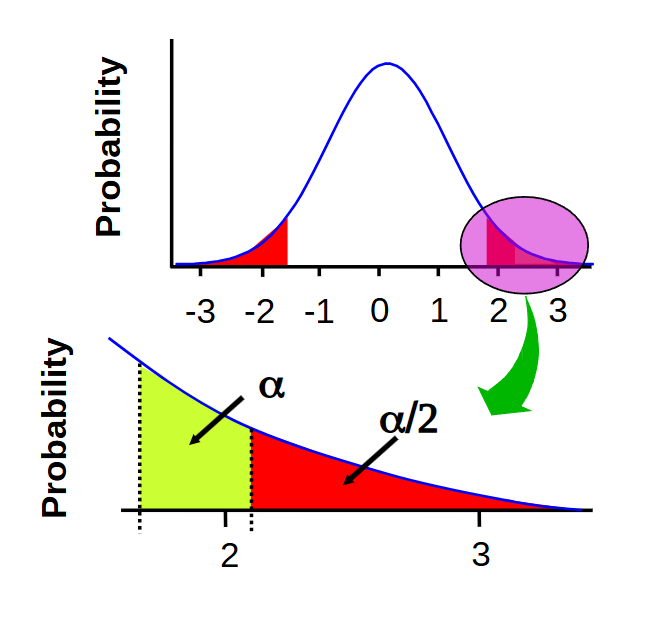
What is a 1-tailed hypothesis
A one-tailed (or directional) hypothesis test checks for a difference in only one direction — whether the sample mean is either greater than or less than the population mean; but ONE WAY.
So, there is one rejection region of size α
Instead of asking “is it different”, you’re asking is it “greater than” OR “less than”
ex. Use of a new chemical that increases plant growth (hypothesis). H0 = no growth, H1 = growth
its either no change, or yes change. So one-tailed
What are the fundamental differences between a one-tailed and two-tailed t-test
A one tailed t-test is much more powerful and significant than a two tailed t-test.
However, it should only be used if a difference in the other directions is as uninteresting as no difference AND you decide to use this t-test before priori
Why should you chose between a 1-tailed or a 2-tailed before an experiment.
To avoid cheating. You’re determining your “bad guy” before the tests.
ex. Similar reasons as why you must decide whether the short or long straw loses before you actually draw straws.
When performing an experiment, lets say that the entire confidence interval contains differences that you consider to be biologically important…
What conclusion do you make
You can make a strong positive conclusion
When performing an experiment, lets say that the confidence interval is wide enough to include values you consider to be clinically or biologically unimportant…
What conclusion do you make and what might be the reason
You can conclude that the study is inconclusive and that power may have been lacking
When performing an experiment, lets say that the confidence interval contains only values that you deem clinically/biologically unimportant
What conclusion do you make
You conclude that you can make a strong inference as to the absence of an effect (despite statistical significance)
What is P-hacking
P-hacking is the behavior of trying to find ways to make a p-value significant…CHEATING
How can we detect P-hacking
You can consider the frequency distribution of P-values for a set of studies.
If it occurs, the distribution curves will rise just below p=0.05, representing the accumulation of studies for the true p-value was actually >0.05
What are the two kinds of errors you can encounter in biostats
Type I error rates - α
False positives
Type II error - ß
False Negatives
Type I Erros, describe
α - False positives
If α = 0.05, there is a 5% chance of rejecting H0 when it is true
Type II Error, describe and comment on power
ß - False Negatives
It is the probability of NOT rejecting H0 given that H0 is false
So, 1 - ß is the power of the study.
Pr(rejecting H0|H0 is false)
If you have a high power, you have a small ß error rate
What is power, describe, explain, and infer what happens when you have powerful vs weak tests
Power is the probability of rejecting the null hypothesis when it is false and a specified alternate hypothesis is true, i.e. 1-ß
Power can only be calculated for a specific alternate hypothesis. And the probability of ß and (1-ß) depend on on the alternative hypothesis
Powerful tests can detect small and large differences
Weak tests can only detect large differences
Can be expressed as a proportion or as a %
What is the use of a raw effect size
Helps interpret the biological effect of the results
What is the use of a standardized effect size
Helps put our results and the effect size through nice statistical models and analyses
What are the factors that determine power
Type 1 error rate
Increasing one will decrease the other
Sample size
Scaled Effect size (δ)
This then depends on raw effect size and the amount of sampling variation
Describe a Type 1 power analysis and its use
Type 1 is model that focuses on the power as a function of α, δ, and N
Used AFTER data collection
Mainly helps find thepower for a given α, δ, and N.
Is not significant when testing the power of an effect size you’ve already determined biologically unsignificant, as that would mean power could be low
Describe a Type 2 power analysis and its use
Type 2 is model that focuses on the N as a function of α, δ, and power
Used BEFORE data collection
Used before because with a given α, δ, and power, we can calculate the minimum sample size needed to achieve the desired specifications.
Used to plan studies, but you need to know the sampling variation beforehand
Describe a Type 3 power analysis and its use
Type 3 is model that focuses on the δ(raw effect size) as a function of α, N, and power
Used in verifying sensitivity
Is used because you can find δ given a α, N, and power.
If δmin is large, you may potentially reject your H0
Useful in planning stage of studies
What are the “take home messages” of Power
If sample sizes are small, the power of any test is usually low
If power is very high, rejection of the null is very likely, even if deviations from null expectations are small
Always consider biological significance
Describe the False Recovery Rate, and give its formula when compared to α
Refers to the probability that IF a test is significant, what is the probability that the null hypothesis is really true?
It is also the expected proportion of false positives among a set of significant results.
The prior probability [ P(H) ] influences the false discovery rate, so important to find that
FDR = α / (α + [True Negatives] )
Describe regression of a model
Gives quantitative summary that describes the relation ship (equation)
Predicts values of the dependent variable from values of the independent variable. Hence there is a distinction between dependent and independent variables
Describe Correlation in a model
Focuses on the strength of the association of X & Y (linear relationship)
Measures as “r” and lies between -1 and 1; is unbiased
What is r2 (R2)
It is the Coefficient of determination, which measures the proportion of the variance in X1 “explained” by variation in X2 (vice versa)
Regressions Vs Correlation, describe the relationship and which one is “better” (why)
Both describes relationships between two interval or ratio variables
In most cases, you will want to perform a regression on your model.
Because the nature of your data will not allow inference about the correlation
because regression provides a more complete description of your data
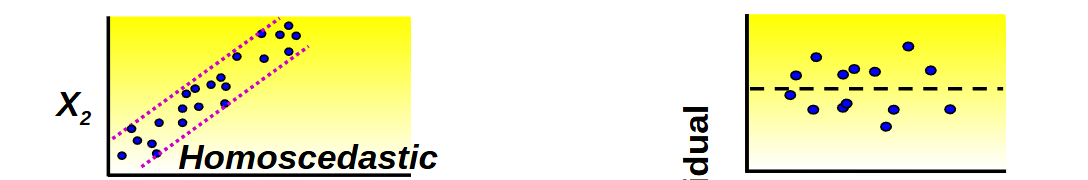
What does homoscedasticity mean
When the variance of X and Y are independent (equivalently the variance in residuals is equal for all X)