Demography
1/49
There's no tags or description
Looks like no tags are added yet.
Name | Mastery | Learn | Test | Matching | Spaced | Call with Kai |
|---|
No analytics yet
Send a link to your students to track their progress
50 Terms
Population Ecology
Study of what factors affect the number of individuals
of a species in a location & over time
Population
a group of interacting individuals of a single species in a single location
influenced by biotic & abiotic factors
population descriptions
Dispersion
Size & Density
Demographics
Population Dispersion
describes the pattern of individuals in space
Random, uniform, clumped
Random dispersion
position is not impacted by other individuals
(unpredictable)
Uniform dispersion
even spacing reinforced by interactions with others
-Chemical inhibition
-Territoriality
Clumped dispersion
individuals cluster in space
-Resource distribution
-Social groups
-Reproductive behavior
population size
total number of individuals in a population across all areas
population size equation
density x area
population density
number of individuals in a defined area
varies across the distribution if organisms are not uniformly dispersed
Measuring Population techniques
Full Census
Estimations:
-Census (sample plots)
-Mark Recapture
-Population Genetics
Full Census
a count of every individual in a population
not usually feasible
Sample Plots
Aka ecological census or quadrats
study area is divided into subunits to count individuals
-Count every individual in randomly selected areas (average population density)
estimates the density extrapolate to get the population size
Most effective for evenly spaced or sedentary organism
Mark-Recapture
Individuals in an area are captured, marked, and recapture
Population size is estimated by the proportion of marked animals in recapture sampling event
estimates the population size extrapolate to get the density
Mark-Recapture assumptions
marked & unmarked individuals have equal probability of sampling
no birth, death, immigration, emigration during resampling
Population mixes thoroughly between sample
Mark recapture equation
marked(M)/population(N) = recaps(r)/new captures(n)
N=Mn/r
Mark recapture errors
Over & under-estimation occurs if assumptions are violated
If animals avoid second capture: population size inflated
If animals prefer recapture: population size underestimated
Measuring Populations: DNA
Individuals can be identified from genetic sequence
DNA samples can be used to build genetic profiles of each
individual in a population — like forensics for wildlife
can be useful if animals are hard to capture or identify as individual or to determine which individuals are reproducing
Genetic profiling
DNA fingerprints are used to identify individual
Demography
The study of populations & how they change over time
Demography descriptions
Age & Sex structure, Survivorship, Life History(reproduction)
Age structure
distribution of individuals at different ages in a population
sex structure
the ratio of males to females in a population
Age & Sex Structure
"Snapshot" of a population in time
Relative proportions of ages & sex ratios in population
impact population stability and growth
Age structure can be used to predict how likely a population is to grow or shrink
Age sex structure diagram types
Rapidly Expanding - Many young, very few old
Steadily Expanding - Many young, few old
Slowly Expanding or Stationary - Many young, many middle aged
Contracting - Few young, many middle aged
Sex ratio effect
Growth may be constrained w/ skewed sex ratio
Sex-ratio skews impact reproduction & population growth
Female biased ratios typically increase birth rates, male-biased decrease...
strong skews in either sex decrease mating opportunities & increase inbreeding
Survivorship
A cohort (age group) is tracked through time from birth to death
Life tables
summarize mortality, survival, & reproduction in a population by age-group
survivorship curve
summarize life table data: deaths over time
static or time-specific life table
records the number of individuals of each age in a
population at a single time point
survivorship downsides
It can be difficult (or impossible) to follow all of a cohort
throughout their lives
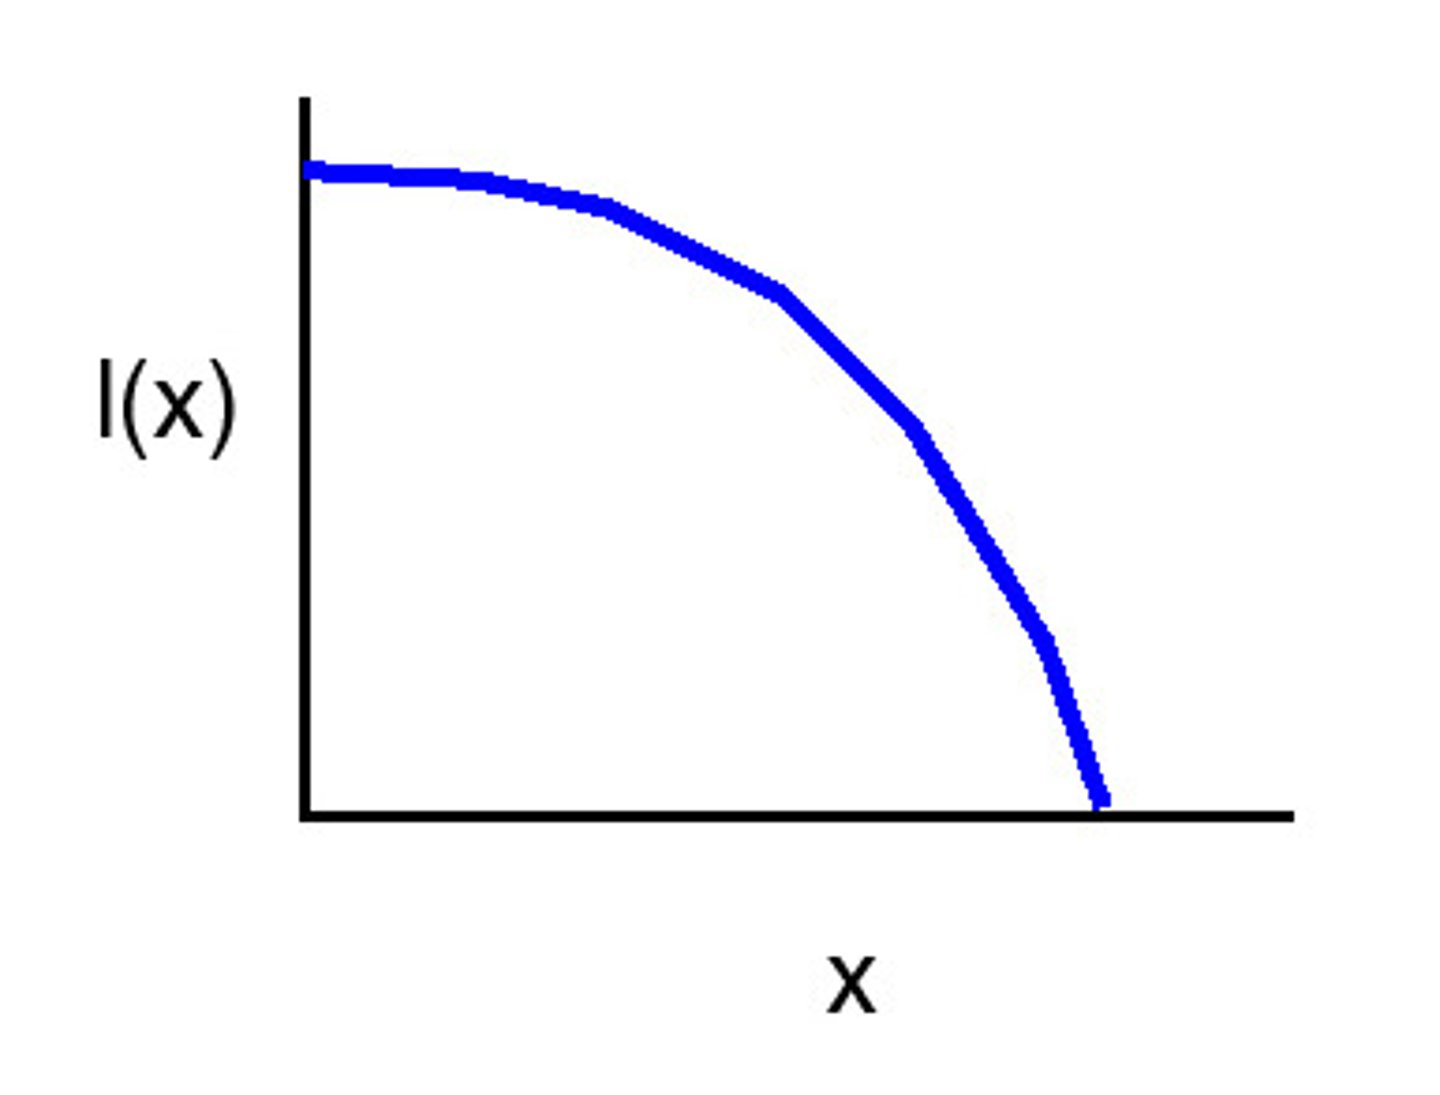
Type I survivorship curve
low death rates during early and middle life
steep increase in deaths in older age groups
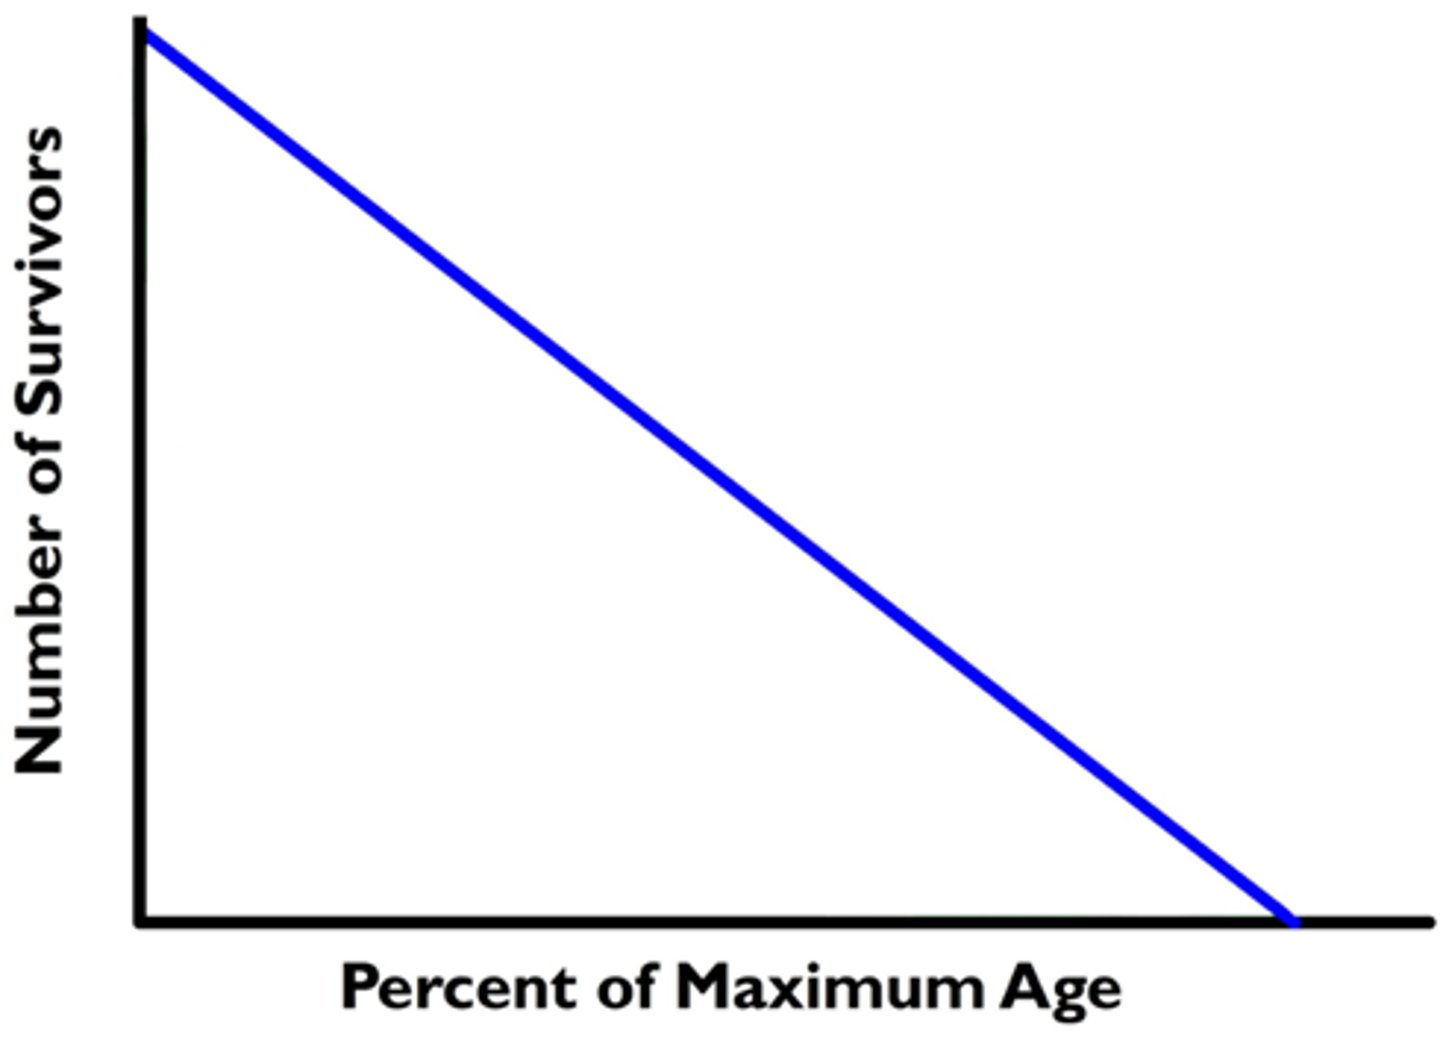
Type II survivorship curve
constant death rate over entire lifespan
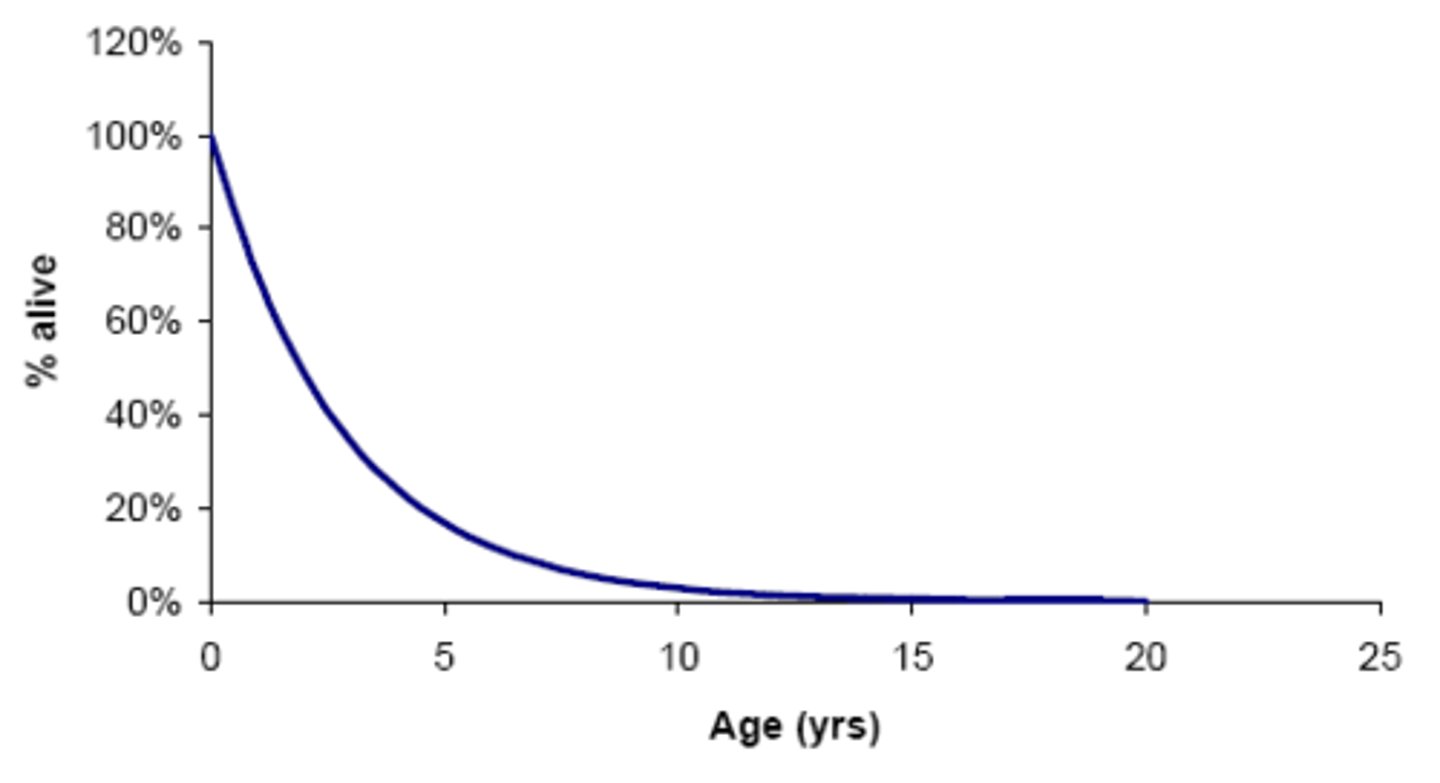
Type III survivorship curve
very high death rates for young
low death rates for those that survive early life
Type I Survival
High survival when young
Small number of offspring
High parental investment
Type II Survival
Equal survival across ages
Relatively few offspring
Low parental investment
Type III Survival
Low survival when young
Many offspring
Low parental care
Long-lived
Life History
Natural selection shapes traits related to reproduction & survival because resources are limited
-these traits describe a species' life history
Natural selection acts on current reproductive allocation &
future reproductive success
reflects balance between survival & reproduction over
lifetime of parent with different combinations of reproductive trait
Reproductive onset
when reproduction begins
Reproductive Frequency
how often to reproduce
Reproductive output
how many offspring each time
fecundity
an organism's reproductive capacity
determined by tradeoffs
Reproductive onset tradeoffs
Reproduction is risky
Early reproduction:
-lowers risk of dying w/out producing offspring...
-at expense of growth & health of parent + offspring
Later reproduction:
-produces more or larger offspring that are more likely to survive...
-risk of not surviving to reproduce at all!
Reproductive Frequency tradeoffs
Reproduction is energetically costly! Frequency reflects resource availability & cost to parents
semelparous species
reproduce only once in a lifetime
Many short-lived:
-might not have a 2nd chance in ephemeral or disturbed
habitats
Some long-lived:
-wait for the right conditions then devote all resources to reproductive success
iteroparous species
reproduce multiple times
balance investment in each reproductive event
Reproductive Output tradeoffs
Offspring take time & energy
Tradeoff in number offspring produced & offspring investment
Low chance of offspring survival?
-Make more offspring & wish them luck
Good chance of survival?
-Make less offspring & help them survive
r/K selection theory
Parental investment balances conflicting demands for time, energy, nutrients in habitats that vary in stability
K-selected organisms
invest more in few offspring, each has a high chance of survival
Maintain high reproductive rate at high population density
Competitive species with stable populations
Live near carrying capacity in predictable environments
Tend to be slow developing, long-lived, & large-bodied
r-selected organisms
produce many offspring each with a low chance of survival
Maximum reproductive success in low density
Populations are below carrying capacity—little competition
Common in unpredictable, disturbed, unstable environments
Tend to be short-lived, rapidly developing & small-bodied