College Biology - Ecology Unit
1/97
Earn XP
Description and Tags
Test 1
Name | Mastery | Learn | Test | Matching | Spaced | Call with Kai |
|---|
No analytics yet
Send a link to your students to track their progress
98 Terms
Inference
Logical explanation using observations.
Observation
Something you use your senses to notice.
Independent Variable
What you change or control in an experiment to see if it affects something else (cause)
Dependent Variable
What you measure in an experiment or study to see if it changes in response to something else (effect)
Null Hypothesis
When there is no result in the experiment (things are often equal)
Population
The number of people living in a specific place
Population Density
A simple measure of how many people live in a specific area
Population Density Formula
Population Density = Total Population / Total Land Area²
Growth Rate (R)
Growth Rate = Birth rate - Death rate
Logisitic Growth
Population stabilizes at a certain level (aka “K”)
Carrying Capacity (K)
Number of individuals in a population that an area can support
Exponential Growth
When a population grows faster over time because the number of new individuals added in each step is proportional to the current total
K-Selected Species
Do not seek out new environments
Population is relatively around “K”
Care for their offspring
Density dependent (as the population increases, limiting factors bring the population back down)
R-Selected Species
Opportunist species
Populations react to variations in environment
Produce many offspring fast
Do not provide care for young
Density independent (population density does not affect the population)
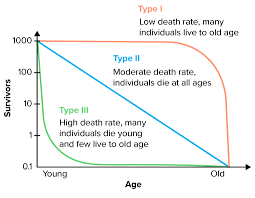
Survivorship Curves
A graph that plots the number or proportion of individuals surviving in a population at each age
Survivorship Curves [X-Axis]
Relative Age (young, middle, old)
Survivorship Curves [Y-Axis]
Number of survivors
Three Types of Surviorship Curves
Type 1: K-Species
Type 2: Linear Line
Type 3: R-Species
Communites
All the interacting populations of different species living and interacting in a particular area or habitat
Ecological Dominant
Species that are most abundant in certain ecosystems (there are the most of them)
Keystone Species
Species that may not be numerous but whose absence has a significant impact on the ecosystem.
Biodiversity
Range of species in a community
OR…
Diversity of species in a given area
Biodiversity Index
Biodiversity Index = # of different species / total # of organisms
Biodiversity Index (Transect Method)
Estimates the variety of species in an area by sampling along a straight line
[Example: (2/3 + 4/6 + 1/5) / 3]
Habitat
Physical surroundings of a species
Niche
An organism’s role in its enviroment
Interspecific Competition
Between two or more different species
Intraspecific Competition
Between members of the same species
Competitive Exclusion Principal
No two species can share the same vital resource for long periods of time
Resource Partitioning
Species divide up scare resources
AND…
Species adapt and specialize
Symbiosis (has 4 types)
Two species live close together and at least one benefits
Symbiosis 1: Predator / Prey
One organism feeds on another (+, -)
Predators are dependent on prey
Symbiosis 2: Parasite / Host
Parasite feeds on or lives in the host (+, -) or (+, 0)
Symbiosis 3: Mutualism
Interaction between individuals of two species that is beneficial to both (+, +)
Symbiosis 4: Commensalism
Interaction between two species in which one benefits while the other is neither harmed nor helped (+, 0)
Productivity
The rate at which living matter (biomass) is created by an ecosystem
Mimicry
One species evolved to assume the appearance of another
Example of Mimicry
Batesian vs. Mullerian
Primary Succession
Starting point is little to no life
Soils lacks nutrients
Begins with the arrival of a pioneer species
Secondary Succession
The final state of a habitat has been disturbed
Life remains and the soil has nutrients
Pioneer Species
The first organism to settle in a brand new or disturbed habitat
Lichen
A complex life form that is a symbiotic partnership of two separate organisms, a fungus and an alga (A = food, F= home) & (+, +)
Climax Community
The stable community at the end of a succession
Aquatic Succession
A body of water gradually fills in with sediment and organic material, transforming into land-based ecosystem like a forest over a long period
Eutrophication
The gradual increase in the concentration of phosphorus, nitrogen, and other plant nutrients. Algae begins to bloom, and bacteria breaks it down using dissolved oxygen in the water. This eventually suffocates fish.
Capture / Mark / Recapture
Wildlife estimation method where you capture a sample of animals, mark them with a tag or paint, and then release them back into the population (Later on, you’d catch them again)
Estimated Population Formula
P/M = p/m
Estimated Population Variables Meaning
P = estimated population
M = marked Day 1
p = number caught Day 2
m = marked Day 2
Estimated Population Example
x/6 = 5/3
Bd (Batrachochytrium dendrobatidis)
A deadly aquatic fungus that infects frogs and other amphibians
How to Find “Q” in WQI (Water Quality Index)
Look at lab number, and follow table / chart
How to Find “T” in WQI (Water Quality Index)
Weighting Factor x “Q”
Ecosystem
Fundamental Unit of Ecology
Abiotic Factors
Non-Living Things
Abiotic Factors Examples
Sunlight
Percipitation
Temperature
Soil
Biotic Factors
Living things
Biotic Factors Examples
Plants
Animals
Density Independent
Population density does not affect the population
Density Dependent
As the population increases, limiting factors bring the population back down
Carbon Cycle
Carbon has been transferred from a fixed state, stored in fossil fuels, to the atmosphere.
Plants and animals release CO² through cellular respiration
Plants take in CO² and store it in their tissues
Assimilation
The process where organisms convert inorganic carbon, mainly atmospheric carbon dioxide, into organic compounds which are used for energy and structure
Nitrogen Cycle
Describes how nitrogen moves between the atmosphere, soil, and living things
Nitrogen Cycle Steps
Nitrogen from the atmosphere is absorbed into a plant (N2)
Nitrogen Fixing Bacteria
Ammonia (NH3)
Nitrification (NO3)
Dentrification
Nitrogen Fixing Bacteria
Stored in some plants’ roots (ex: Legume)
Ammonia (NH3)
When plants and animals die, decomposers (fungi and bacteria) break down their organic matter
Nitrification (NO3)
Turns into nitrogen usable by plants
Dentrification
Other bacteria convert nitrates back into nitrogen gas, which is then released into the atmosphere, starting the cycle anew.
Water Cycle
The water cycle is the continuous movement of water on Earth
Water Cycle Steps
Evaporation
Condensation
Percipitation
Collection
Transpiraton
Evaporation
Water turns into vapor and rises
Condensation
Vapor cools and forms clouds
Precipitation
Water falls from clouds as either rain or snow
Collection
Two options:
Runoff - Water flows into rivers, lakes, and oceans
Seepage - Goes into ground
Can turn into “uptake” or “ground water”
Transpiration
Plants release water vapor from their leaves
Abiotic Parameter (from WQI lab): Turbipity
How cloudy the water is - we want low numbers
Abiotic Parameter (from WQI lab): Change in Temperature {often expressed with a triangle}
Measurement in change of temp. in two different areas - want as close together as possible
Abiotic Parameter (from WQI lab): pH
How acidic or basic the water is - want close to 7
Abiotic Parameter (from WQI lab): Nitrates
Measure of nitrogen in water (can indicate fertalizer run-off) - want low levels
Abiotic Parameter (from WQI lab): Phosphates
Measure of phosphates in water (causes extra algae growth) - want low levels
Abiotic Parameter (from WQI lab): Dissolved Oxygen
The oxygen available for living things to breath - want high numbers
Abiotic Parameter (from WQI lab): Conductivity
Amount of salts [how water can conduct electricity] - want low levels
Important Abiotic Parameters (from WQI lab) Ranked
Dissolved Oxygen (0.17)
pH (0.11)
Nitrates and Phosphates (0.10)
Turbidity (0.08)
Change in Temp. and Conductivity (0.07)
Producer
Organisms that make their own food (plants)
Consumer
Cannot produce food - must eat other plants / animals for energy
Herbivore
Eat only plants
Omnivore
Eat plants and meat
Carnivore
Eat only meat
Decomposer
Organism that breaks food down into inorganic compounds
Trophic Levels
Food Levels - has 5
Food Chain
Energy travels upwards
Quaternary Consumer
Tertiary Consumer
Secondary Consumer
Primary Consumer
Primary Producer
Food Web
All the food chains in a single ecosystem.
Energy Flow
Energy is not recycled like natural substances
Transferred and released as heat
10% Rule
Only 10% of energy moves up in the food chain
Gross Primary Production
The amount of material that a plant produces from photosynthesis
Net Primary Production
The amount of material a plant actually accumulates from photosynthesis
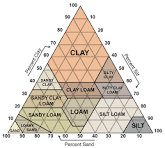
Soil Pyramid - How to Draw Lines
Clay - Straight Across
Sand - Upwards Diagonal
Silt - Downwards Diagonal
Soil Calculations Example
(Variable in cm {a, b, or c} / Total cm) x 100 = % of soil, silt, or clay
Simpson Biodiversity - what does n and N stand for
n - # of each organism
N - total # of all organisms