Unit 9: Testing a Claim
0.0(0)
0.0(0)
Card Sorting
1/10
There's no tags or description
Looks like no tags are added yet.
Study Analytics
Name | Mastery | Learn | Test | Matching | Spaced | Call with Kai |
|---|
No study sessions yet.
11 Terms
1
New cards
p-value
Probability, computed assuming Hₒ is true, the statistic would take a value as extreme as or more extreme than the one actually observed.
2
New cards
interpreting p-values
small p-value (p
3
New cards
Conclusion when p
Because p
4
New cards
Conclusion when p>α
Because p>α, we fail to reject the null hypothesis.
At the \[__α]__% level of significance, there is not enough evidence to support the claim that __[alternative/claim]__.
At the \[__α]__% level of significance, there is not enough evidence to support the claim that __[alternative/claim]__.
5
New cards
Null and Alternative Hypothesis
Null: rejected or not
Alternative: supported or not
Alternative: supported or not
6
New cards
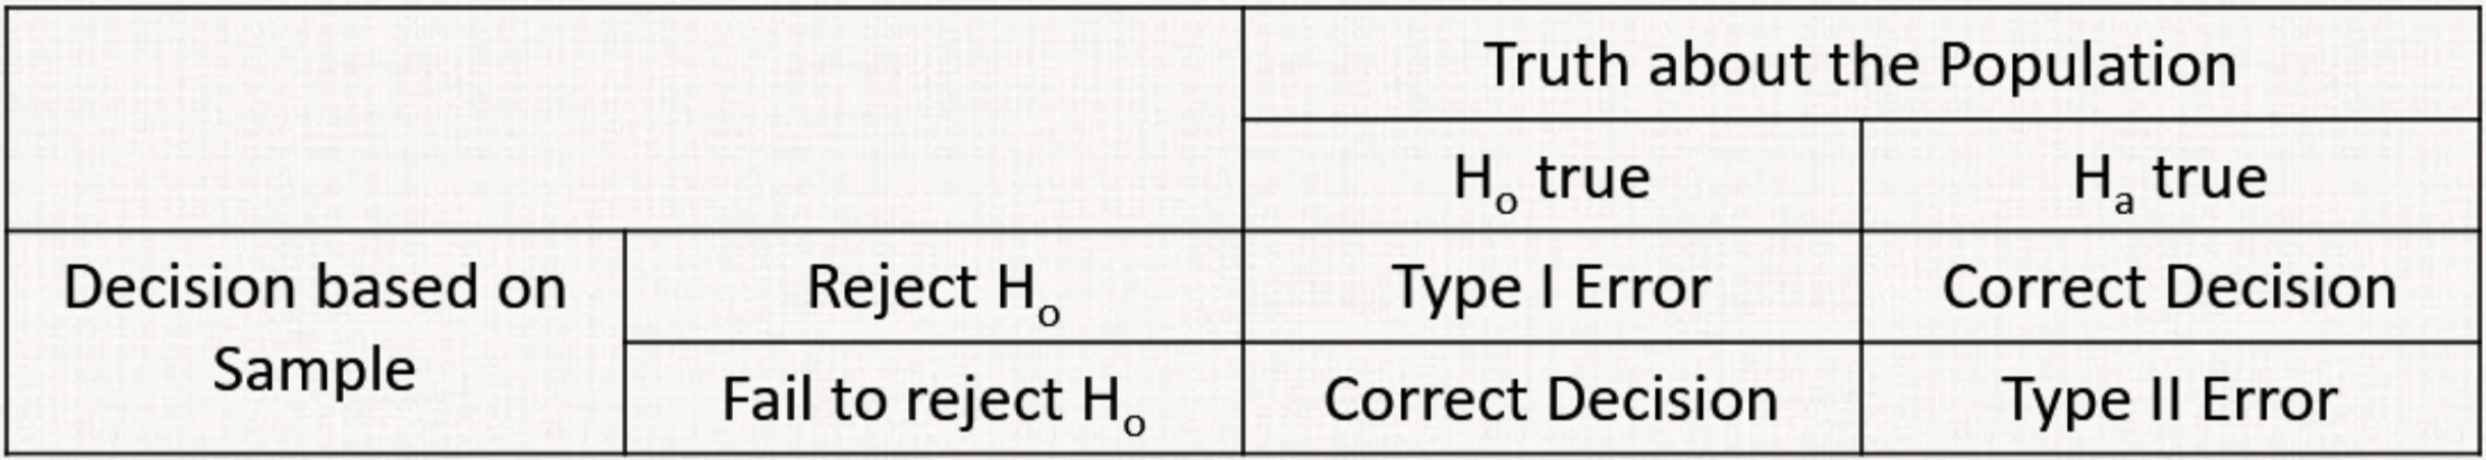
Type I and Type II Errors
Type I: You reject the null, but what if it was true?
* p(type I) = α
Type II: You fail to reject the null, but what if it was false?
* p(type II) = 1-power
* p(type I) = α
Type II: You fail to reject the null, but what if it was false?
* p(type II) = 1-power
7
New cards
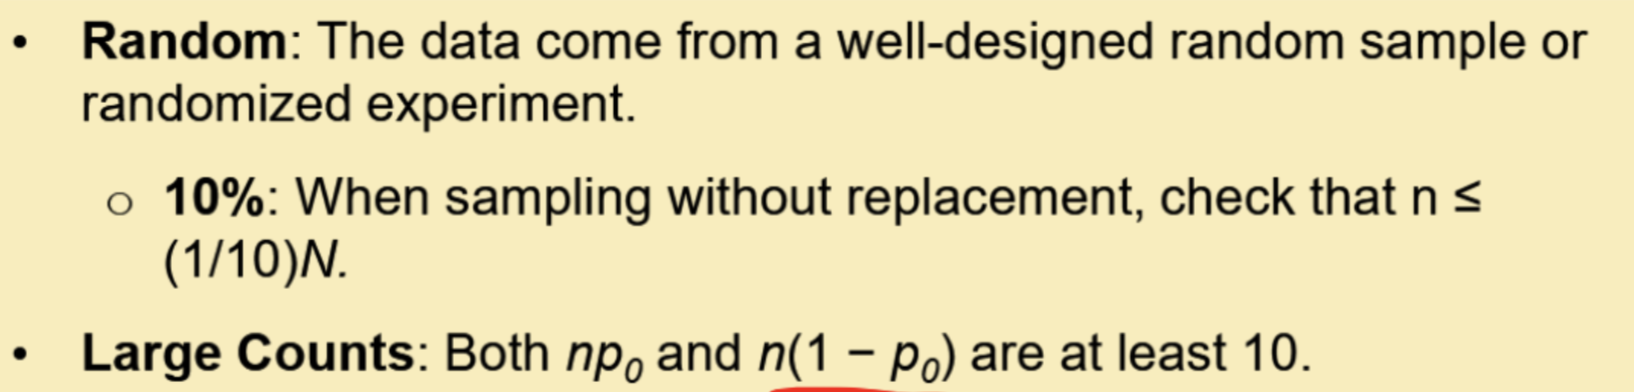
Conditions for significance test about a proportion
(p is from null hypothesis, not p̂ )
8
New cards
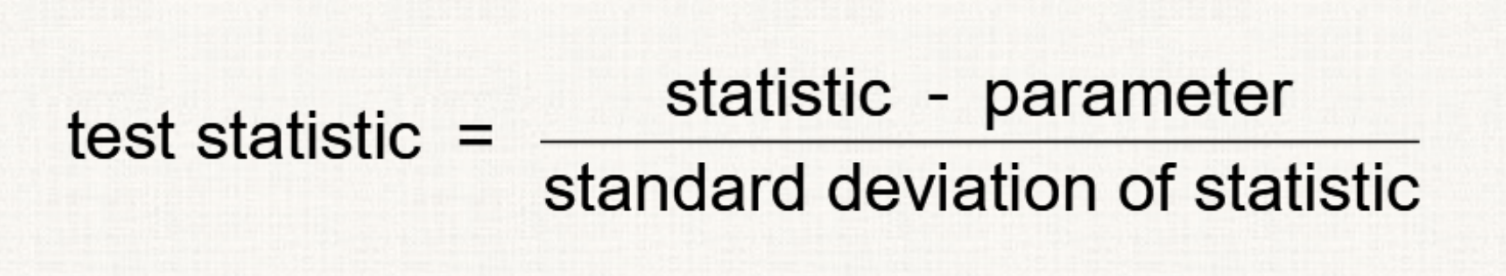
Test statistic for proportions
z score
9
New cards
power
The probability that the test will reject Hₒ at a chosen significance level α when the specified alternative value of the parameter is true.
* higher power is desirable
Ways to increase power:
* increase α
* consider an alternative farther away from the original p
* increase the sample size
* decrease σ (by improving measurement process or restricting attention to a subpopulation)
* higher power is desirable
Ways to increase power:
* increase α
* consider an alternative farther away from the original p
* increase the sample size
* decrease σ (by improving measurement process or restricting attention to a subpopulation)
10
New cards
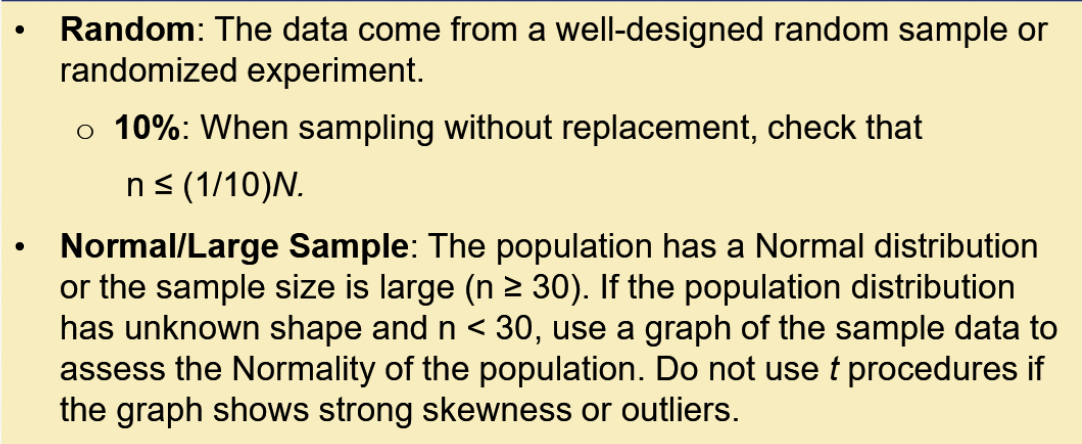
Conditions for significance test about a mean
10% not necessary if we aren’t sampling
normal/large sample:
1. is the population distribution normal?
2. is n >= 30?
3. is there any strong skewness or outliers? (sketch a graph)
normal/large sample:
1. is the population distribution normal?
2. is n >= 30?
3. is there any strong skewness or outliers? (sketch a graph)
11
New cards
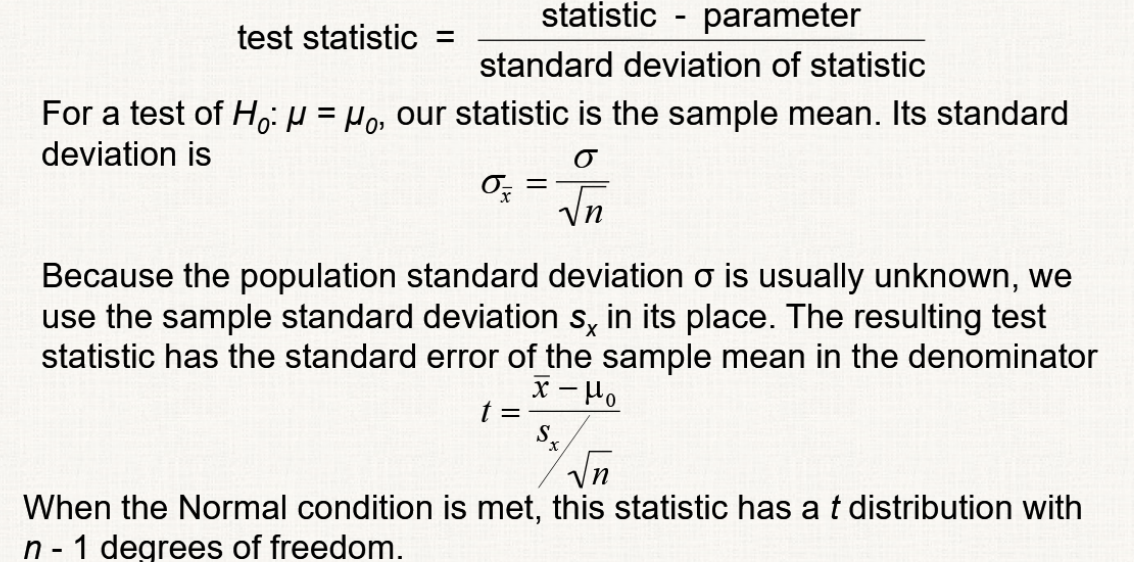
test statistic for means