psyc2063 quiz 2
1/23
Earn XP
Description and Tags
lectures 5-8, tutorials 6-8
Name | Mastery | Learn | Test | Matching | Spaced |
|---|
No study sessions yet.
24 Terms
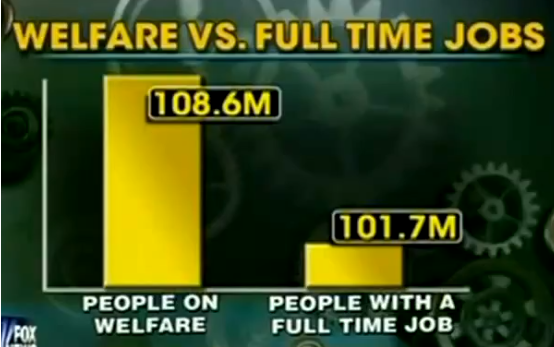
what is the main issue with this graph and how do you figure that out
unfair comparison because you don’t have all the information you need
'people on welfare' includes kids and stuff who live in households where someone receives welfare
'people with a full time job' is ONLY the person with the full time job
why is it problematic to compare trump’s inauguration turnout to obama’s
• Less people were physically there but sooooo many more were watching online for trump than obama
In 2008, it wasn't rlly common to watch stuff online
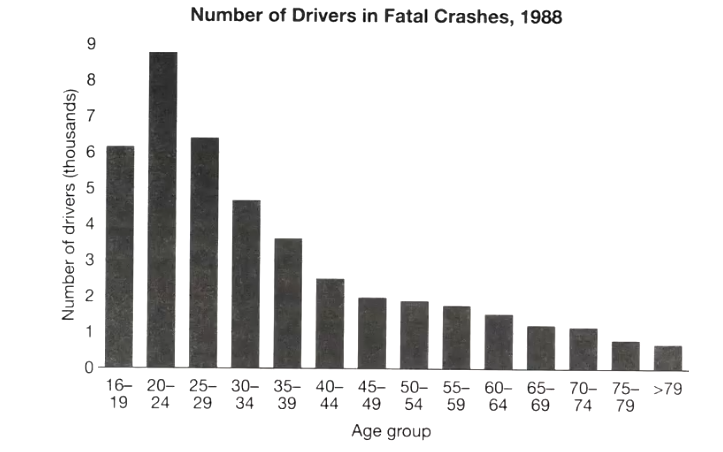
what is wrong with this graph
we don’t have all the information we need
This graph is comparing age groups BUT it is not taking into account the number of drivers in each category OR how much/how often they drive
how do changing definitions affect comparisons
- As our awareness/understanding of concepts/problems changes over time, the way we categorise these also changes
These means it can be hard to compare stuff like prevalence bc the defintion of what 'counts' may have changed
changing definitions ←→ changing thresholds
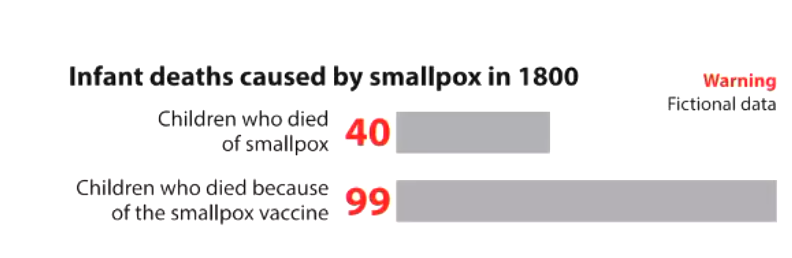
what’s wrong with this graph
• This is an unfair comparison
• The number of unvaccinated kids is A LOT smaller than those who did. The sample sizes are different so the percentages shown are done with massively different sample sizes
• The data is also being compared in the context of us living in a world WITH a widespread vaccination program
○ What we should be looking at is the number of children who die for ANY reason when you introduce vaccinations vs when you don't.
what is wrong with a headline which says "over 2000 DACA recipients accused of felonies!!"
you’re not given important information you need to be able to compare this number.
how many NON-DACA recipients are accused of felonies?
We know that 6.4% of americans commit felonies so .3% is actually so fine but this is not represented in the headline
percentage points vs percentage change
- Percentage points represent actual differences in the numbers we're referring to when we use the percentages
- So going for 30% to 45% is not necessarily an increase of 15% but 15 percentage points
- To talk about % increase you need to ask how much is the percentage point change relative to the original percentage?
what are some common biases in reporting norms?
men are often seen as the default and women are seen as deviating from the norm
- When studies find gender differences, differences are more likely to be attributed to women/girls then men/boys
- In sexual orientation, differences attributed to LGBT than white
- In race, differences attributed to black not white
mercator projection
Fosters ethnic bias towards european imperialism
- Mercator projection distort relative sizes of nations/continents
• Unconsciously equate size with power. Mercator projection makes european good
• Size of countries massively expanded in northern hemisphere (typically western countries)
reasons for correlations
• Reverse causation
• Confounding variable
• Mediators
Moderators
probabilistic cause
When A increases the chances of B e.g. smoking increases chance of lung cancer
sufficient cause
when A always leads to B e.g. smoking always leads to lung cancer
necessary cause
when ONLY A leads to B. e.g. the only way to get lung cancer is smoking
alternative explanations for decreasing birth rates under China’s one child policy
decreasing fertility rates
Vietnam also showed similar pattern despite no one-child policy
spurious correlations
- Meaningless correlations e.g. divorce rate in Maine and consumption of margarine
- If you measure enough variables you will end up with some correlation literally just by chance