ECO105 Micro Midterm
1/139
There's no tags or description
Looks like no tags are added yet.
Name | Mastery | Learn | Test | Matching | Spaced | Call with Kai |
|---|
No study sessions yet.
140 Terms
Scarcity
arises because of limited money, time, and energy.
Economics
how individuals, businesses, and governments make the best possible choices to get what they want, and how those choices interact in markets.
Opportunity cost
the cost of the best alternative given up.
Incentives
rewards and penalties for choices.
For a smart choice…
the value of what you get must be greater than value of what you give up.
Production possibilities frontier (PPF)
graph showing the maximum combinations of products or services that can be produced with existing inputs.
Absolute advantage
the ability to produce a product or service at a lower absolute cost than another producer.
Comparative advantage
the ability to produce a product or service at a lower opportunity cost than another producer.
Economic model
a simplified representation of the real world, focusing attention on what’s important for understanding.
The circular flow model of economic life
reduces the complexity of the Canadian economy to three sets of players who interact in markets—households, businesses, and governments.
In input markets
households are sellers and businesses are buyers.
In output markets
households are buyers and businesses are sellers.
Governments
set rules of the game and can choose to interact in any aspect of the economy.
Inputs
are the productive resources—labour, natural resources, capital equipment, and entrepreneurial ability—used to produce products and services.
Positive statements
about what is; can be evaluated as true or false by checking the facts.
Normative statements
about what you believe should be; involve value judgments and cannot be factually checked.
Microeconomics
analyzes choices that individuals in households, individual businesses, and governments make, and how those choices interact in markets.
Macroeconomics
analyzes performance of the whole Canadian economy and global economy; the combined outcomes of all individual microeconomic choices.
Three keys model
summarizes the core of microeconomics, providing the basis for smart choices in all areas of your life.
Key 1
Choose only when additional benefits are greater than additional opportunity costs.
Key 2
Count only additional benefits and additional opportunity costs.
Key 3
Be sure to count all additional benefits and costs, including implicit costs and externalities.
Marginal
additional
Marginal benefits
additional benefits from the next choice.
Marginal opportunity costs
additional opportunity costs from the next choice.
Implicit costs
opportunity costs of investing your own money or time.
Negative (or positive) externalities
costs (or benefits) that affect others external to a choice or a trade.
Preferences
your wants and their intensities
Demand
consumers’ willingness and ability to pay for a particular product or service.
For any choice, what you are willing to pay or give up depends on…
the cost and availability of substitutes.
Marginal benefit
the additional benefit from a choice, changing with circumstances.
Diamond/water paradox
Marginal benefit explains the diamond/water paradox. Why do diamonds cost more than water, when water is more valuable for survival? Willingness to pay depends on marginal benefit, not total benefit. Because water is abundant, marginal benefit is low. Because diamonds are scarce, marginal benefit is high.
Quantity demanded
the amount you actually plan to buy at a given price.
Market demand
sum of demands of all individuals willing and able to buy a particular product or service.
Law of demand
if the price of a product or service rises, quantity demanded decreases, other things remaining the same.
Demand curve
shows the relationship between price and quantity demanded, other things remaining the same.
Demand
catch-all term summarizing all possible influences on consumers’ willingness and ability to pay for a particular product or service.
Increase in demand
increase in consumers’ willingness and ability to pay. Rightward shift of demand curve.
Decrease in demand
decrease in consumers’ willingness and ability to pay. Leftward shift of demand curve.
Demand changes with…
changes in preferences, prices of related goods, income, expected future price, and number of consumers.
Substitute
products or services used in place of each other to satisfy the same want.
Complement
products or services used together to satisfy the same want.
Normal goods
products or services you buy more of when your income increases.
Inferior goods
products or services you buy less of when your income increases.
Marginal cost
additional opportunity cost of increasing quantity supplied, changing with circumstances. For the working example, you are supplying time, and the marginal cost of your time increases as you increase the quantity of hours supplied.
Differences between smart supply choices and smart demand choices:
For supply, marginal cost increases as you supply more.
For demand, marginal benefit decreases as you buy more.
For supply, marginal benefit is measured in $ (wages you earn); marginal cost is the opportunity cost of time.
For demand, marginal benefit is the satisfaction you get; marginal cost is measured in $ (the price you pay).
Sunk costs
past expenses that cannot be recovered. Sunk costs are the same no matter which fork in the road you take, so they have no influence on smart choices.
Supply
businesses’ willingness to produce a particular product or service because price covers all opportunity costs.
Quantity supplied
quantity you actually plan to supply at a given price.
Marginal opportunity cost
complete term for any cost relevant to a smart decision. All opportunity costs are marginal costs; all marginal costs are opportunity costs.
Increasing marginal opportunity costs arise because…
inputs are not equally productive in all activities. Where inputs are equally productive in all activities, marginal opportunity costs are constant.
Market supply
sum of supplies of all businesses willing to produce a particular product or service.
Law of supply
if the price of a product or service rises, quantity supplied increases.
Supply curve
shows the relationship between price and quantity supplied, other things remaining the same.
Two ways to read a supply curve
As a supply curve, read over-and-down from price to quantity supplied.
As a marginal cost curve, read up-and-over from quantity supplied to price. A marginal cost curve shows the minimum price businesses will accept that covers all marginal opportunity costs of production.
Supply
catch-all term summarizing all possible influences on businesses’ willingness to produce a particular product or service.
Supply changes with…
changes in technology, prices of related products or services produced, prices of inputs, expected future prices, number of businesses, or environment.
Increase in supply
increase in businesses’ willingness to supply. Can be described in two ways:
At any unchanged price, businesses are now willing to supply a greater quantity.
For producing any unchanged quantity, businesses are now willing to accept a lower price.
Decrease in supply
decrease in businesses’ willingness to supply.
Market
the interactions between buyers and sellers.
Because any purchase or sale is voluntary…
an exchange between a buyer and seller happens only when both sides end up better off.
Property rights
legally enforceable guarantees of ownership of physical, financial, and intellectual property.
Prices are the outcome of…
a market process of competing bids (from buyers) and offers (from sellers).
When the market price turns out to be too low:
shortage, or excess demand—quantity demanded exceeds quantity supplied.
shortages create pressure for prices to rise.
rising prices provide signals and incentives for businesses to increase quantity supplied and for consumers to decrease quantity demanded, eliminating the shortage.
When the market price turns out to be too high:
surplus, or excess supply—quantity supplied exceeds quantity demanded.
surpluses create pressure for prices to fall.
falling prices provide signals and incentives for businesses to decrease quantity supplied and for consumers to increase quantity demanded, eliminating the surplus.
Shortage/excess demand
quantity demanded exceeds quantity supplied.
Surplus/excess supply
quantity supplied exceeds quantity demanded.
Even when prices don’t change, shortages and surpluses also create incentives for…
frequent quantity adjustments to better coordinate smart choices of businesses and consumers.
The price that coordinates the smart choices of consumers and businesses has two names:
market-clearing price—the price that equalizes quantity demanded and quantity supplied.
equilibrium price—the price that balances forces of competition and cooperation, so that there is no tendency for change.
Price signals in markets…
create incentives, so that while each person acts only in their own self-interest, the result (coordinated through Adam Smith’s invisible hand of competition) is the miracle of continuous, ever-changing production of the products and services we want.
For a change in demand (changes in preferences, prices of related products, income, expected future prices, number of consumers)…
an increase in demand (rightward shift of demand curve) causes a rise in the equilibrium price, and an increase in quantity supplied.
a decrease in demand (leftward shift of demand curve) causes a fall in the equilibrium price, and a decrease in quantity supplied.
For a change in supply (changes in technology, environment, prices of inputs, prices of related products produced, expected future prices, number of businesses)…
an increase in supply (rightward shift of supply curve) causes a fall in the equilibrium price and an increase in quantity demanded.
a decrease in supply (leftward shift of supply curve) causes a rise in the equilibrium price and a decrease in quantity demanded.
Comparative statics
comparing two equilibrium outcomes to isolate the effect of changing one factor at a time.
When both demand and supply increase…
the equilibrium price may rise/fall/remain constant, and the equilibrium quantity increases.
When both demand and supply decrease…
the equilibrium price may rise/fall/remain constant, and the equilibrium quantity decreases.
When demand increases and supply decreases…
the equilibrium price rises and the equilibrium quantity may rise/fall/remain constant.
When demand decreases and supply increases…
the equilibrium price falls, and the equilibrium quantity may rise/fall/remain constant.
An efficient market outcome has…
the largest total surplus, prices just cover all opportunity costs of production and consumers’ marginal benefit equals businesses’ marginal cost.
Consumer surplus
the difference between the amount a consumer is willing and able to pay, and the price actually paid. The area under the marginal benefit curve but above the market price.
Producer surplus
the difference between the amount a producer is willing to accept, and the price actually received. The area below the market price but above the marginal cost curve.
Total surplus
consumer surplus plus producer surplus.
Deadweight loss
decrease in total surplus compared to an economically efficient outcome.
Efficient market outcome
coordinates smart choices of businesses and consumers so:
consumers buy only products and services where marginal benefit is greater than price.
product and services are produced at lowest cost, with prices just covering all opportunity costs of production.
at the quantity of an efficient market outcome, marginal benefit equals marginal cost (MB=MC).
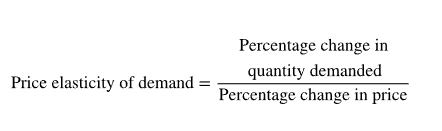
Elasticity (or price elasticity of demand)
measures how responsive quantity demanded is to a change in price.
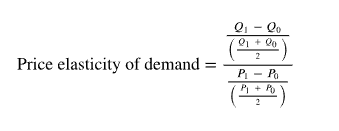
Elasticity of demand formula:
The midpoint formula between any two points on a demand curve like (Q0,P0) and (Q1,P1) is:
Inelastic demand
small response in quantity demanded when price rises.
Example: Demand for insulin by a person with diabetes.
Value for formula is less than one.
Low willingness to shop elsewhere.
Perfectly inelastic demand—price elasticity of demand equals zero; quantity demanded does not respond to a change in price.
Elastic demand
large response in quantity demanded when price rises.
Example: Demand for blue earbuds.
Value for formula is greater than one.
High willingness to shop elsewhere.
Perfectly elastic demand—price elasticity of demand equals infinity; quantity demanded has an infinite response to a change in price.
The price elasticity of demand of a product or service is influenced by:
available substitutes—more substitutes mean more elastic demand.
time to adjust—longer time to adjust means more elastic demand.
proportion of income spent—greater proportion of income spent on a product or service means more elastic demand.
Elasticity determines business pricing strategies to earn maximum total revenue:
cut prices when demand is elastic and raise prices when demand is inelastic.
Total revenue
all money a business receives from sales=price per unit(P)×quantity sold(Q).
For businesses facing elastic demand, price cuts are the smart choice and increase total revenue.
For businesses facing inelastic demand, price rises are the smart choice and increase total revenue.
As you move down a straight line demand curve, elasticity changes and is not the same as slope.
Elasticity goes from elastic, to unit elastic, to inelastic.
Total revenue increases, reaches a maximum when elasticity equals 1, and then decreases.
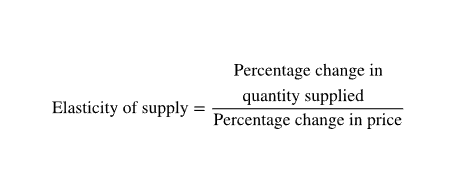
Elasticity of supply
measures by how much quantity supplied responds to a change in price.
Elasticity of supply formula:
The midpoint formula between any two points on a supply curve like (Q0,P0) and (Q1,P1) is similar to formula for price elasticity of demand.

Inelastic supply
small response in quantity supplied when price rises. Difficult and expensive to increase production.
Example: supply of mined gold.
Value for formula is less than 1.
Perfectly inelastic supply—price elasticity of supply equals zero; quantity supplied does not respond to a change in price.
Elastic supply
large response in quantity supplied when price rises. Easy and inexpensive to increase production.
Example: snow-shovelling services.
Value for formula is greater than 1.
Perfectly elastic supply—price elasticity of supply equals infinity; quantity supplied has infinite response to a change in price.
Elasticity of supply of a product or service is influenced by:
availability of additional inputs—more available inputs means more elastic supply.
time production takes—less time means more elastic supply.
Elasticity of supply allows for…
more accurate predictions of future outputs and prices, helping businesses avoid disappointing customers.
Cross elasticity of demand
measures the responsiveness of the demand for a product or service to a change in the price of a substitute or complement.