2.3.3 Long run aggregate supply (LRAS)
1/21
There's no tags or description
Looks like no tags are added yet.
Name | Mastery | Learn | Test | Matching | Spaced |
|---|
No study sessions yet.
22 Terms
Define LRAS
LRAS represents the maximum possible output (it is like a PPF).
It represents the maximum output when all factors of production are fully and efficiently employed
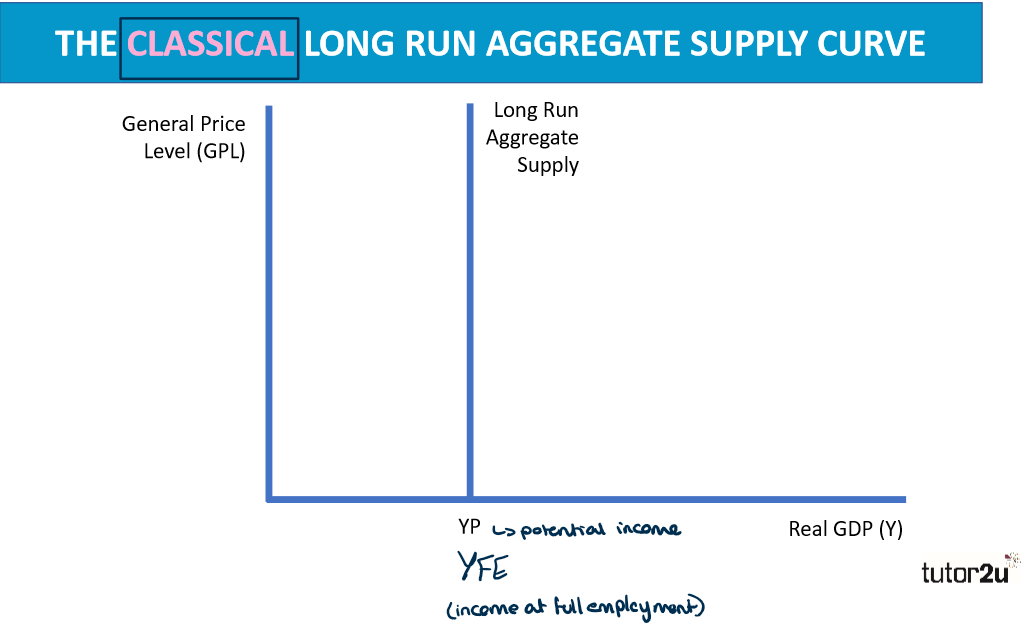
What does the classical long run aggregate supply curve look like?
YP is the estimated potential national output in the long run
What does an outwards shift in LRAS imply?
An outward shift in LRAS signifies:
an increase in potential output and employment
real economic growth
(an increase or improvement in factors of production
What is something important to notes about the classical LRAS curve?
There is no change in real output because the economy is working at its maximum already and is perfectly elastic - no more can be outputted
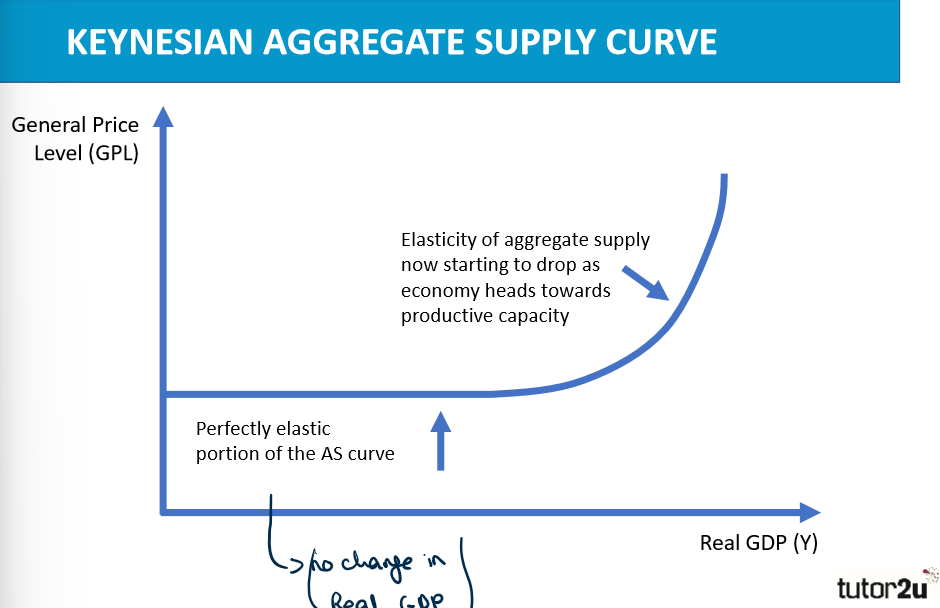
What is the Keynesian Aggregate Supply Curve?
It is non-linear where the elasticity of aggregate supply is dependent in part on the level of spare productive capacity at different stages of nation’s economic cycle.
What is productive capacity?
How much the economy can produce
What is spare capacity?
How much below full capacity the economy is working at
What does the Keynesian aggregate supply curve look like?
Recap - What does LRAS show?
The potential output when all resources are fully employed
Recap - when does LRAS shift right?
When an economy’s production capacity rises
Recap - when does LRAS shift left?
When the productive capacity falls or is constrained
How do technology advancement affect LRAS?
New technologies make labour & capital more productive → LRAS shifts right
UK 2025: Further £100m support for AI via the Alan Turning Institute & ongoing Ai sector strategy
Eval: Not as effective if adoption is slow or bureaucracy raises costs → rightwards shift is smaller
How do changes in relative productivity affect LRAS?
ONS (Office for national statistics) 2025: UK output per hour about 1-1.5% above 2019 levels → modest supply-side gain.
Sectors that become more productive than other pull up overall potential GDP → LRAS shifts right.
But if productivity growth stalls (UK’s long run issue), LRAS only slowly shifts
Productivity shocks in key sectors (e.g construction or health) can even reduce effective capacity)
How do changes in education and skill affect LRAS shifts?
Better education, apprenticeships and STEM skills raise labour quality → LRAS shifts right
UK policy focus: improving technical skills to support AI, green energy, and advanced manufacturing.
Skills mismatches (e.g NHS, social care, digital) limit potential output - slows/ rightward shift
Long lags: current training affects LRAS over many years
How do changes in government regulations affect LRAS shifts?
Smart, competition- friendly regulation can raise efficiency -LRAS shifts right
But heavier compliance, planning delays or stricter migration/ work rules can raise costs - LRAS shifts left
UK 2024-25: tighter rules on student dependant and some work visas lowered migration inflows - potential labour supply hit - LRAS shifts left
Regulatory certainty encourages investment; uncertainty discourages it.
How do demographic changes affect shifts in LRAS?
UK population still growing, but ageing - more retirees relative to workers.
ageing alone would slow labour-force growth -LRAS shifts left (or grows more slowly)
ONS 2025 projections; working-age population rising mainly because of migration, not births.
Policies that keep older workers in work (health, childcare, flexible work) can offset the drag.
How does migration affect shifts in LRAS?
Large, skilled inflows increase labour force and supply - LRAS shifts right
ONS provisional figures: net migration about 431, 000 in year to Dec2024 - down sharply from 2023 but still adding workers.
If new rules reduce work/ study migration further, LRAS grows more slowly than 2021-23.
Quality matters: high-skill migrants boost productivity more than low-skilled workers
How do competition policies affect shifts in LRAS?
Effective competition (SMA action on digital, mobile platforms, and mergers) improves efficiency - LRAS shifts right
Breaking up/ limiting market power encourages innovation and lower costs for consumers and firms.
But very heavy-handed intervention can deter investment - potential left shift
UK 2025: CMA focusing on digital markets, AI and consumer protection to keep markets contestable.
Give a summary of what affects shifts in LRAS. Including recent UK data trends
Rightward shift: Better tech, higher productivity (more skilled migrants), more/ better educated workers, pro-competition regulation, positive migration.
Leftward/ slower shift: ageing population, restrictive migration rules, burdensome regulations, weak productive growth (as a result of lowly skilled migrants).
Recent UK data (2024-25) show BOTH: tech/migration still positive, but tighter rules and ageing slow the pace.
Always link policy/ event - Factor of production - Potential output - LRAS shift
What are the 5 key factors which affect shifts in LRAS?
Productivity of labour and capital
Growing population & increased labour market participation
Innovation and enterprise
Capital investment
Stock of natural/ environmental resources
What are the differences in shifts in LRAS and SRAS?
SRAS curves shift following a change in costs - wage rates, cost of raw materials/ components, oil and energy prices, corporation tax or government subsidies.
LRAS curves shift following a change in the quality or quantity of resources - investment in capital, employment, training, technology advancements