EHL 3.3 - Macroeconomic objectives
1/153
There's no tags or description
Looks like no tags are added yet.
Name | Mastery | Learn | Test | Matching | Spaced |
|---|
No study sessions yet.
154 Terms
10.1 - Economic growth
Economic growth
An increase in total real output produced by an economy over a given time period, also considering increases in economic well-being.
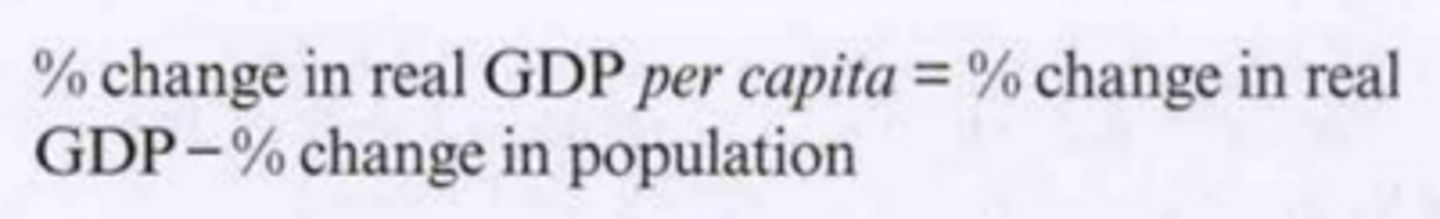
Why is economic growth per capita a better measurement of an increase in total output?
Measures increases in real output (GDP) corresponding to each person on average, eliminating differing population sizes and population growth.
Figure 10.1: Formula for economic growth
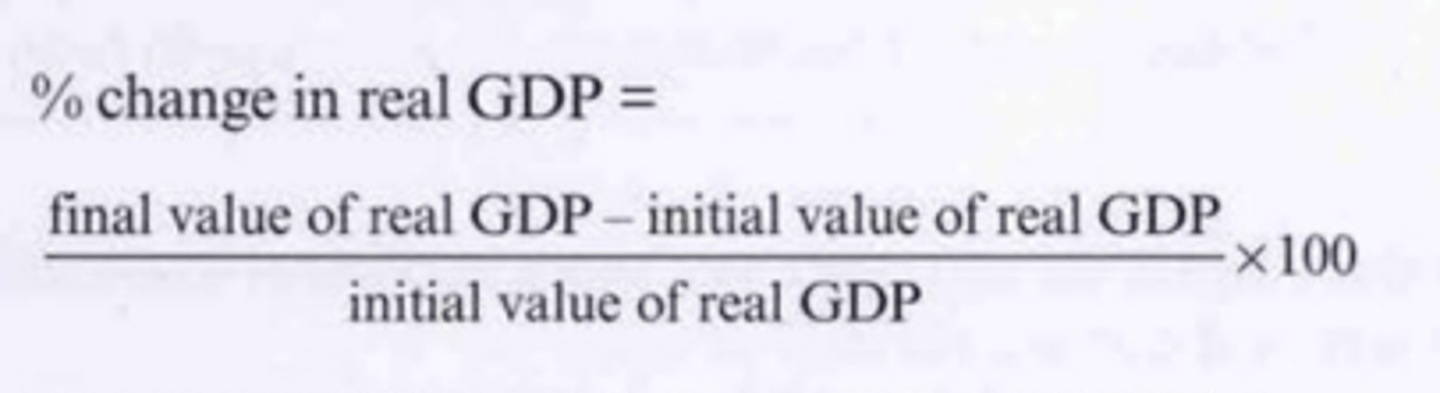
Describe how real GDP can be positive but real GDP per capita can be negative under the same circumstances
If the population is growing faster than real GDP, then the amount of GDP per person on average decreases and the growth rate of real GDP per capita is negative.
What is the significance of calculating economic growth?
Measures changes in a nation's productive capacity, such as living standards, while forming grounds for policymaking, which can be compared between countries.
Figure 10.2: Formula for change in real GDP per capita
Short-term growth
Growth of an economy over relatively short periods of time shown by movements closer to the PPC curve or by expansions in the business cycle.
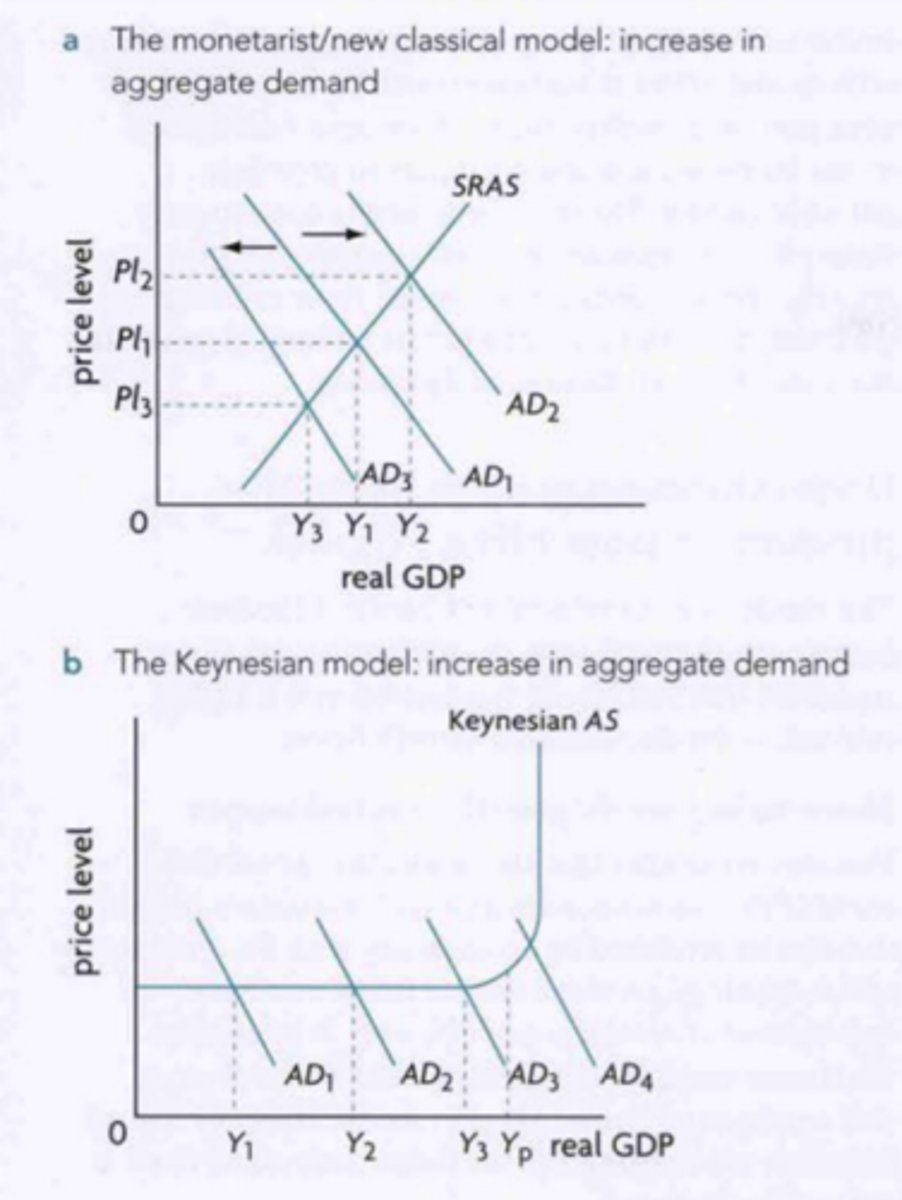
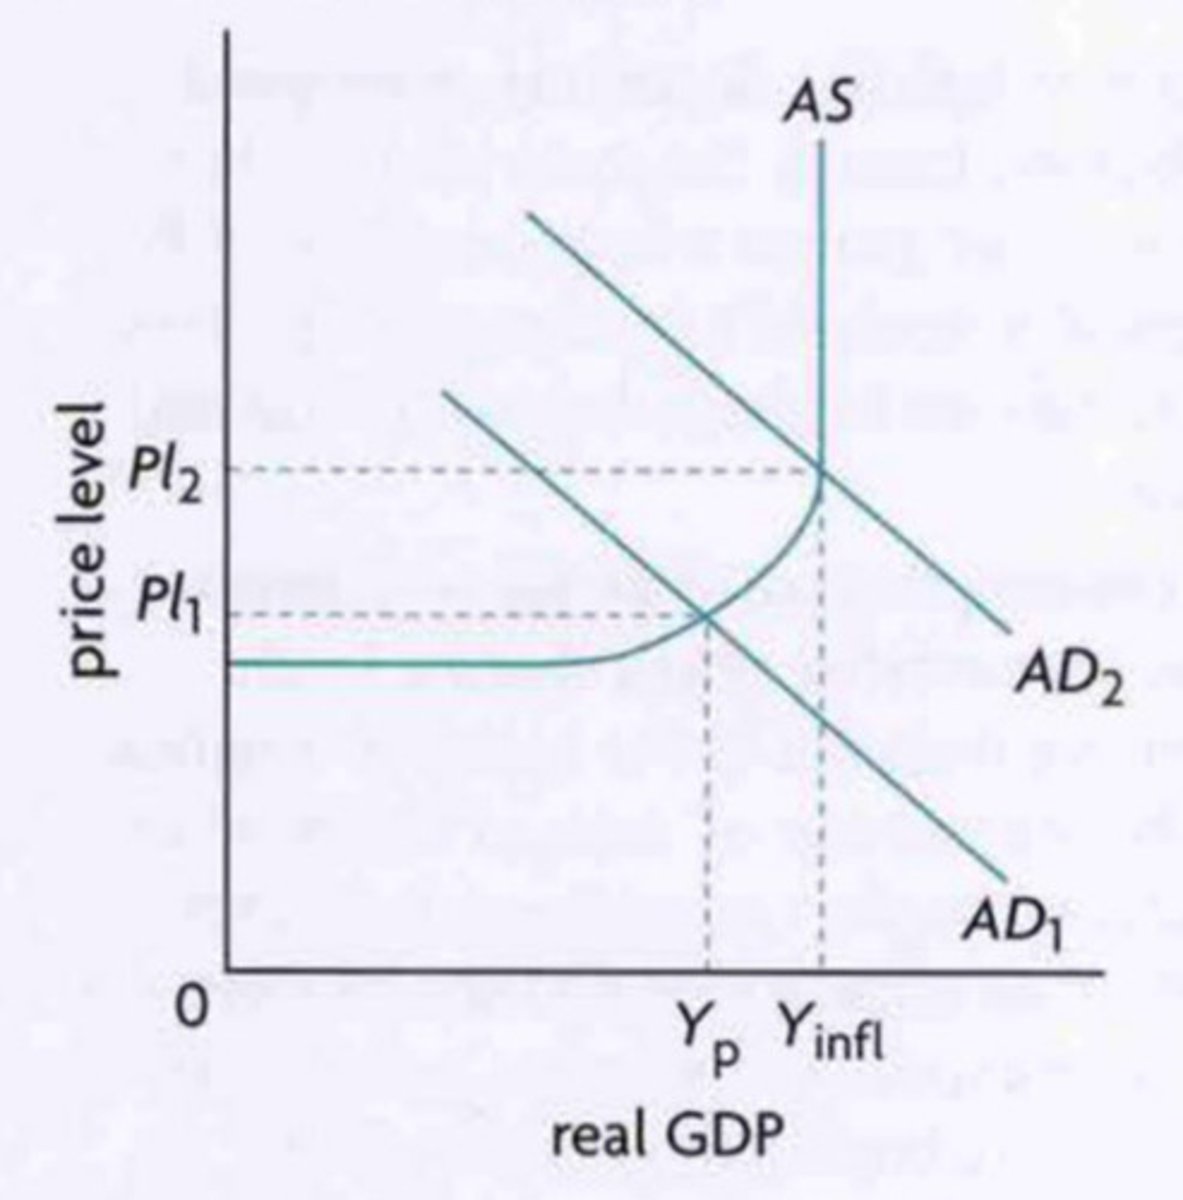
Describe short-term growth in terms of increases in AD
A rightward shift of AD in the AD-AS will result in a positive increase in real GDP with no increase in potential output.
Figure 10.3a/b: Shifts of AD in the monetarist/new classical model and Keynesian model to show short-term growth
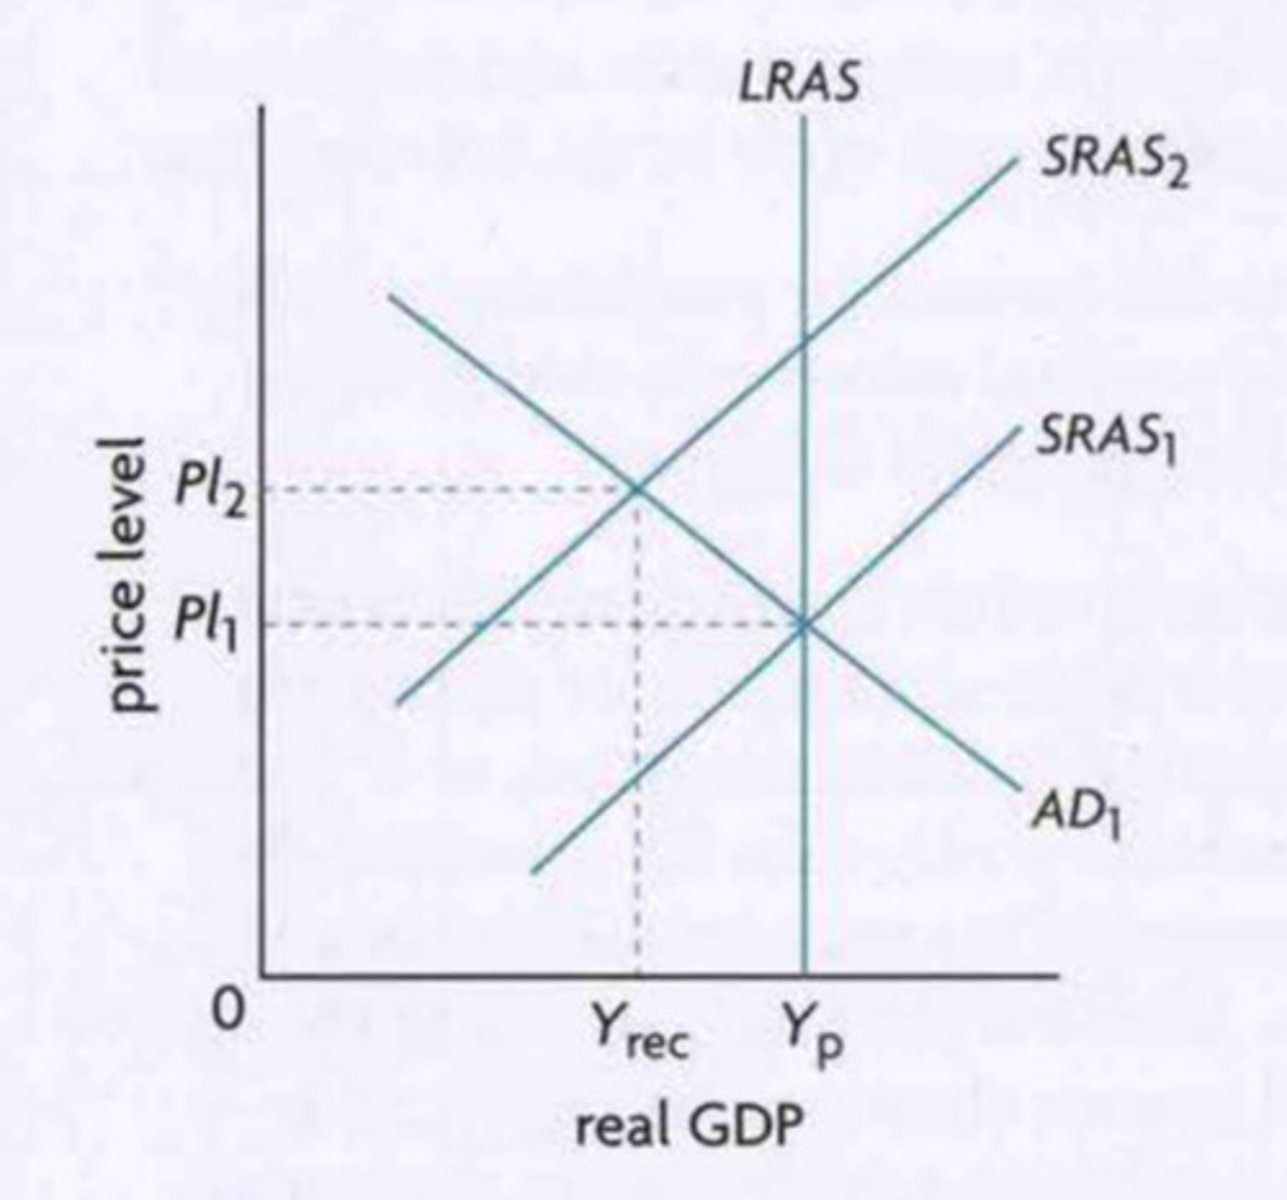
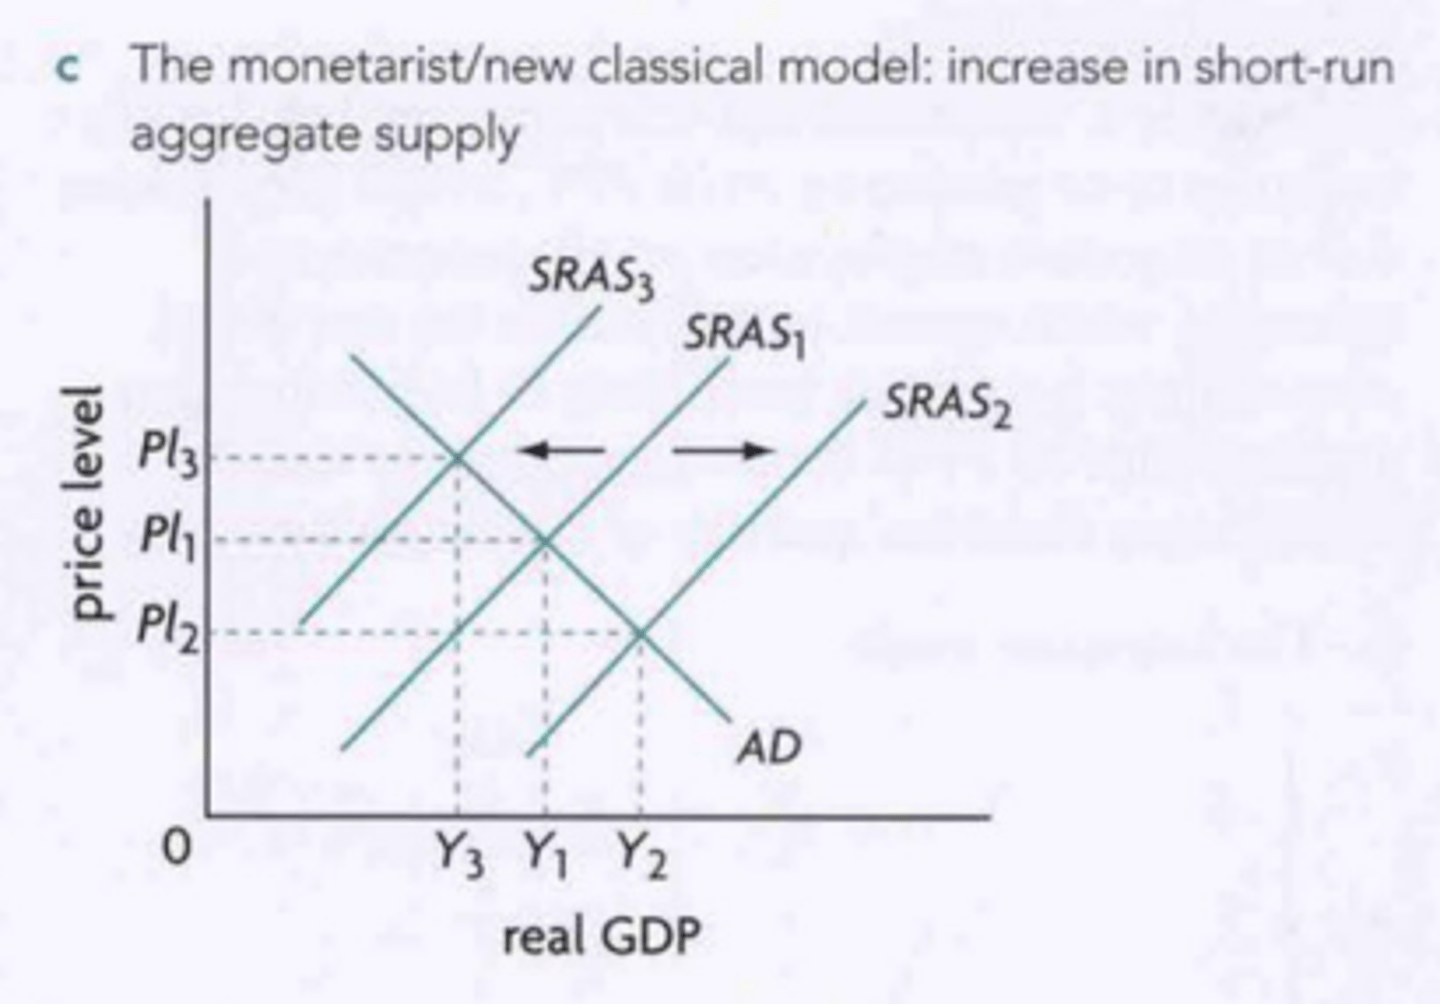
Describe short-term growth in terms of increases in SRAS
A rightward shift of SRAS in the AD-AS will result in a positive increase in real GDP with no increase in potential output.
Figure 10.3c: Shifts of SRAS in AD-AS model to show short-term growth
Production possibility curve (PPC)
A graph to show all possible combinations of the maximum amounts of two goods that can be produced by an economy given scarce resources at full employment.
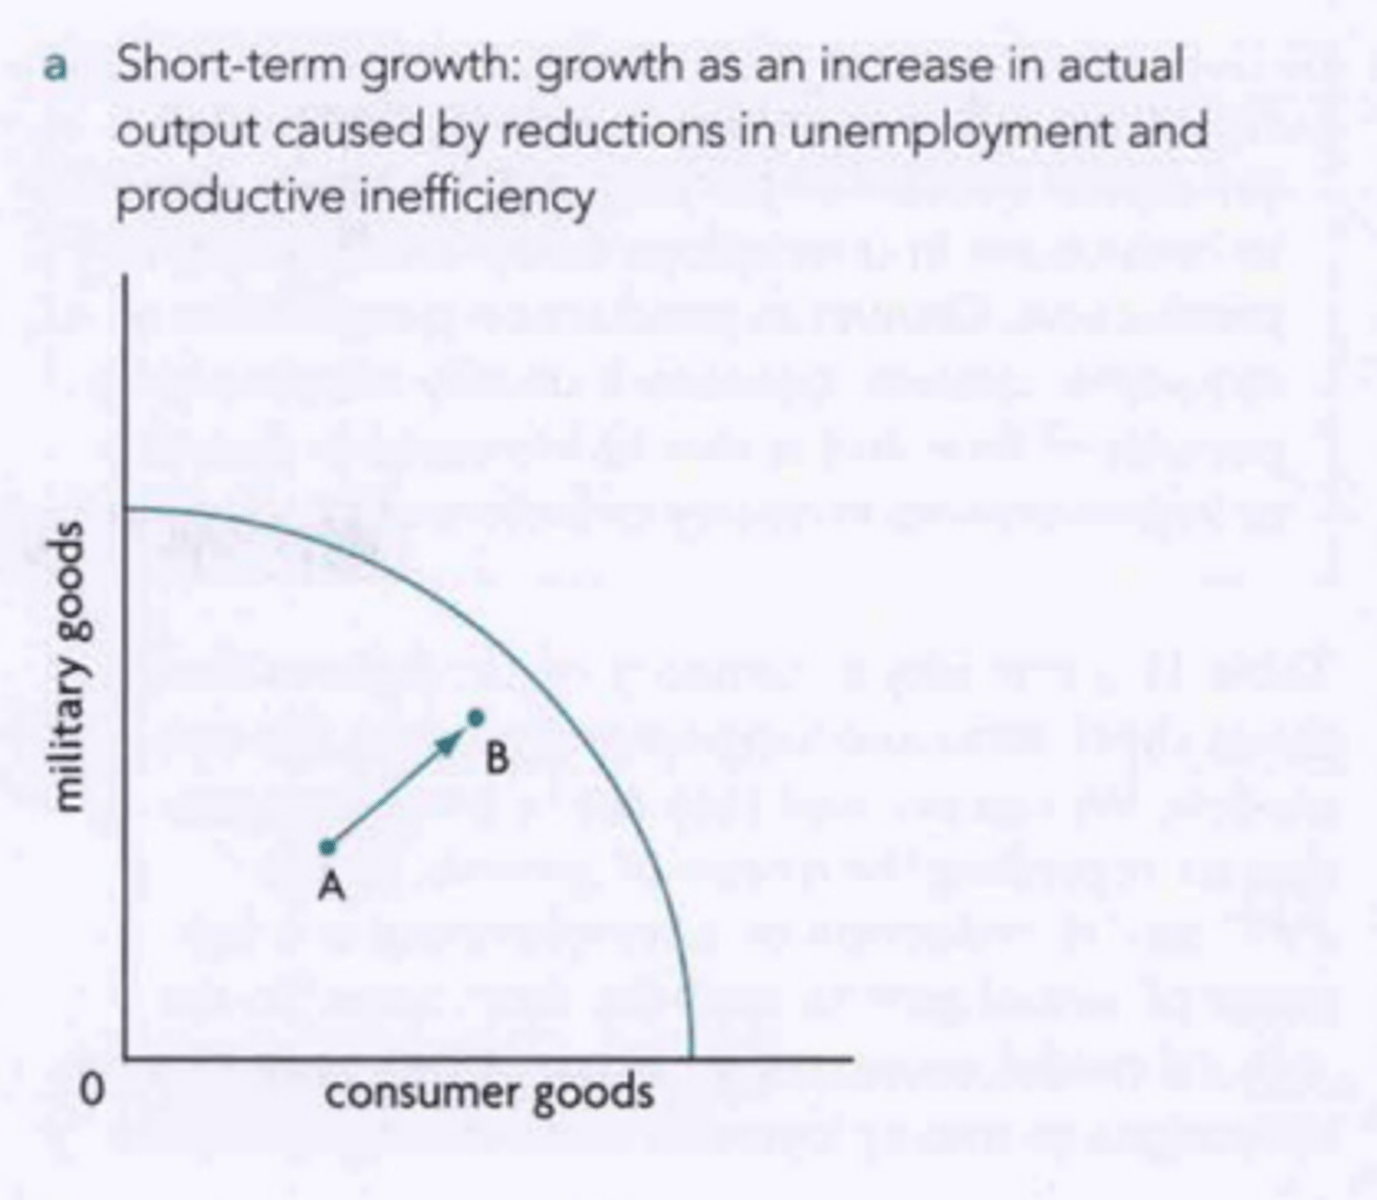
Actual output (PPC)
economy operates below full employment but moves towards potential level out output by using its resources more effectively, shown by movement of point onto PPC
Describe why actual output (PPC) is short-term
It can occur and change over short periods of time and is due to reductions in unemployment or inefficiency in production.
Describe short-term growth in terms of PPCs
A movement of actual output below the PPC closer towards the PPC curve will result in an increased utilisation of labour or resources, producing a higher actual output (real GDP) with no increase in potential output.
Figure 10.3d: Movements of actual output within the PPC curve to indicate short-term growth
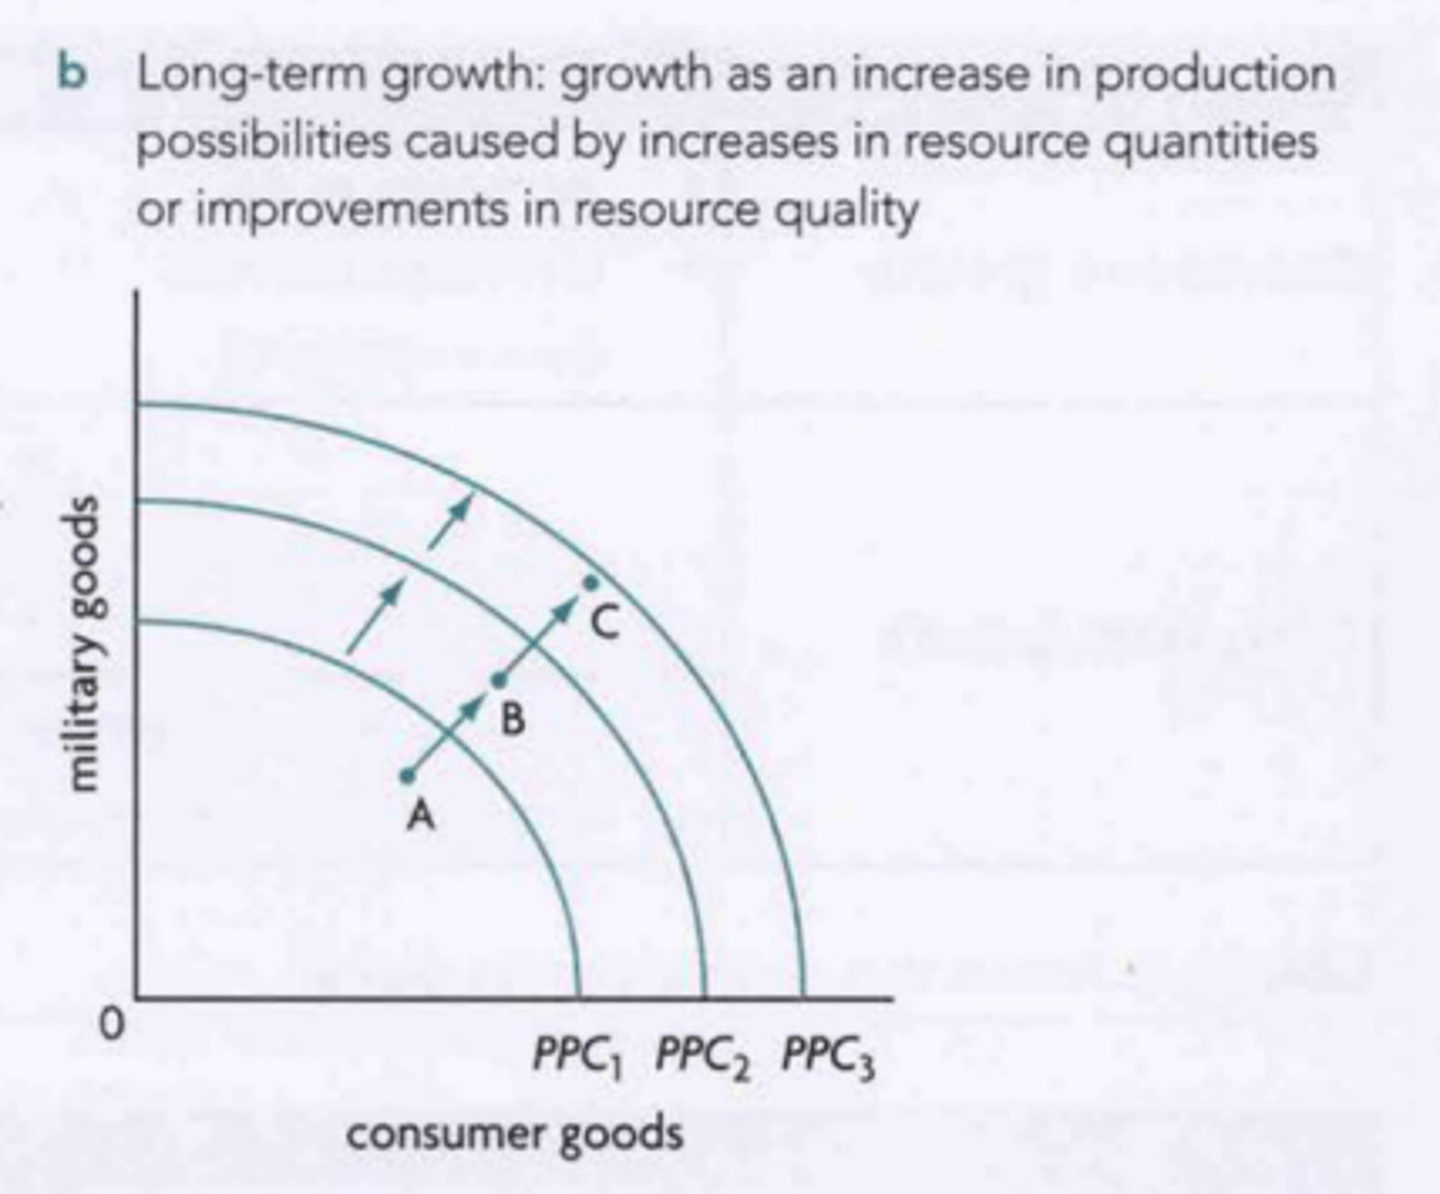
Long-term growth
Growth of an economy over long periods of time shown by rightward shifts of LRAS or outward shifts of the PPC curve.
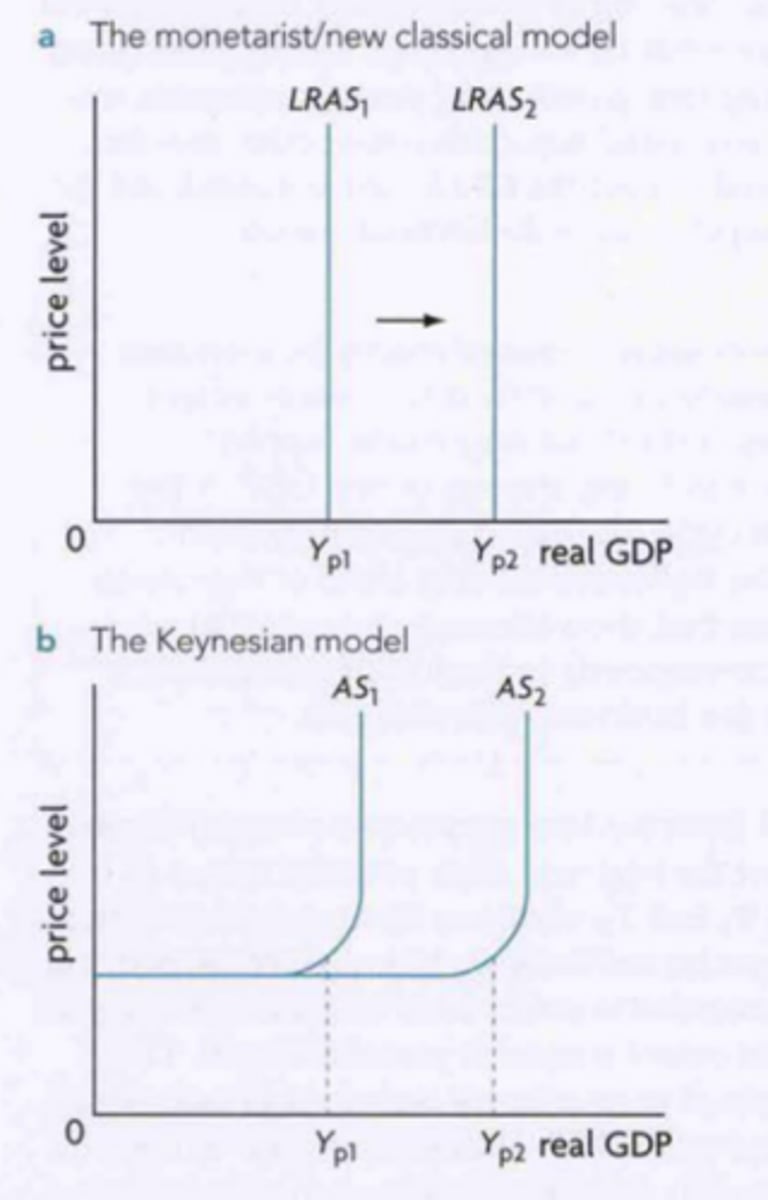
Describe long-term growth in terms of LRAS/Keynesian AS
A rightward shift in LRAS will result in a positive increase in real GDP with an increase in potential output.
Figure 10.4a/b: Positive increases in long-term economic growth in the monetarist/new classical model and Keynesian model
Potential output (PPC)
The hypothetical quantity of output able to be produced by an economy when full employment is reached, shown by a point along the PPC.
Describe why potential output (PPC) is long-term
It usually requires long periods of time and is influenced by major changes in the quantity and quality of factors of production.
Describe long-term growth in terms of PPCs
An increase in labour or resources, shown by an outward expansion of the PPC will result in an increase in labour or resources, causing an increase in real GDP and potential output in an economy.
Table 10.1: Information on how short and long-term growth occur in the AD-AS model and PPC model
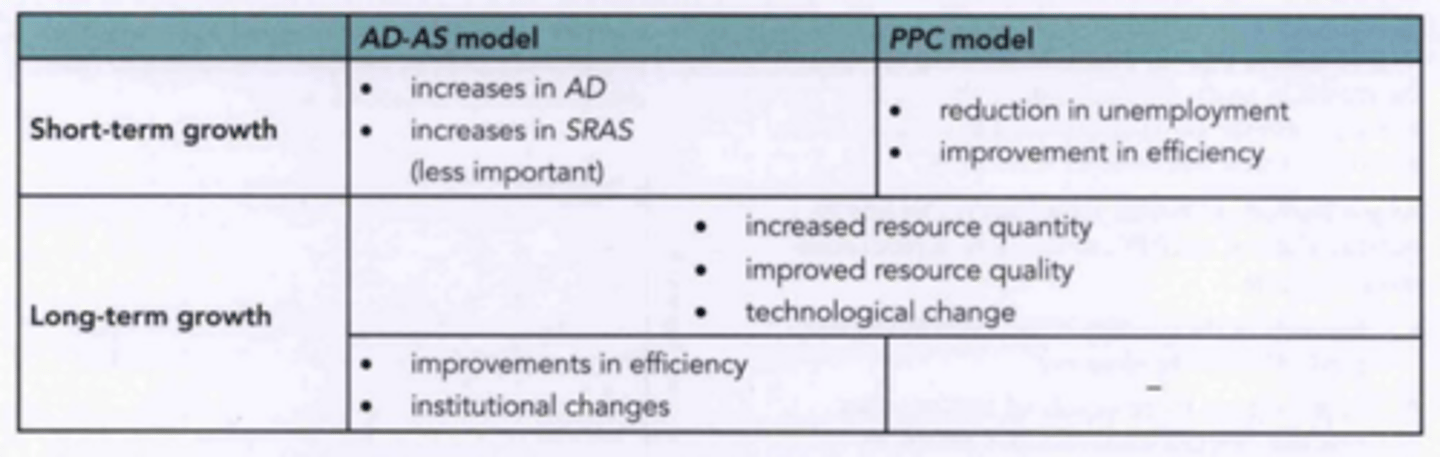
Figure 10.4c: Increase in production possibilities (potential output) on a PPC
Living standards
Refer to levels of income, wealth and consumption of goods and services, including healthcare or education.
Environment
The surroundings or conditions in which a person, animal, or plant lives, operates or gathers resources.
Consequenses of economic growth
Household income+
Will result in an increase in household spending on necessity and luxury goods, creating better living standards.
Reduced poverty+
Only if poorer households increase income, will result in a greater living standards as they have the greatest deprivations.
Public services+
Will result in households/firms earning more income. meaning higher tax revenues to governments, meaning more is spent on public services, creating better living standards.
Availability of goods and services+
Will result in more goods produced and available to buy, especially for home appliences that save time and money, creating better living standards.
Employment+
Will result in greater levels of employment as the output of firms increases, creating better living standards as people earn money to pay for necessities.
Sustainability-
Will result in negative externalities, such as industrial pollution, causing negative living standards/welfare for future generations.
Income disparities-
Will result in higher rate of income increases for wealthier households and lower rate of income increases for poorer households, driving inequality and relatively lower living standards for less wealthy households.
Inflation-
Will result in an increase in the average price levels of an economy, causing inflationary gaps and demand-pull inflation.
10.2 - Low unemployment
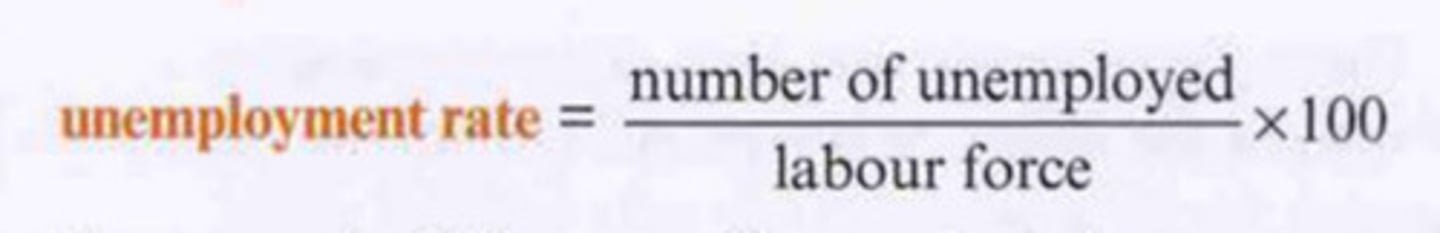
Unemployment
Refers to people of working age who are actively looking and able to have and maintain a job, but who are not employed.
Underemployment
Refers to people of working age with part-time jobs when they would rather work full time, or with jobs that do not make full use of their skills and education.
Labour force
The number of people who are employed plus the number of people of working age who are unemployed.
Figure 10.5: Formula for unemployment rate
Methods and problems of measuring unemployment
The Claimant-count
A method of measuring unemployment using the quantity of people who are claiming unemployment benefits in a country.
International labour force survey (ILO)
A method of measuring unemployment using a survey of households.
Part-time work (with a desire to work full time)
People who work part-time but wish to work full time, and are not included in unemployment data.
Low marginal product
People who work in a job that has a low marginal product cannot be considered as working in the normal way due to the decreased impact on the economy, but are not included in unemployment data.
Over-qualification
People who take jobs below their level of qualification are considered underemployed, but are not included in unemployment data.
Suggest a problem of using the claimant-count as a measure of unemployment
Underestimates the true value of unemployment as some may be unemployed for a short period of time and don't want to waste time claiming benefits.
Suggest a benefit and a problem of using the ILO as a measure of unemployment
Reports a higher number than the claimant-count as it includes those who cannot or choose not to claim benefits. However, subject to statistical error as it is impossible to survey the whole population.
Suggest how the labour force is a problem of measuring unemployment
Deciding who is in the labour force is problematic.
Suggest how illegal employment is a problem of measuring unemployment
Individuals may claim unemployment benefits and be in claimant-count figures but work illegally.
Costs of unemployment
Describe how real output is an economic cost of unemployment
Loss of real output as fewer people are available to work, reducing the productive capacity of the economy.
Describe how income is an economic cost of unemployment
Loss of income for unemployed workers; they can receive unemployment benefits, but are likely to be worse off financially.
Describe how tax revenue is an economic cost of unemployment
Loss of tax revenue for the government as unemployed individuals do not pay income taxes.
Describe how unemployment benefits is an economic cost of unemployment
Loss of available government spending which could be spent on public and merit goods.
Government budget deficit
Occurs when tax revenues are less than government expenditures.
Government budget surplus
Occurs when tax revenues are greater than government expenditures.
Describe how budget deficits or budget surpluses is an economic cost of unemployment
As expenditures rise while tax revenues fall, a budget surplus will become smaller while a budget deficit will become larger, in turn leading to more government debt.
Describe how distribution of income is an economic cost of unemployment
More unequal distribution of income as the unemployed become poorer while the employed are able to maintain their income levels; this may lead to social tensions.
Describe how future employment is an economic cost of unemployment
Unemployed people may have difficulties finding work in the future as they may partly lose their skill ability or because new skills are required by firms, known as hysteresis.
Describe how personal problems is a social cost of unemployment
Being unable to secure a job and a stable income will increase indebtedness, as well as loss of self-esteem, causing psychological stress and lower levels of health.
Describe how greater social problems is a social cost of unemployment
High rates of unemployment, especially when unequally distributed, may lead to increased riots, crime, violence and homelessness arising from growing poverty.
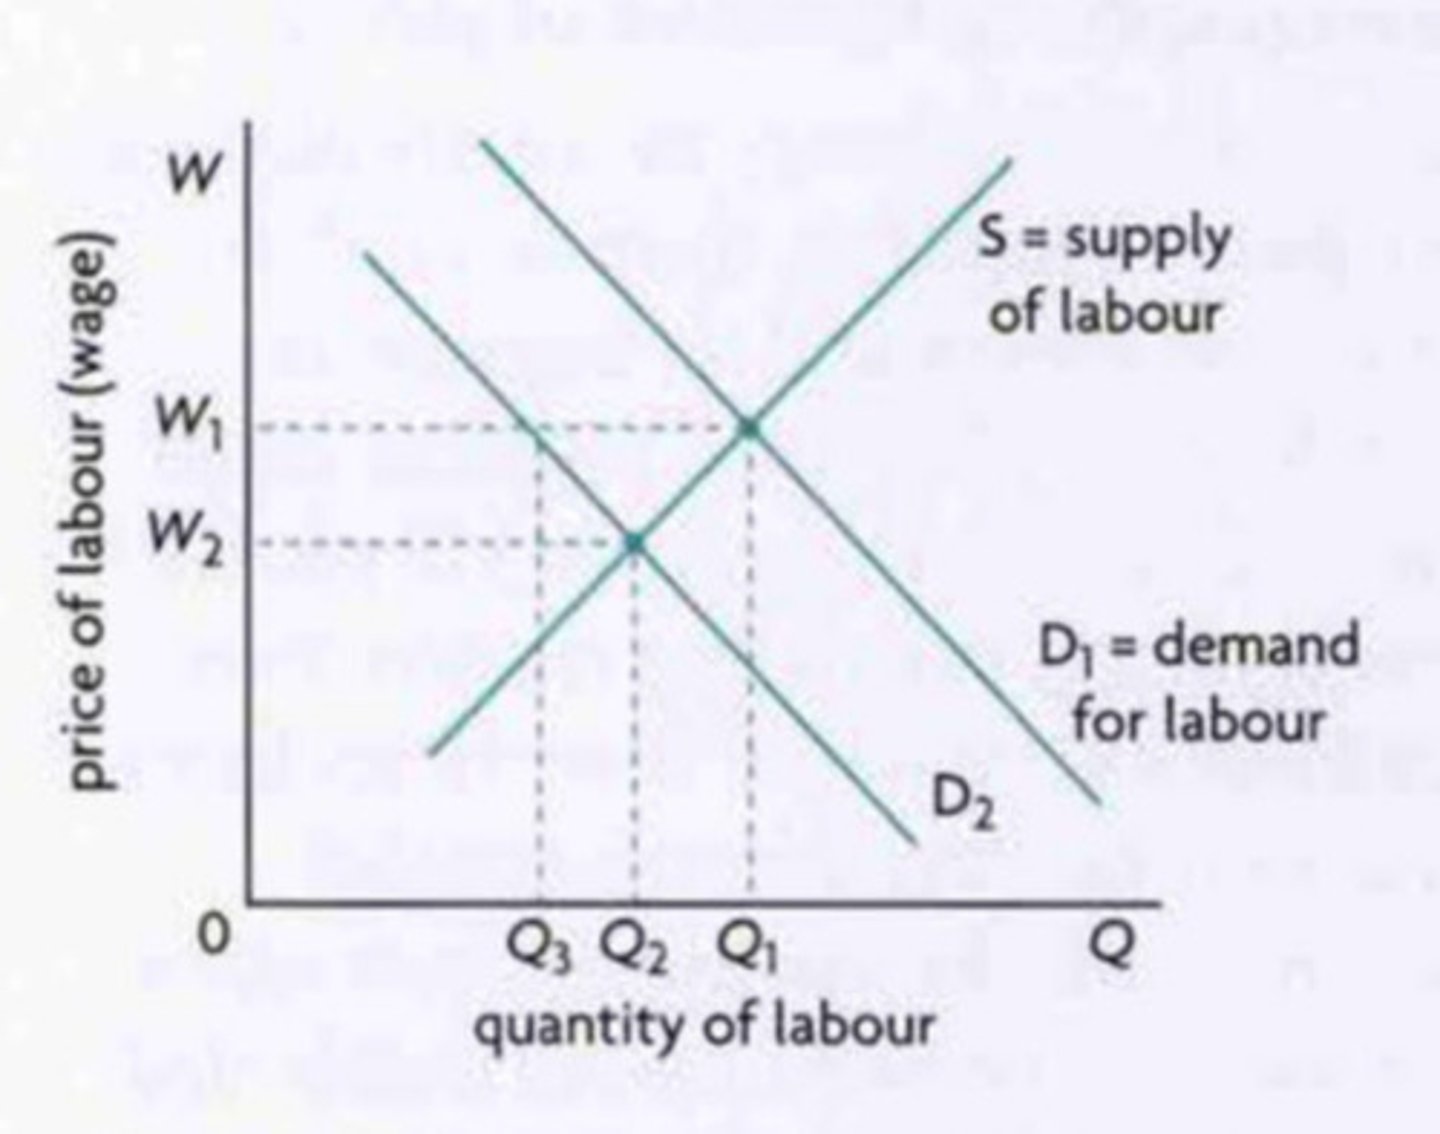
Structural unemployment
A type of unemployment that occurs as a result of technological changes or changes in the geographical location of jobs, including labour market rigidities.
Describe how changes in demand for particular labour skills affects structural unemployment
Occurs when workers' skills no longer match the requirements for available jobs, often due to technological advances or shifts in industry needs, causing mismatches.
Describe how changes in the geographical location of jobs affects structural unemployment
Occurs when jobs relocate to different areas, leaving workers unable to move due to financial, social or personal constraints, causing mismatches.
Figure 10.6a: Mismatches between labour demand and labour supply: falling demand for labour
Labour market rigidities
Factors preventing the forces of supply and demand from operating in the labour market.
Suggest how minimum wage legislation is an example of a labour market rigidity
Intervenes with supply and demand as equilibrium wages are increased.
Suggest how labour union activity for wage bargaining is an example of a labour market rigidity
Intervenes with supply and demand as equilibrium wages are increased.
Suggest how employment protection laws is an example of a labour market rigidity
Intervenes with supply and demand as firing workers becomes more costly, due to condensation payment, making firms more cautious about hiring.
Suggest how generous unemployment benefits is an example of a labour market rigidity
Intervenes with supply and demand as the attractiveness of remaining unemployed increases, reducing the incentive to work.
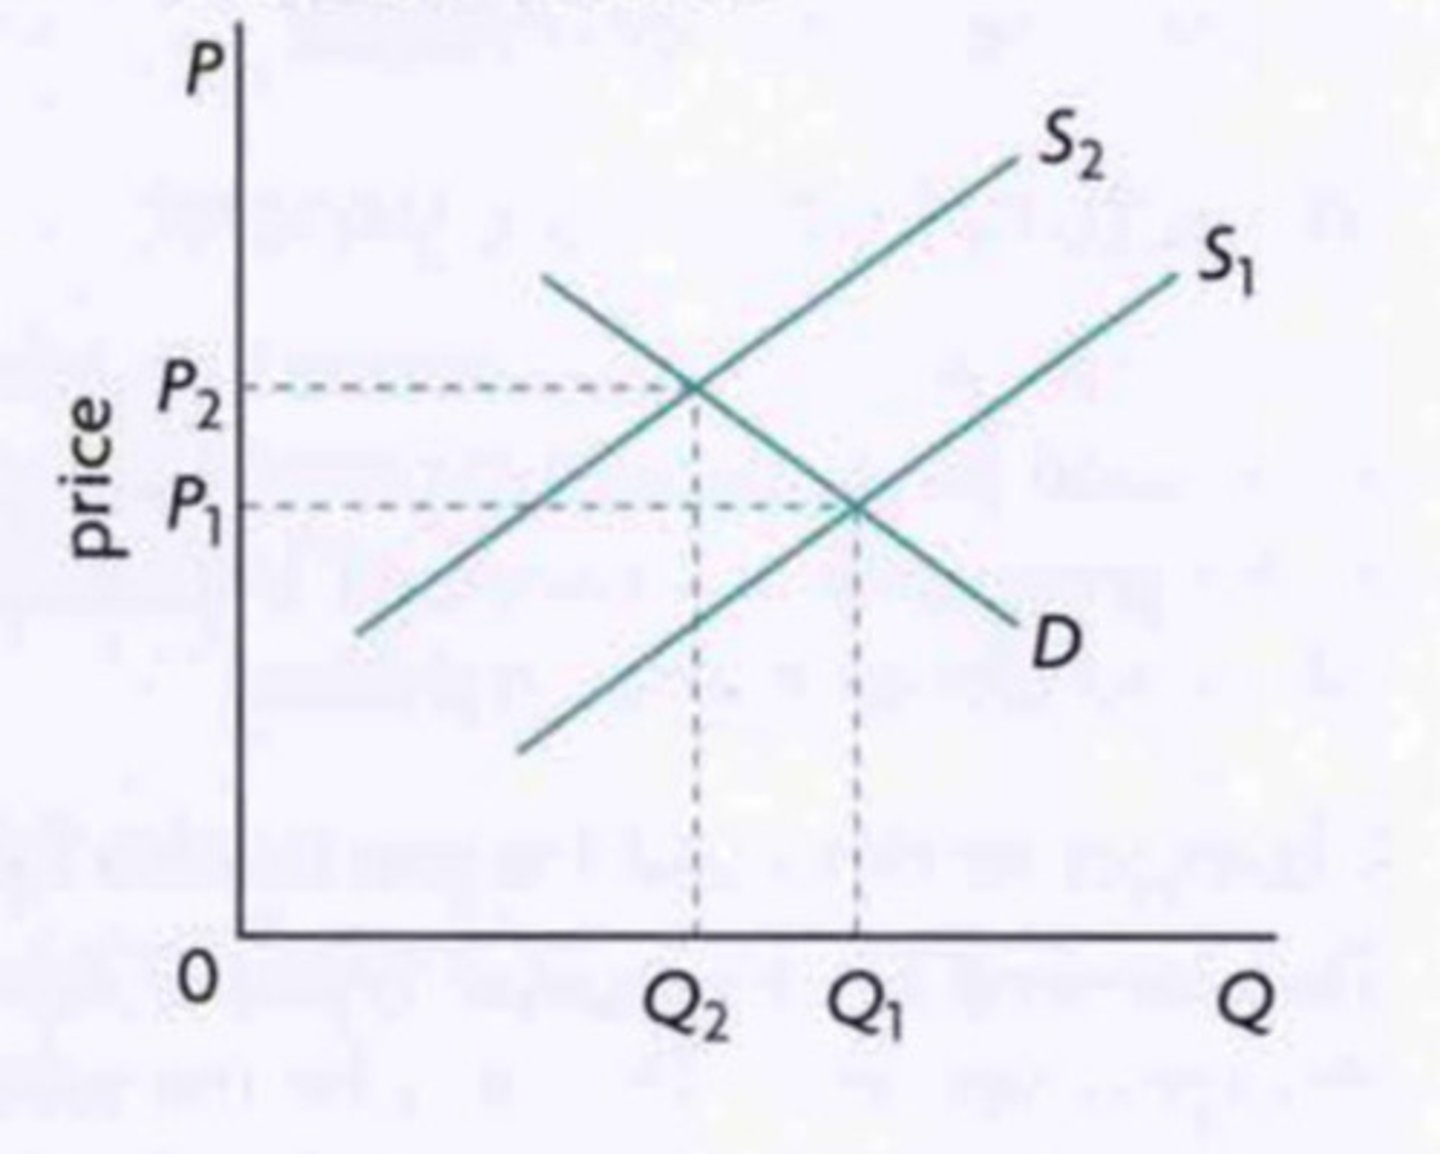
Figure 10.6b: Minimum wage legislation leads to higher than equilibrium wages and lower quantity of labour demanded
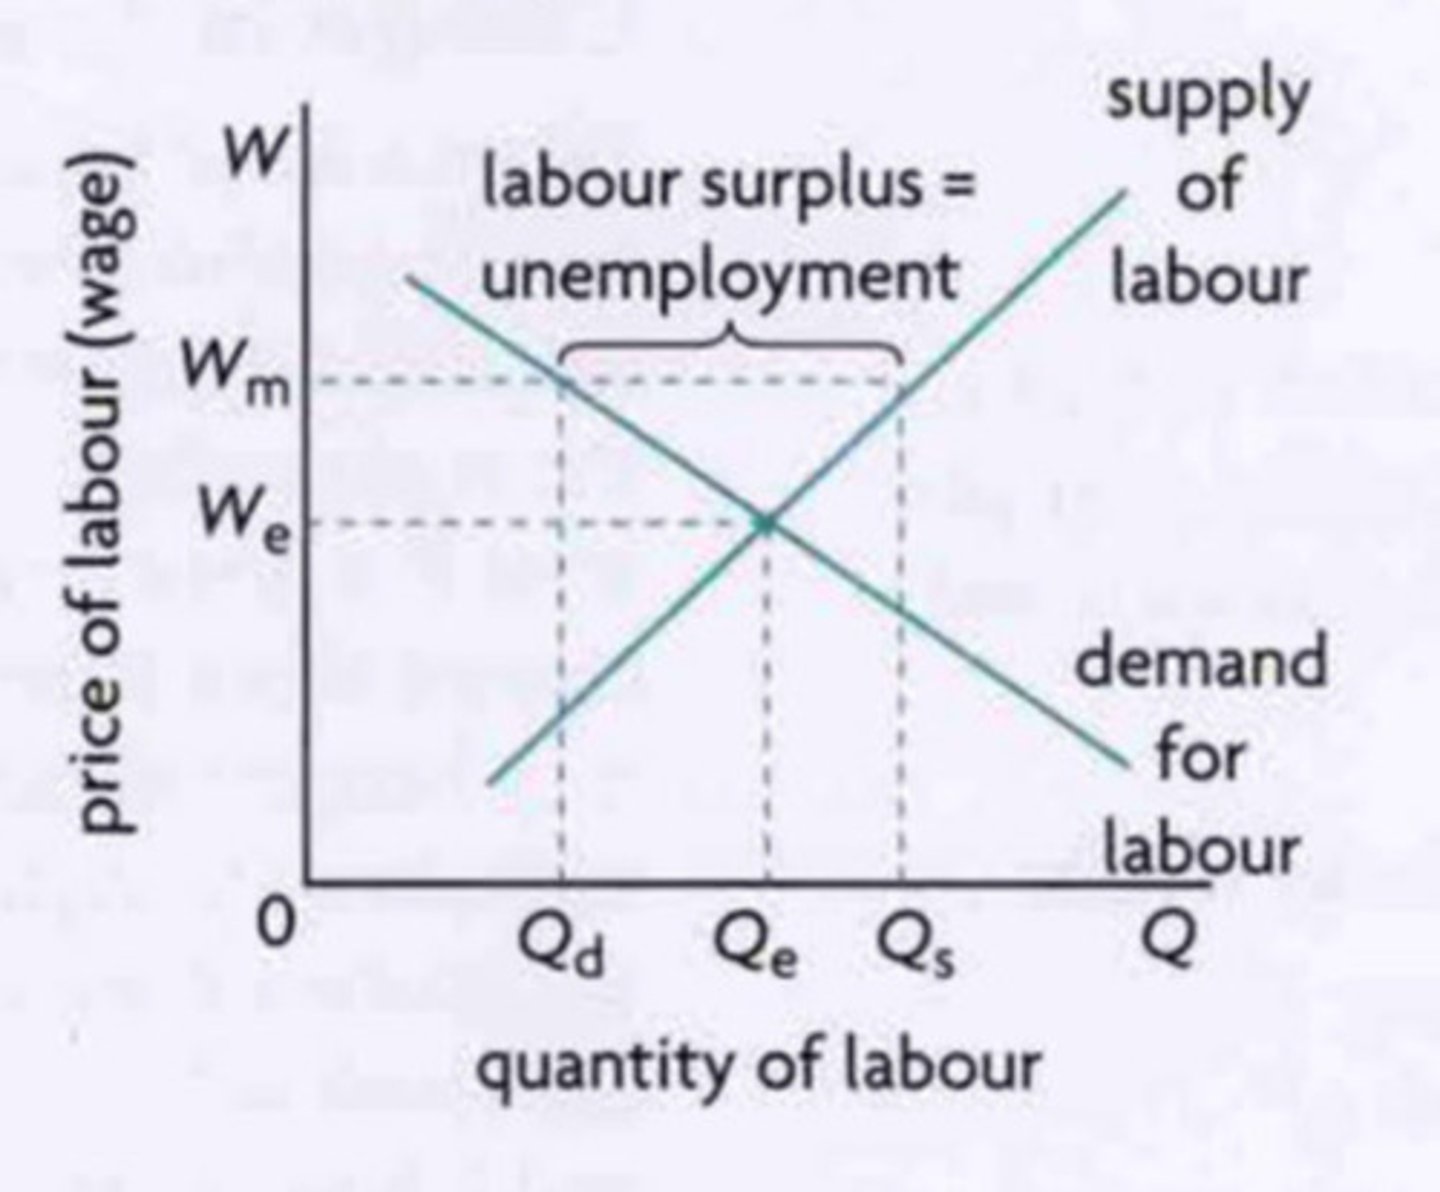
Figure 10.6c: Labour market rigidities lead to increased costs of production causing a decreased quantity of workers demanded
Frictional unemployment
A type of unemployment that occurs when workers are between jobs; workers may leave their job due to being fired, their employer went out of business, in search of a better job or waiting to begin a new job.
Suggest a method in which frictional unemployment could be reduced
A reduction in time that a worker spends in between jobs and improving information flows between workers and employers.
Seasonal unemployment
A type of unemployment that occurs when the demand for labour in certain industries changes on a seasonal basis because of variations in needs.
Natural rate of unemployment
A rate of unemployment when the economy is producing at the full employment level of output, and is equal to the sum of structural, frictional and seasonal unemployment.
Cyclical (demand-deficient) unemployment
A type of unemployment that occurs during the downturns of the business cycle, when the economy is in a recessionary gap - seen as arising from declining aggregate demand.
Figure 10.7a: Cyclical unemployment due to a fall in AD in the monetarist/new classical model
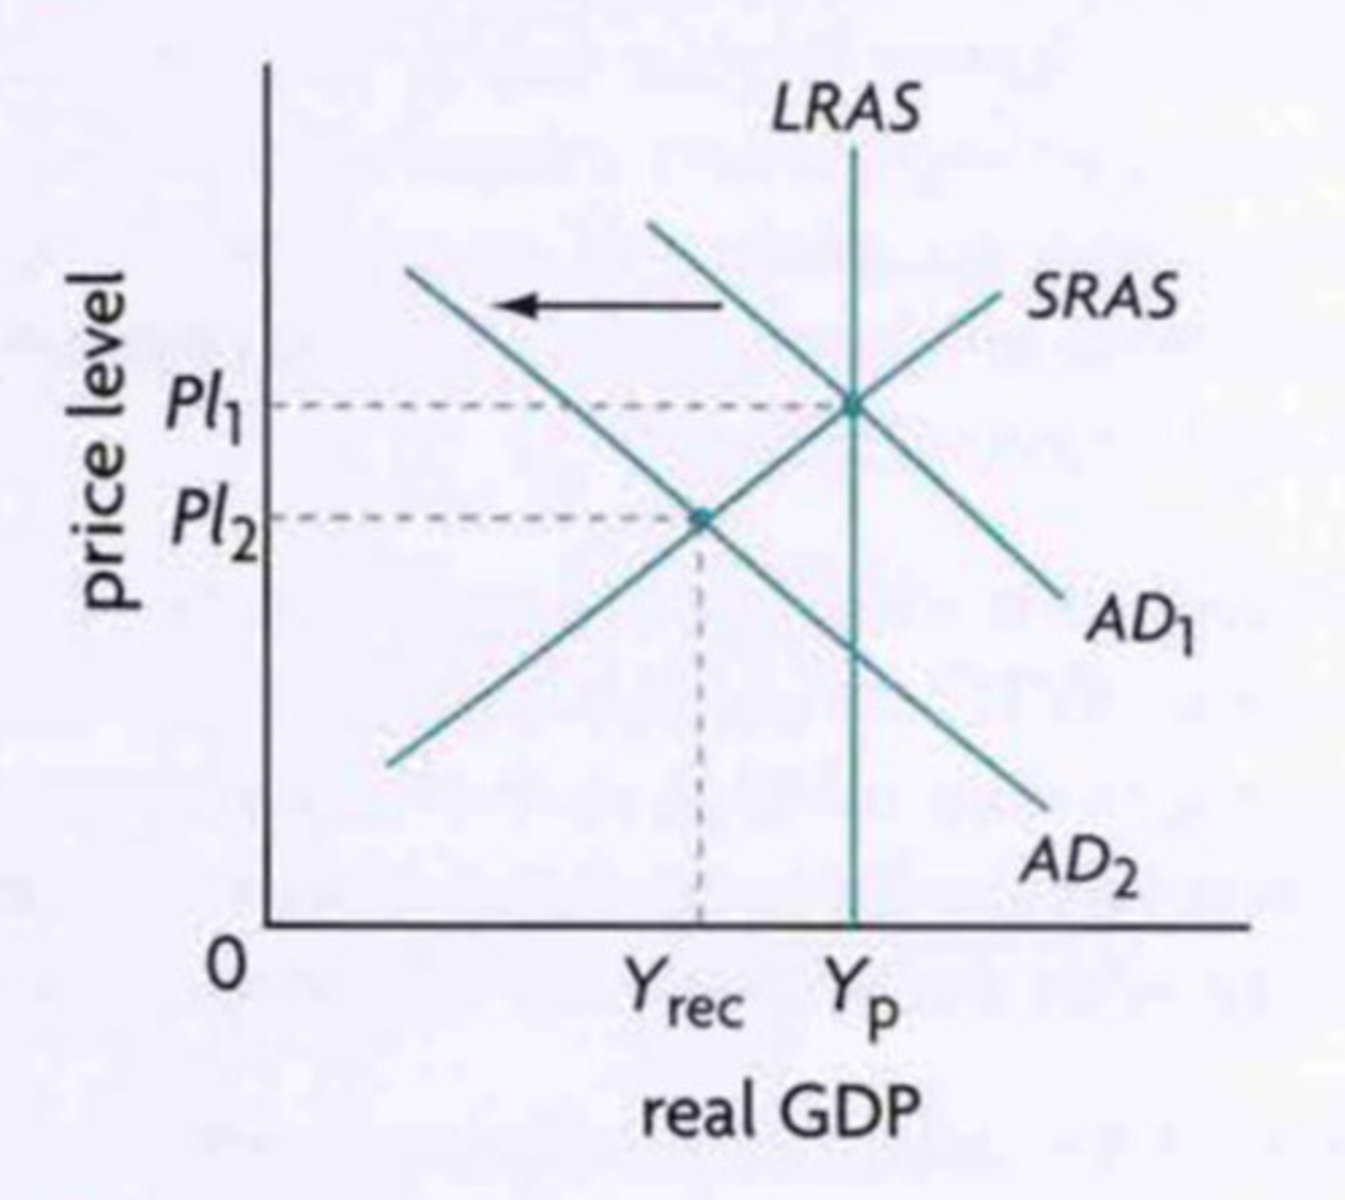
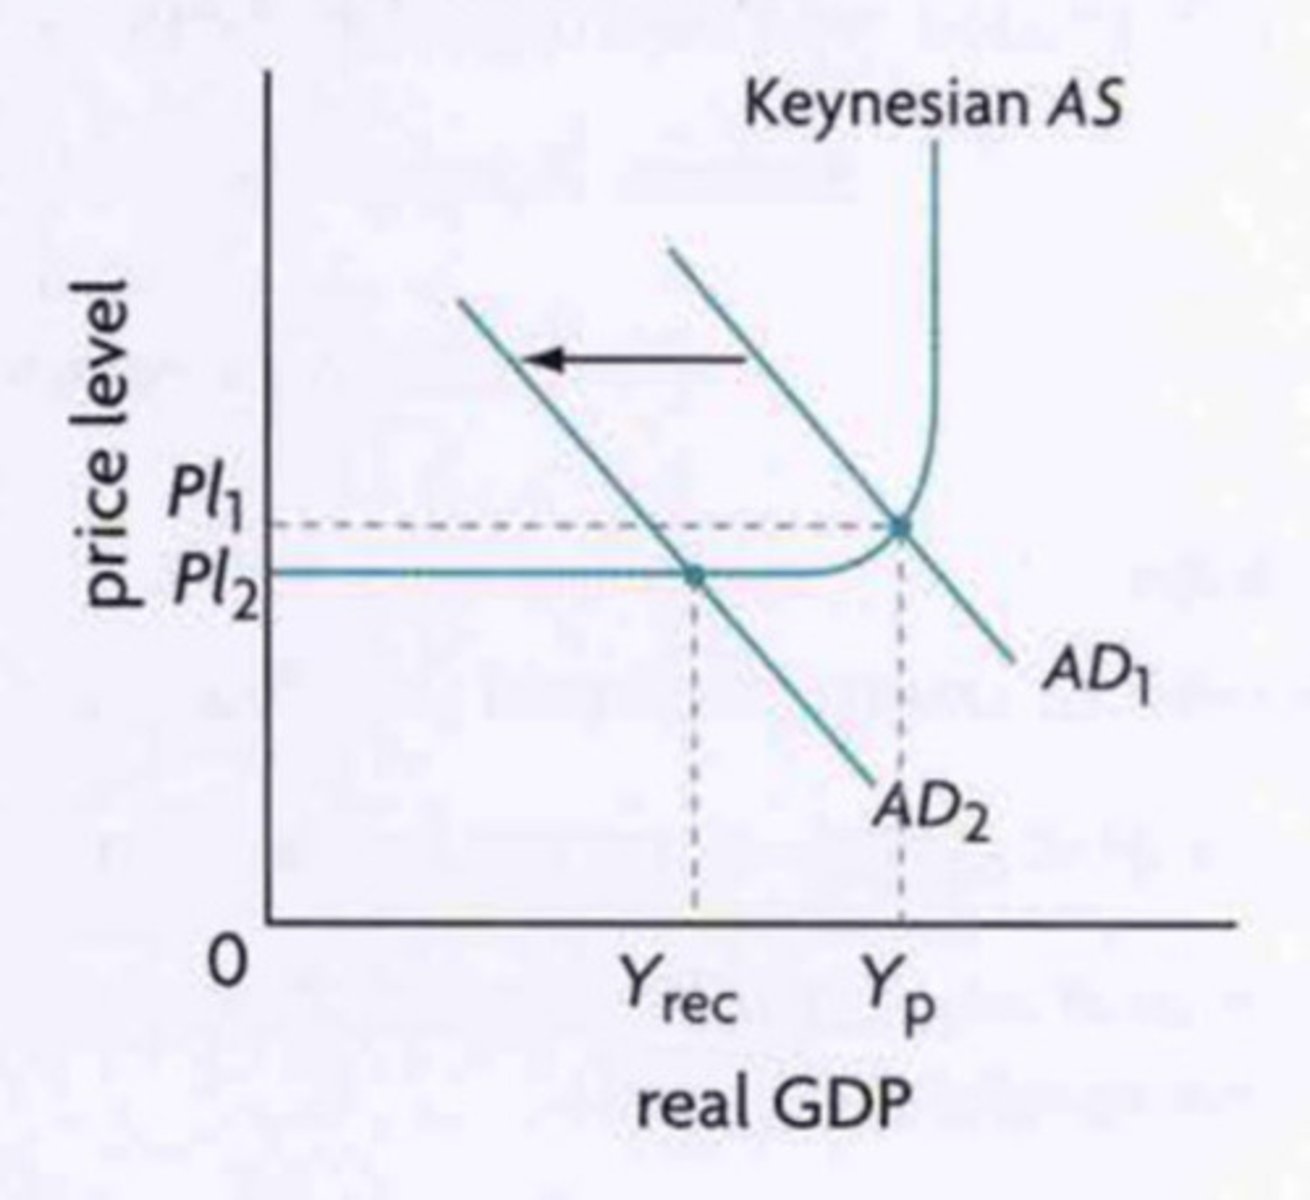
Figure 10.7b: Cyclical unemployment due to a fall in AD in the Keynesian model
10.3 - Low and stable rate of inflation
Inflation
A sustained increase in the general price level of an economy.
Disinflation
A fall in the rate of inflation, involving a positive rate of inflation and should be contrasted with deflation.
What is the consumer price index (CPI)?
A measure of the cost of living for the typical household, and compares the value of a basket of goods and services in one year with the value of the same basket in a base year measured as a percentage change.
What is a weighted price index?
A measure of average prices in one period relative to average prices in a base period that 'weights' the various goods and services according to their relative importance.
Problems of measuring inflation (CPI)
Describe how ‘average consumers’ is a problem of measuring inflation
CPI is based on average spending patterns of the average consumer, which does not exist in reality due to different spending patterns and real income levels.
Describe how ‘regional variation’ is a problem of measuring inflation
Prices differ throughout the economy and so will inflation rates (capital cities will experience different inflation rates compared to provincial towns in those countries).
Describe how ‘discount stores and sales’ is a problem of measuring inflation
Changes in consumption patterns as people purchase more of goods and services with sales at lower prices than used in CPI calculations, overstating inflation.
Describe how ‘introduction of new products’ is a problem of measuring inflation
Changes in consumption patterns as the fixed basket of goods cannot account for new products introduced into the market.
Describe how ‘types of retailer’ is a problem of measuring inflation
Prices vary depending on where you buy a product; large supermarkets will be much cheaper than small corner shops and the inflation rates between these different types of retailers differ aswell.
Describe how ‘changes in the quality of goods’ is a problem of measuring inflation
Quality generally rises over time, which isn't accounted for in the index. This means inflation tends to overstate price increases as it does not account for improvements in product quality.
Describe how ‘variation between countries’ is a problem of measuring inflation
Different countries use different measures of inflation. Doesn't allow comparison between countries.
Describe how ‘one-off changes in price’ is a problem of measuring inflation
Significant price changes in a highly weighted good can distort the inflation rate (or CPI index).
Demand-pull inflation
A type of inflation caused by an increase in aggregate demand, shown as a rightward shift of the AD curve at full employment level of output.
Figure 10.8a: Demand-pull inflation in the monetarist/new classical model
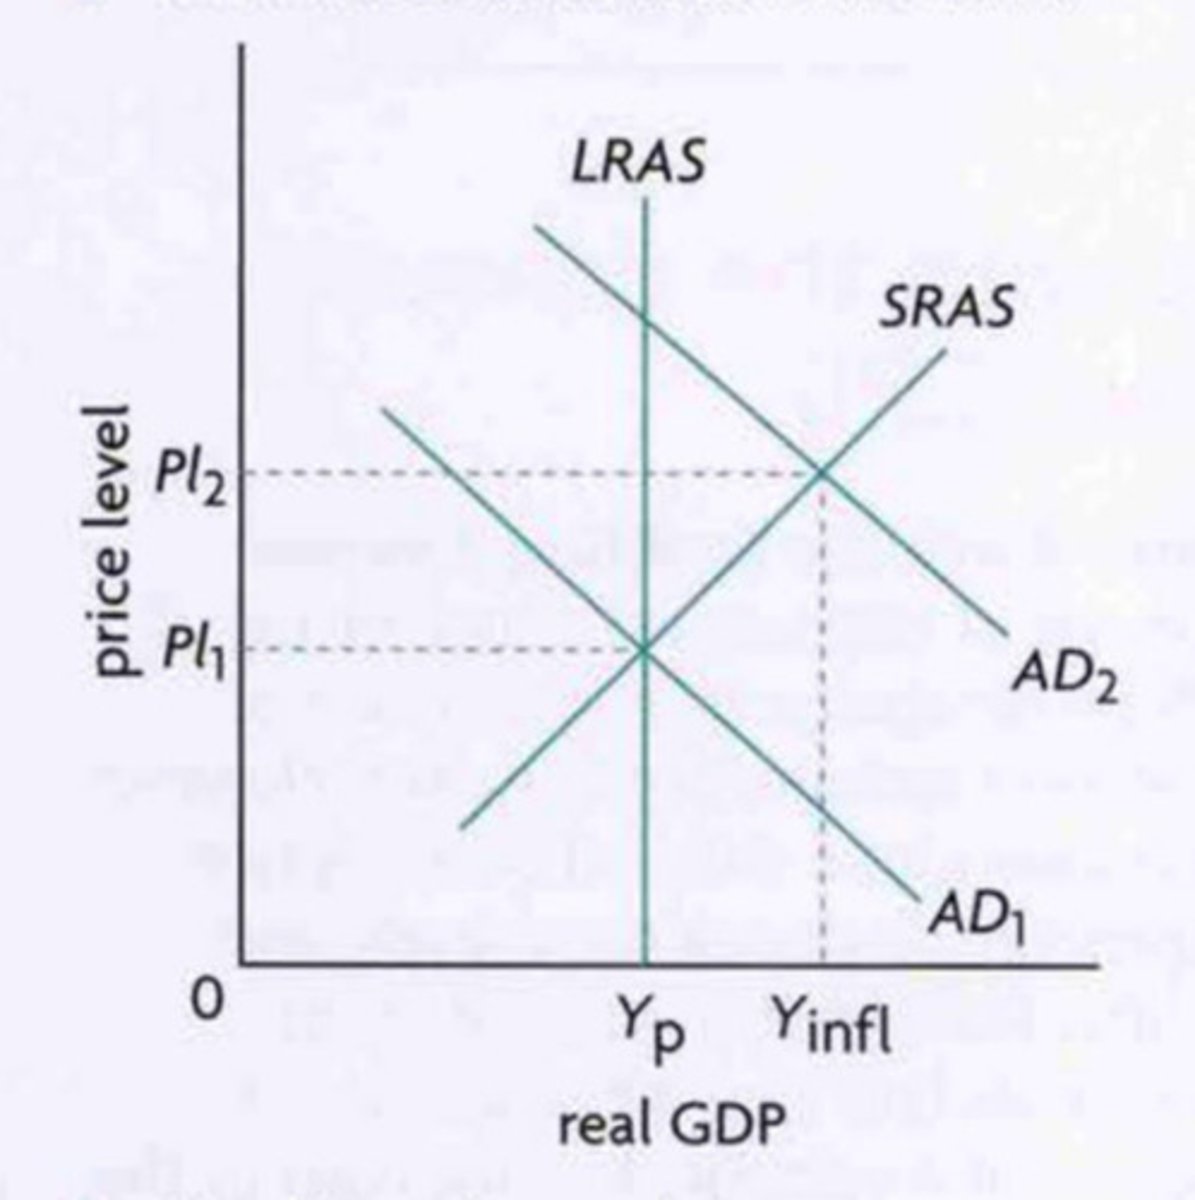
Figure 10.8b: Demand-pull inflation in the Keynesian model
Cost-push inflation
A type of inflation caused by a fall in aggregate supply, usually resulting from increases in costs of production, shown as a leftward shift of the AS curve at full employment level of output.
Figure 10.9: Cost-push inflation in the monetarist/new classical model