AP Stats Quiz 1.3
1/24
There's no tags or description
Looks like no tags are added yet.
Name | Mastery | Learn | Test | Matching | Spaced |
|---|
No study sessions yet.
25 Terms
Is the median resistant to outliers?
Yes
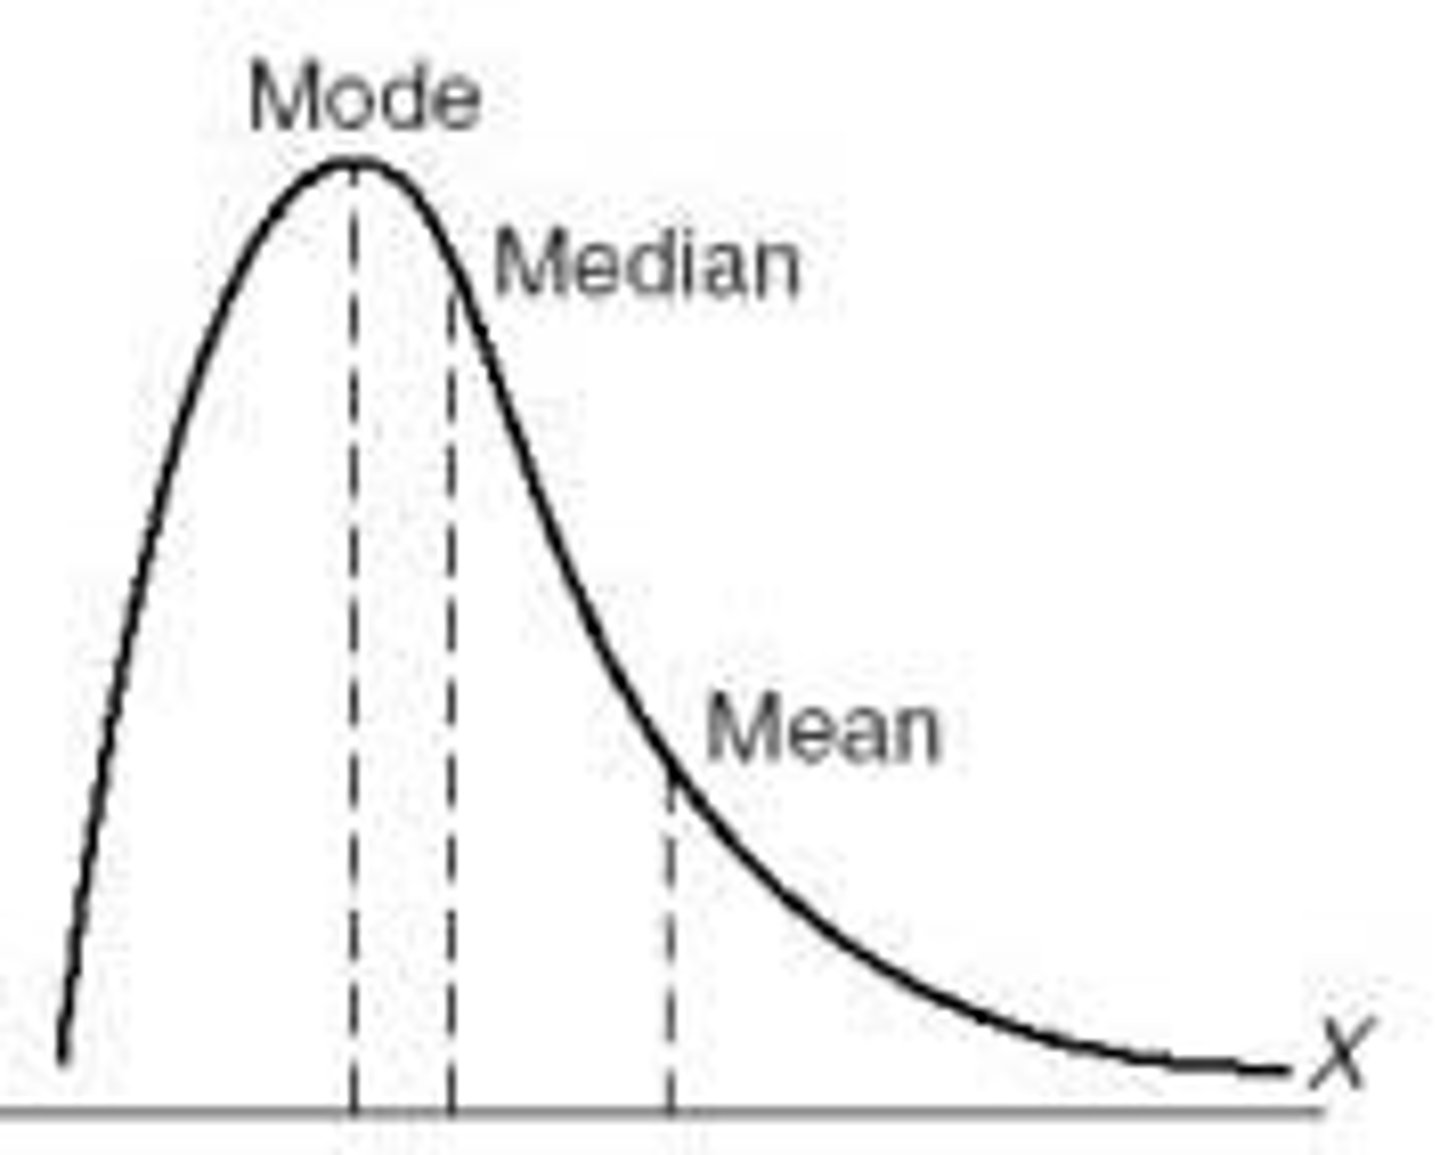
skewed left
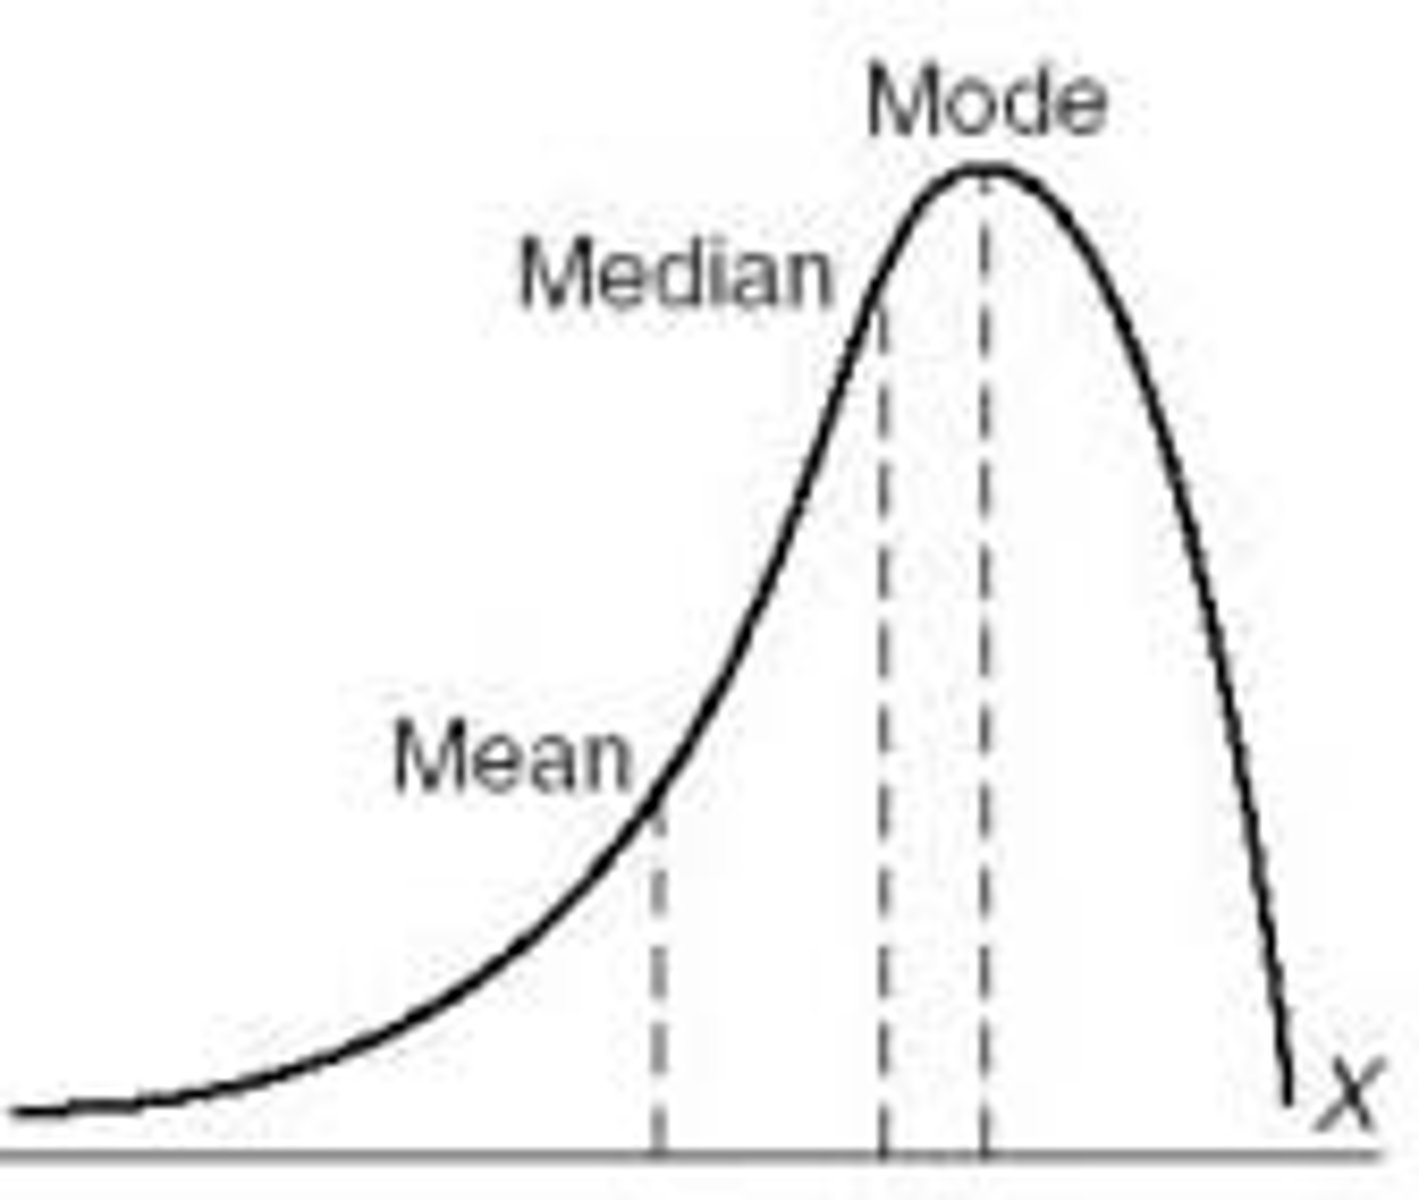
skewed right
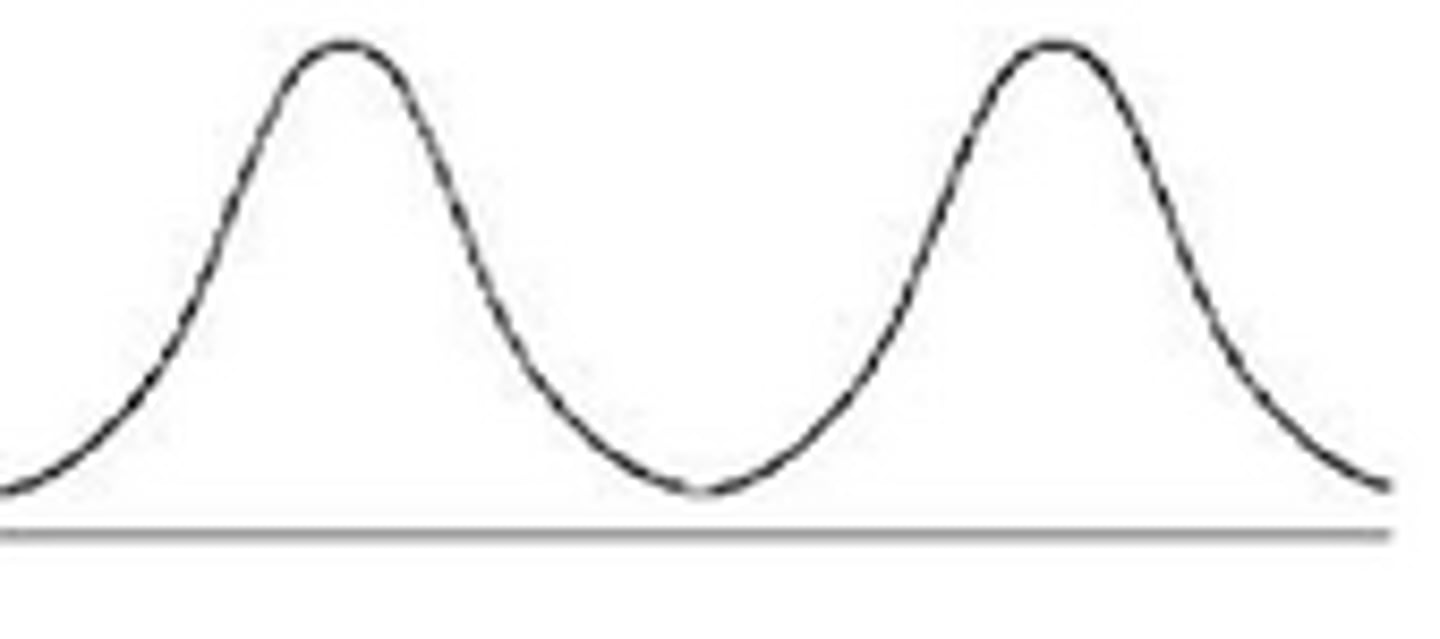
bimodal
To find median
-Order the data from smallest to largest
-find the value of (n+1)/2 (n = the number of observations in the data set)
-if n is odd, the median will be the (n+1)/2 th value in the ordered list
-if n is even, (n+1)/2 th will be between 2 observations. the average of those is the median
median
the middle value, divide the data set in half so there's an equal number above and below the median
resistance measure
a measure that is not affected by outliers
range
the difference between the maximum and minimum values in a distribution *it's one number, not two!
interquartile range
The difference between the upper and lower quartiles. (Q3-Q1)
5 number summary
min, Q1, median, Q3, max
Outlier fences formulas
Lower fence: Q1-1.5(IQR)
Upper fence: Q3+1.5(IQR)
(if numbers are outside of the fences = considered outliers)
(when doing in hw or test or quiz - show formula, but then can solve w/o plugging in numbers)
standard deviation
a computed measure of how much scores vary around the mean score
-
x = M (line over x and swoop-y M thing)
mean
Standard deviation formula (o-x=) (the o and x thing are for a population, the o and x thing squared are for variance)
o-x= square root of all summation(x-mean) squared divided by n
o-x squared= summation(x-mean) squared divided by n
Sx
standard deviation for a sample
O-x
standard deviation for a population
Properties of Standard Deviation
s measures spread about the mean and should be
used only when the mean is the measure of center.
s = 0 only when all observations have the same
value and there is no spread. Otherwise, s > 0
.
s is not resistant to outliers.
s has the same units of measurement as the original observations.
similarities of standard deviation, IQR, and range?
all measure the spread
differences between standard deviation, IQR, and range?
IQR doesn't use entire data set (unlike range and SD)
and only IQR is resistant to outliers
practice response to explain SD amount solved for
This 34.7 is the typical distance of the values in the data set from the mean. In this case, the number of minutes doing homework usually varies from the mean by about 34.7 minutes.
cumulative relative frequency
the accumulation of the previous relative frequencies
cumulative relative frequency distribution/graph
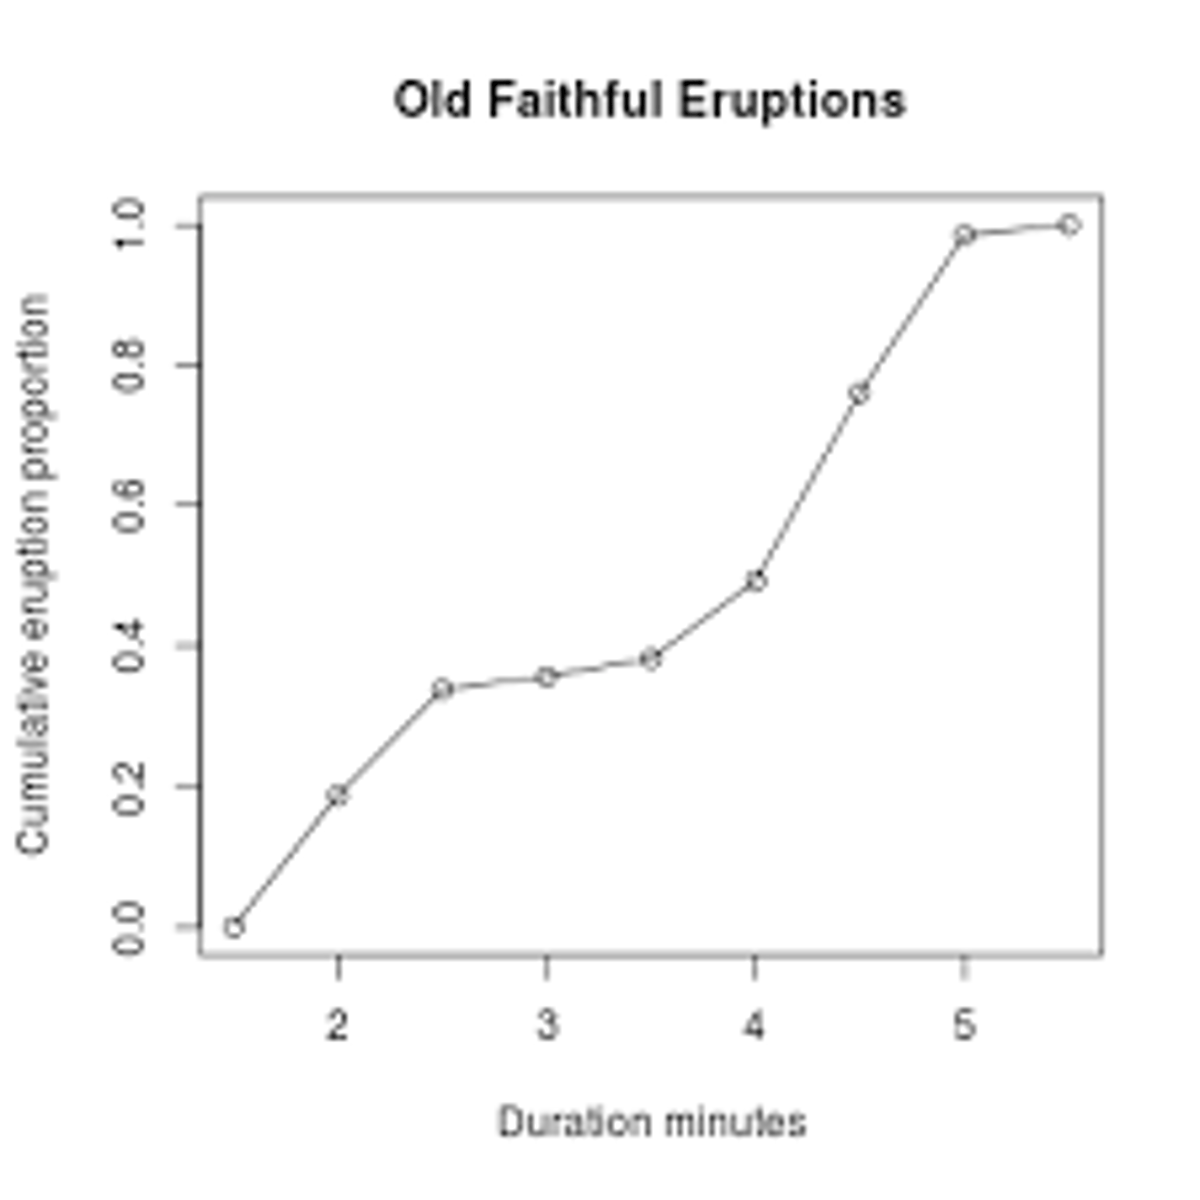
how would you find the percentile for a CRF graph?
look at the y axis and go from the ex: 30th percentile over until it hits the line and go down and see where is matches up on the x-axis values
the Pth percentile
of a distribution is the value with p percent of the observations less than it.
why is it difficult to make a boxplot from a cumulative relative frequency distribution
bc those go from 0-100, so you don't know the exact min or max that would need to be included for a boxplot - you would just have to assume it's 0 and 100