ib economics chapter 5 & 6
0.0(0)
0.0(0)
Card Sorting
1/46
Earn XP
Study Analytics
Name | Mastery | Learn | Test | Matching | Spaced |
|---|
No study sessions yet.
47 Terms
1
New cards
Market Failure
Where the market fails to allocate resources efficiently or to provide the quantity and combination of goods and services mostly wanted by society. This is a result of allocative inefficiency, where too much or too little of goods or services are produced and consumed from the point of view of what is socially desired. Either too many or too little resources have been devoted to the consumption and production.
2
New cards
Allocative Efficiency
the distribution and allocation of resources in society. Occurs when MSC=MSB, a social surplus is at maximum (Marginal Benefit (MB) and Marginal cost (MC))
3
New cards
Externalities
when the actions of consumers or producers give rise to positive or negative side effects on other people who are not part of these actions and whose interests are not considered (positive = 😊 negative= ☹)
4
New cards
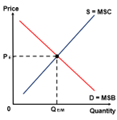
If there are no externalities
If there are no externalities- allocative efficiency would be achieved at the point where MSB=MSC:
• No externalities means the actions of buyers and sellers do not produce spill over effects that affect third parties
• Equilibrium price and quantity are at its optimum
• No externalities means the actions of buyers and sellers do not produce spill over effects that affect third parties
• Equilibrium price and quantity are at its optimum
5
New cards
Positive Externality Graph
Maginal Private Benefit (MPB):
• The additional benefit received by consumers when they consume one more unit of a good
• THUS MPB= demand curve of consumers
Marginal External Benefit (MEB)
• The positive externalities that is caused by consumption of the good
Marginal Social Benefit (MSB)
• The additional benefits to society of consuming one or more unit of a good
• THUS MSB=MPB + MEB

6
New cards
Negative Externality Graph
Marginal Private Cost (MPC)
• The additional costs that producers incur from producing an additional unit of agood or service
• THUS MPC= supply curve of prod ucers
Marginal External Cost (MEC)
• The negative externalities that is caused by the consumption and production of the good
Marginal Social Cost (MSC)
• The additional cost to society of producing one more unit of a good
• THUS MSC= MPC + MEC

7
New cards
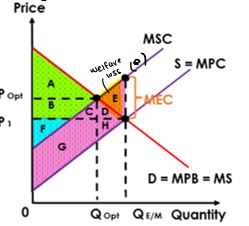
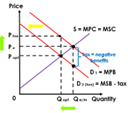
Negative Production Externalities
a negative externality caused by production activities, leading to a situation where MSC > MPC
8
New cards
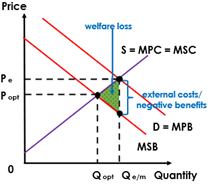
Negative Production Externalities Graph
• Consumer deman curve = MPB = MSB
• Producer’s supply curve = MPC
• Socially desired point where MSC=MSB
• Cost of NPE: MSC=MPC+MEC
• Welfare loss where MSC>MSB indicates actual output>socially desired output
• If the firm was more responible and produces less than Qopt there would be no welfare loss
• Producer’s supply curve = MPC
• Socially desired point where MSC=MSB
• Cost of NPE: MSC=MPC+MEC
• Welfare loss where MSC>MSB indicates actual output>socially desired output
• If the firm was more responible and produces less than Qopt there would be no welfare loss
9
New cards
Advantages and Disadvantages Negative Production Externalities
Advantages:
• Regulations are easier to implement than taxes
• Carbon tax and pollution permits serve as an incentive for firms
Disadvantages:
• Regulations forces firms to comply (does not distinguish between higher and lower polluters)
• Effectiveness of indirect tax (limitations include how to measure accurately the amount of emissions and value of pollution)
10
New cards
Effective of Negative Consumption Externalities
• Using indirect taxes act as an incentive
• Difficult to measure the true value of external costs
• Some demerit goods have inelastic demand so tax is ineffective
• Carrying out campaigns=opportunity cost
• Difficult to measure the true value of external costs
• Some demerit goods have inelastic demand so tax is ineffective
• Carrying out campaigns=opportunity cost
11
New cards
Negative Production Externalities and Government Intervention
• Government can intervene to correct market failure caused by negative produciton externalities:
1. Regulations (e.g. fines)- used to reduce or prevent
2. Tradable permits (e.g. pollutiuon permits) – the government sells the right to generate a given quantity of pollution to firms in an industry which can be bought and traded
3. Imposition of Indirect tax (e.g. carbon tax):
1. Regulations (e.g. fines)- used to reduce or prevent
2. Tradable permits (e.g. pollutiuon permits) – the government sells the right to generate a given quantity of pollution to firms in an industry which can be bought and traded
3. Imposition of Indirect tax (e.g. carbon tax):
12
New cards
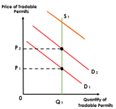
Negative Production Externalities and Tradable Permits Graph
• High polluters have to buy more permits so cost increases whilst competitiveness and profits decrease
• Supply of pollution permits is at S1and demand is at D1
• Over time demand shifts for pollution permits from D1 to D2 when price increases from P1 to P2
• Supply of pollution permits is at S1and demand is at D1
• Over time demand shifts for pollution permits from D1 to D2 when price increases from P1 to P2
13
New cards
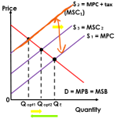
Negative Production Externalities and Indirect Tax Graph
• Higher costs from carbon tax as an incentive for firms to switch to greener energy sources to lower cost of production
• Supply will shift right from S2 to S3
• When firms switch it will reduce the external cost of production as level of ouput will increase from Qopt1 to Qopt2
• Supply will shift right from S2 to S3
• When firms switch it will reduce the external cost of production as level of ouput will increase from Qopt1 to Qopt2
14
New cards
Negative Consumption Externalities
a negative externality caused by consumption activities, leading yo a situation where MSB>MPB
15
New cards
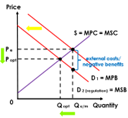
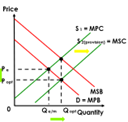
Negative Consumption Externalities Graph
• Producer supply curve= MPC= MSC
• Negative externalities caused by traffic congestion= negative benefits (-MEB)
• Socially desired point where MSC=MSB
• Welfare loss where MSC>MSB where there is overallocation of resources
• If consumers were more responsible and consume less at Qopt the external costs and welfare loss would be eliminated
16
New cards
Demerit Goods
Goods that are considered to be undesirable for consumers and are overprovided by the market
• EXAMPLE: alcohol, tabacco products
• Overproduced and overconsumed
• EXAMPLE: alcohol, tabacco products
• Overproduced and overconsumed
17
New cards
Negative Consumption Externalities and Government Intervention
1. Regulations- government can introduce laws like minimum smoking age to reduce consumption.
2. Advertising- the government can conduct anti-smoking campaigns to raise awareness, this reduce the demand for demerit goods
3. Indirect tax- intervention reduces production and consumption of demerit goods.
4. Tax on consumers- reduces demand of demerit goods
2. Advertising- the government can conduct anti-smoking campaigns to raise awareness, this reduce the demand for demerit goods
3. Indirect tax- intervention reduces production and consumption of demerit goods.
4. Tax on consumers- reduces demand of demerit goods
18
New cards
Negative Consumption Externalities Regulations Graph
Demand falls causing the leftward shift from D1 to D2. The externality would be eliminated and consumption falls from Qe to Qopt
19
New cards
Negative Consumption Externalities Advertising Graph
the government can conduct anti-smoking campaigns to raise awareness, this reduce the demand for demerit goods which causes a leftward shift from D1= MPB to D2 = MSB
20
New cards
Negative Consumption Externalities Indirect Tax Graph
Imposition of tax will increase cost of product which will shift supply left from S1 to S2(tax). Tax=MEC and socially desired level of output= Qopt and market failure is corrected
21
New cards
Negative Consumption Externalities Tax on Consumers Graph
reduces demand of demerit goods which causes leftwards shift from D1= MPB to D2(tax) = MSB. Tax= negative benefit (-MEB, socially optimum levels of output is at Qopt from less consumption and allocative efficiency is retrieved
22
New cards
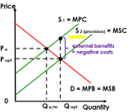
Positive Production Externalities
a positive externality caused by production activities leading to a situation where MSC>MPC
23
New cards
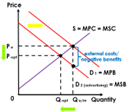
Positive Production Externalities Graph
• At Qe/m MSB>MSC thus too little is being produced due to under allocation of resources
• Due to underproduction, there is a loss of external benefits to society which creates welfare loss (AT AREA (DG))
• If firms were to be more responsible and produce more at Qopt the external benefits would be gained and welfare loss eliminated
• Due to underproduction, there is a loss of external benefits to society which creates welfare loss (AT AREA (DG))
• If firms were to be more responsible and produce more at Qopt the external benefits would be gained and welfare loss eliminated
24
New cards
Positive Production Externalities and Government Intervention
• Government can intervene to correct market failure caused by positive production externalities:
1. Direct Provision
2. Subsidies
1. Direct Provision
2. Subsidies
25
New cards
Positive Production Externalities and Direct Provision Graph
government directly produces the good to create the positive externality. Supply will increase with a rightward shift from S1 to S2(provision) and price will fall from Pe to Popt and optimal level of output is Qopt
26
New cards
Positive Production Externalities and Subsidies Graph
government provides subsidie to encourage production. Subsidy=MEB (negative costs)/ Supply will increase with a rightward shift from S1 to S2(subsidy) and price will fall from Pe to Popt and optimal level of output is Qopt. Market failure is corrected and allocate efficiency is achieved.
27
New cards
Effectiveness of Positive Production Externalities
• Using direct government provision and subsidies are effective
• Government provision and subsidies come from tax revenue
• Difficulty in measure the exact value of external benefits
• Increased prices from increased consumptions
• Government provision and subsidies come from tax revenue
• Difficulty in measure the exact value of external benefits
• Increased prices from increased consumptions
28
New cards
Positive Consumption Externalities
a positive externality caused by consumption activities leading to a situation where MSB>MPB
29
New cards
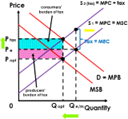
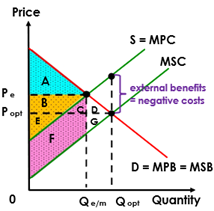
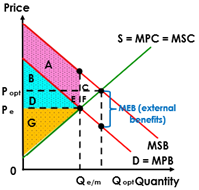
Positive Consumption Externalities Graph
• Consumer demand curve= MPB
• If consumers are aware of external benefits generated D=MPB+MEB=MSB
• Actual price output: Pe and Qe/m
• Socially desired point is where MSC=MSB
• Due to underallocation of resources where MSB>MSC there is welfare loss (AREA AT (CF))
• If consumers were to be more responsible and demand more at Qopt the external benefits would be gained and welfare loss eliminated
30
New cards
Merit Goods
• Goods that are considired to be deserible for consumers and are underprovided by the market
• EXAMPLE: education and immunisations
• Underproduced and underconsumed
• EXAMPLE: education and immunisations
• Underproduced and underconsumed
31
New cards
Positive Consumption Externalities and Government Intervention
• Government can intervene to correct market failure caused by positive consumption externalities:
1. Legalisation & Advertising
2. Direct government provision
3. Subsidies
1. Legalisation & Advertising
2. Direct government provision
3. Subsidies
32
New cards
Positive Consumption Externalities and Legalisation & Advertising Graph
legalisation=compulsory, advertising= encouragement, demand will increase and shift demand curve from D1 to D2 and price will increase from Pe to Popt, optimum out is achieved at Qopt and allocative efficiency is at MSC=MSB

33
New cards
Positive Consumption Externalities and Direct Government Provision Graph
Increases supply from S1 to S2 where actual demand =MPC. The socially desired level of demand at MSB. Results in a price fall from Pe to Popt and optimum output is achieved at Qopt and allocative efficiency is at MSC=MSB
34
New cards
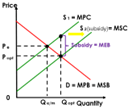
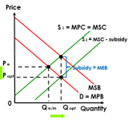
Positive Consumption Externalities and Subsidies Graph
subsidies encourage more production, and subsidy= (-MEC), supply will shift from S1 to S2(sub) where price falls from Pe to Popt and optimum output is achieved at Qopt. Market failure is corrected and allocative efficiency is achieved
35
New cards
Public Goods
a good that is non-rivalrous and non-excludable. Since it is not possible to exclude someone from using a good although they do not pay for it, firms do have an incentive to produce it (the free rider problem). Public goods are therefore provided by and is therefore a market failure.
36
New cards
Quasi Public Good
a public good that appears non-excludable but can be privatised (e.g. roads and tolls)
37
New cards
Direct Government Provision
since private firms do not want to provide public goods, the government must provide them directly at socially optimum levels. Public goods are funded by tax revenue collected, so government has to consider which public groups and in what quantity they are produced. This is done through a CBA (cost benefit analysis)
38
New cards
Common Pool Resources
resources that are not owned by anyone, do not have a price and are available without payment (e.g. lakes, fish in the sea). Creates market failure as there is no market price. This leads to depletion and degradation and is a threat to sustainability.
These include: sustainability, pollution of affluence- eco growth=more pollution, pollution of poverty- those in poverty forced to survive by polluting environment,
• Rivalrous common pool resources: when the good is consumed by one person at it diminishes the amount available for consumption by others
• Non excludable common pool resources: once a good is provided, it is impossible to exclude the consumption even without payment
39
New cards
Government Response to Sustainability:
Carbon Tax and Tradable Permits
40
New cards
Carbon Tax
a tax on fossil fuels intended to reduce the emission of carbon dioxide
• Fuel users are encouraged to change fuels that emit lesser/not carbon as carbon tax increases when there is an increase of carbon emissions from fuel
• Fuel users are encouraged to change fuels that emit lesser/not carbon as carbon tax increases when there is an increase of carbon emissions from fuel
41
New cards
Tradable Permits
Permits that can be issued to firms by a government authority or an international body, and can be traded in a marked, the objective being to limit the total amount of pollutants emitted by the firms.
• If a firm can produce its product by emitting a lower level of pollutants than the level set by its permits, it can sell its extra permits in the market. If a firm needs to emit more pollutants than the level set by the permits, it can buy more permits in the market.
• If a firm can produce its product by emitting a lower level of pollutants than the level set by its permits, it can sell its extra permits in the market. If a firm needs to emit more pollutants than the level set by the permits, it can buy more permits in the market.
42
New cards
Evaluation of Government Response to Sustainability
o Carbon tax makes price more predictable as it stabilises demand and supply
o All producers regardless of the type of industries using fossil fuels will have to pay carbon tax
o Carbon tax does not require as much monitoring as tradable permits
o If the pollution limits on tradable permits are too high, firms do not have an incentive to reduce or stop polluting
o Tradable permits can restrict competition as existing firms will buy up all permits and prevent new firms from entering the industry
o Carbon taxes are regressive- low income earners pay a larger proportion of their income on carbon tax than high income earners
o If carbon tax imposed is too low (tax
43
New cards
Asymmetric Information
a type of market failure where buyers and sells do not have equal access to information, usually resulting in an under allocation of resources to the production of goods and services, as parties to a transaction with less access to information try to protect themselves against the consequences of the information asymmetry.
44
New cards
Government Intervention when sellers know more than buyers:
1. Regulations: laws can be passed to ensure the quality standards and safety features of products. However, this requires constant monitoring and enforcement, which can be time-consuming and enduring a long bureaucratic process.
2. Provision of information: governments can directly supply information to the buyers or introducing regulations that force producers to be transparent by with information. However, there are implications in the collation of data and the accuracy of information and opportunity costs in providing such information, making it impossible to eliminate all asymmetric information
3. License: licenses are required in particular work forces to ensure the quality of service provided to consumers. However, implementing such laws will restrict the supply of workers in these professions
45
New cards
When buyers know more than sellers:
1. Moral Hazard: when decisions are based not on what is considered right, but what provides the highest level of benefit (e.g. buying car insurance knowing you’ll be more reckless)
2. Adverse selection: where buyers have better information than sellers and the highest cost consumers end up buying a particular product (not declaring health conditions, and insurance pays burden)
2. Adverse selection: where buyers have better information than sellers and the highest cost consumers end up buying a particular product (not declaring health conditions, and insurance pays burden)
46
New cards
Abuse of Monopoly Power
when a single firm that dominates the entire market industry restricts competition and influence the market price and output.
47
New cards
Government Failure
a situation where government intervention in the economy to correct market failure creates inefficiency and leads to a misallocation of scarce resources