Critical Thinking
1/64
Earn XP
Description and Tags
Name | Mastery | Learn | Test | Matching | Spaced |
|---|
No study sessions yet.
65 Terms
Hindsight Bias
The tendency to believe, after learning an outcome, that one would've foreseen it. "I knew it all along" phenomenon.
Overconfidence
People tend to think they knew more than they do. In social behavior context, even when we were wrong, we maintain confidence by saying "I was almost right".
Perceiving patterns in random events
Randomness/unpredictability is unsettling, so humans often try to find order in life where there is none. Most random sequences often don't look random.
Critical Thinking
Thinking that does not blindly accept arguments and conclusions. It examines assumptions, discerns hidden values, and evaluates evidence.
The Scientific Method
A method involving theory, hypothesis, operational definitions, and replication to organize observations and verify findings.
Theory
An explanation to behaviors or events that organize observations.
Hypothesis
Testable predictions in the form of a statement, often implied by the theory.
Operational definitions
Carefully worded statements of exact procedures used in the study, which can be used to prevent bias.
Replication
Being able to replicate the study to increase validity or verify its findings.
Description in Psychology
Psychologists describe the way people feel, think, and act through case studies, naturalistic observation, and surveys and interviews.
Case Study
A descriptive technique where one individual or group is studied in depth in hopes of revealing universal principles.
Atypical individual cases
These can mislead; more dramatic stories are often remembered and command more attention.
Naturalistic observation
A descriptive technique of observing and recording behavior in naturally occurring situations without trying to manipulate/control the situation.
Surveys and interviews
Methods of asking people questions to gather data about their thoughts, feelings, and behaviors.
Survey
A descriptive technique for obtaining the self-reported attitudes of behaviors of a particular group, usually by questioning a representative/random sample of a group.
Random sampling
Fairly represents the population because it gives each member a chance at inclusion.
Population
Everyone in the group being studied, from which the sample will be drawn.
Correlation
A measure of the extent to which two factors vary together and thus how well each factor predicts the other.
Correlation coefficient
A statistical index of the relationship between 2 things (-1.00 to +1.00).
Variables
Anything that can vary and is feasible and ethical to be measured.
Illusory Correlation
Perceiving a relationship where none exists.
Regression towards the Mean
Tendency for extreme or unusual scores to fall back (regress) towards the average.
Experiment
A research method in which an investigator manipulates one or more variables (independent variable) to observe the effects of some behavior or mental process (dependent variable).
Experimental group
The group that is exposed to treatment (independent variable).
Control group
The group that does not receive the treatment (dependent variable).
Random Assignments
Assigning participants to experimental/control groups by chance to minimize pre-existing differences between those assigned to the different groups.
Placebo
Inert (no value) substance/condition that may be administered instead of the active agent.
Single blind procedure
Researcher is aware, but participant is unaware of whether they are getting the placebo or not.
Double blind procedure
Neither the researcher nor the participant is aware of which group got the placebo and which didn't.
Placebo effect
Experimental results caused by expectation alone; any effect on behavior caused by administration of an inert substance, which they believe is an active agent.
Independent variable
Factor being manipulated and studied.
Dependent variable
Outcome being measured.
Confounding variable
A factor that is different from the factor being studied that might influence the study's results.
Validity
The extent to which a test or experiment measures/predicts what it's supposed to.
Research design
Pick question, pick most appropriate research design, decide on operational definitions.
Informed consent
Giving participants enough information for them to determine whether or not they wish to participate.
Full debrief
Explanation post-experiment, including its purpose and any deception to participants.
Descriptive statistics
Numerical data used to measure and describe characteristics of groups, including measurements of central tendency and measures of variation.
Measures of central tendency
A single score that represents a whole set of scores, usually mode, mean or median.
Measures of variation
How similar or diverse the scores are, including range - gap between lowest and highest scores.
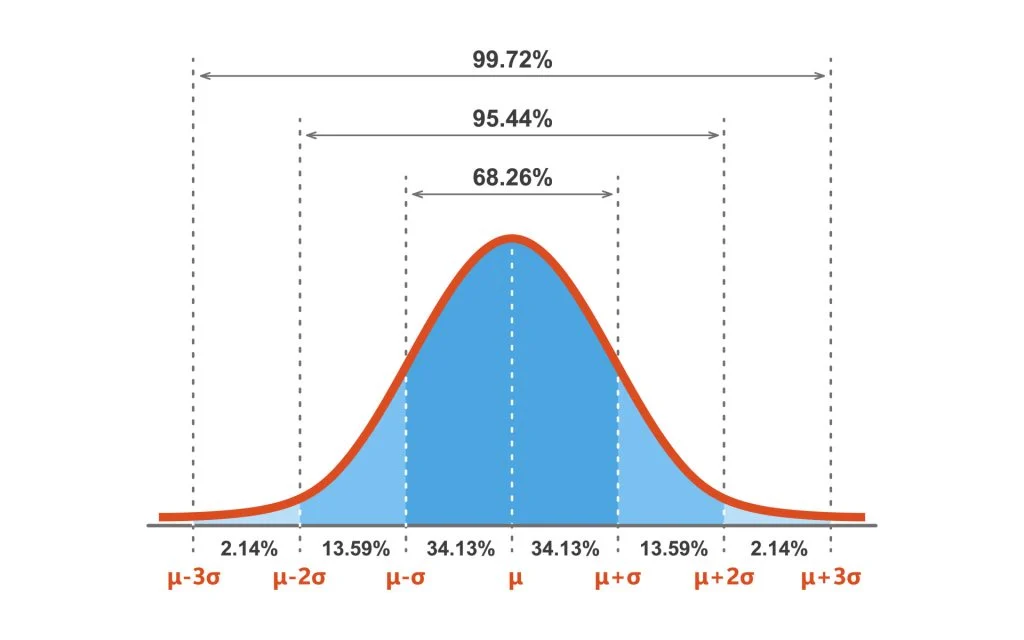
Standard deviation
Computed measure of how much scores vary around mean → provides average deviation from mean.
Inferential statistics
Numerical data that allows one to generalize - to infer from sample data the probability of something being true to a population.
Representative samples
Better than biased ones for reliability of observed differences.
Less-variable observations
More reliable than ones that have more variables.
More cases
Better than fewer for reliability of observed differences.
Statistical significance
A statistical statement of how likely it is that an obtained result occurred by chance.
Descriptive research methods
To observe and record behavior without manipulation.
Correlational research methods
To detect naturally occurring relationships to assess how well one variable predicts others without manipulation.
Experimental research methods
To explore cause and effect by manipulating one or more factors and using random assignment to eliminate pre-existing differences among subjects.
Scatterplot
Graphed cluster of dots, each of which represents the value of two variables.
Positive Correlation
↑↑ or ↓↓; 2 variables that are moving in SAME DIRECTION.
Negative Correlation
↑↓; an increase in one variable that is associated with the decrease in another.
Strength of correlation
Indicated by the number in a correlation coefficient; + or - DOES NOT MATTER, only how far it is from 0.
Aim of statistics
To provide insight by means of numbers.
Three parts of statistics
Collecting data, Describing and presenting data (descriptive stats), Drawing conclusions from data (inferential stats).
Mode
Most frequently occurring score in observation.
Mean
Average of distribution, calculated as x = ∑x/n.
Median
Middle score of data when laid out chronologically.
Range
Difference between highest and lowest score.
Variance
dispersion of a set of observations
List the parts of normal distribution
skewed positive distributions
most of the data points are at the left/low end of the distribution
skewed negative distributions
most of the data points are at the right/high end of the distribution
Z score
this score can locate how far away a certain score is from the mean in terms of standard deviation (z=x-x_)/sd