Y2 S1 Economics of the Financial System
1/63
There's no tags or description
Looks like no tags are added yet.
Name | Mastery | Learn | Test | Matching | Spaced | Call with Kai |
|---|
No analytics yet
Send a link to your students to track their progress
64 Terms
What is direct finance? When and why does it become more imporatant?
Direct finance is when borrowers borrow funds directly from lenders in financial markets by selling them securities (like stocks or bonds).
This becomes more important as countries become richer. Due to:
Financial markets are more developed – richer countries have stronger stock and bond markets, making it easier for firms to raise money directly.
More information transparency – better accounting, regulation, and technology reduce the need for intermediaries to assess borrower risk.
Larger and more sophisticated firms – big firms can issue securities directly instead of relying on bank loans.
Wealthier investors – more people have savings to invest directly in markets rather than through banks.
What is indirect finance?
Indirect finance is when borrowers get funds through financial intermediaries (like banks), which collect funds from savers and then lend to borrowers.
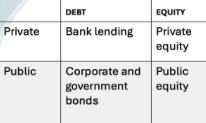
What is equity?
Equity is a residual claim on the firm.
- The payments to equity are not fixed
- Equity is also a share in ownership
- Can be public or private
What is debt?
Debt is borrowing that must be repaid on a fixed schedule.
Interest is paid as agreed between borrower and lender.
Debt servicing—paying interest and repaying the principal—has a prior claim, meaning it’s paid before equity holders.
Debt can be public (like government bonds) or private (like bank loans).
What are the most to least important sources of investment finance?
1. Bank lending
2. Corporate bonds
3. Private equity e.g. venture capital investment, private equity funds
4. Public equity
What are transaction costs?
Definition: the costs to buyers and sellers of conducting an economic exchange.
Two categories:
Direct = the time, effort and expense of searching for products and services and for reaching agreements to trade and the contractual costs of enforcing these agreements; and
Indirect = the economic inefficiencies (or frictions) of exchange, resulting from asymmetric information (leading to hidden attributes, adverse selection and moral hazard)
and also (not a focus in this module) contractual incompleteness (the costs arising because contracts cannot be fully enforced).
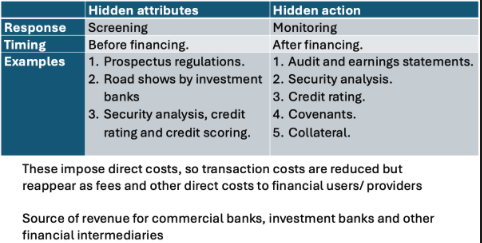
Explain Asymmetric information 1 (hidden attributes)
One party knows more about their qualities or characteristics than the other (e.g. borrower knows their true risk, lender doesn’t).
Leads to problems before a transaction happens.
Explain Asymmetric information 2 (adverse selection)
Occurs before a transaction, due to hidden attributes.
Lenders can’t tell risky from safe borrowers.
They charge an average interest rate, which drives away low-risk borrowers and attracts high-risk ones.
Result: more risky borrowers remain — this is adverse selection.
Explain Asymmetric information 3 (hidden action and agency costs)
After a contract, one party’s actions can’t be fully observed.
This creates agency costs — the costs of monitoring or ensuring the agent acts in the principal’s best interest.
Explain Asymmetric information 4 (moral hazard)
A form of hidden action occurring after a transaction.
People take more risks when they don’t bear the full consequences (e.g. managers gamble with company money or banks take risks due to bailouts).
Example: bank moral hazard — safety nets make banks take bigger risks.
What actions may be taken to reduce indirect transaction costs?
What is liquidity in finance, and how do liquid and illiquid markets differ?
Liquidity refers to how easily an asset can be converted into cash without significantly affecting its market price (Investopedia).
Liquid market example: eBay for used smartphones in excellent condition — you can sell quickly without lowering the price much.
Illiquid market example: Residential property — to sell quickly, you may need to reduce the price significantly.
Lack of liquidity (illiquidity) represents an additional transaction cost.
Liquidity in financial markets depends on trade size: a small size trade, easy to find buyers; a large size trade can be very difficult. Why?
Information asymmetry - large trades often signal private information (that a big buyer/seller knows something). This makes the market less willing to absorb the trade.
Holding large positions is risky - to offset risk they demand price concession/hedge which takes time
Fewer buyers and seller at large sizes
For large trades, you quickly exhaust the available order book depth meaning you must accept worse prices, which reduces effective liquidity.
What is the difference between the buy side and the sell side in financial markets?
Buy Side: Institutions such as asset managers, pension funds, life insurers, and sovereign wealth funds that hold and manage investment portfolios.
They are the buyers of securities in primary markets.
Sell Side: Investment banks and their clients (companies and governments) that issue and sell securities in primary markets.
The sell side is dominated by large global investment banks, though smaller regional and national firms also operate.
What are the main markets in which investment banks earn money, and how are these markets structured?
Investment banks operate mainly in two types of markets:
Primary Market: Where securities (e.g., bonds, equities) are first issued.
Secondary Market: Where securities are subsequently traded — includes foreign exchange, derivative, and money markets.
Secondary market structures:
Order-driven markets: Used for equities and exchange-traded derivatives.
Quote-driven (dealer or OTC) markets: Used for most other instruments.
Participants: Mostly professional/institutional investors; retail investors access these markets via financial intermediaries.
Investment banks play roles in:
(i) Primary markets,
(ii) Order-driven secondary equity markets, and
(iii) Quote-driven secondary OTC markets.
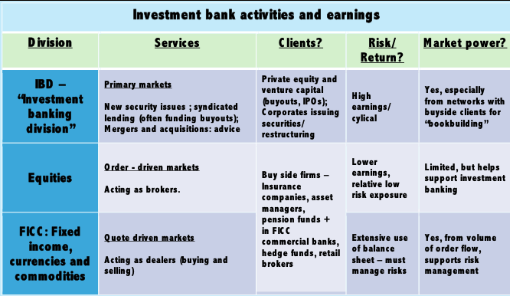
What are the main sources of investment bank earnings, and how do they compare to revenues on the buy side?
Investment bank earnings come mainly from:
Core investment banking: Primary market activities (e.g., issuing securities).
Equities and equity broking.
FICC: Fixed Income, Currencies, and Commodities trading.
(Source: BCG Global Markets Report)
Buy side revenues (earned by global asset managers):
Based on assets under management (AUM).
Average revenues are roughly 0.25% or less of AUM, and have been declining over time.
(Source: WTW 2024 report on global investment managers)
In the primary-market business of the sell side, what recent trends are impacting earnings from advisory and underwriting, and which banks are leading?
Deal activity (e.g., M&A, IPOs, bond issues) plunged after the pandemic and with higher interest rates.
A rebound is underway: advisory and underwriting revenues for the largest global investment banks are expected to rise strongly in 2024 (e.g., equity capital markets up ~30-35% and debt markets up ~40-45%).
On the “sell side” in investment banking:
JPMorgan Chase & Co. (JPMorgan) is widely regarded as the undisputed leader in core investment-banking.
Goldman Sachs and Morgan Stanley are very strong across investment banking & equities.
HSBC, BNP Paribas (BNPP), and Société Générale (SG) are more focused on FICC (fixed-income, currencies & commodities).
Bank of America (BoA), Barclays, Deutsche Bank (DB) and UBS are strong in equities but less dominant in pure core investment banking.
Credit Suisse (CS) struggled in 2023 and was replaced in indexes by Wells Fargo & Co. (WFC).
The combination of market-recovery (issuance, M&A) and front-line banks winning share means the sell side’s primary-market earnings are poised for notable improvement.
Econ1: How do investment banks earn revenues in the primary market through IPOs, bond underwriting, and M&A advisory, and what challenges do they face?
Primary market revenues come mainly from:
IPOs and bond underwriting (through bookbuilding) and M&A advisory work.
Bookbuilding process:
The key challenge is liquidity.
Banks use their network of buy-side contacts to gauge investor demand and establish a price.
Investors indicate willingness to buy (without commitment) and are often offered a price discount (“sweetener”) in return.
Typical fees:
IPOs: around 7.5% of the value raised.
Bond underwriting: similar process but with lower fees.
Advisory/M&A: high fees earned for expertise and access to buy-side networks.
Example:
Google’s 2004 IPO attempted to “go it alone” to save on fees (paid only 3% instead of the usual 7.5%), but may have lost up to 10% of value as a result.
(Source: Slate, 2004 — “Four Ways Google’s IPO Failed”)
How do quote-driven markets in FICC (fixed income, currencies, and commodities) operate, and what factors drive dealer earnings?
Quote-driven markets are supported by dealers who post bid and ask prices.
Dealer profit comes from the spread (margin between bid and ask).
These markets are used for bonds, foreign exchange, and most derivatives.
Dealer dynamics and risks:
Dealers face inventory risk because buy and sell orders don’t always match.
They monitor order flow for informational advantage.
Risk can be offloaded through interdealer brokers (e.g., TP-ICAP).
Market structure effects:
Largest dealers have more advantage → less competition → higher earnings.
Earnings peak when trading volumes are high.
Notably, market power can be as important as skill: “It’s not your skill that earns you money in trading, but the JP Morgan chair you sit on.”
Raises question of bonus justification in concentrated markets.
Practical note:
Many markets combine limit-order and quote-driven features (e.g., MTS electronic bond platform).
How do investment banks earn revenues in order-driven equity markets, and who participates in these markets?
Order-driven market revenues come from executing equity trades for buy-side clients.
Key distinction:
Brokers: facilitate trades for clients but don’t trade on their own account.
Dealers: trade on their own account, not as an agent.
Revenue drivers:
Access to limit order books and alternative trading venues (including dark pools).
Regulation (e.g., NMS in the US, MiFID I in the EU) creates multiple trading venues.
Obligation for best execution for buy-side clients (asset managers, sovereign wealth funds, etc.) ensures trades are executed at optimal prices.
Other participants:
High-Frequency Traders (HFTs)
Hedge Funds
Retail investors (especially in the US)
Revenue depends on execution quality, access to liquidity, and market share in trading venues.
Who provides liquidity in financial markets, and what trade-offs do liquidity providers face?
Liquidity provision is a business model: a way to earn money regularly from trading.
Fundamental trade-off:
Immediacy vs. price:
Buy immediately: get price certainty but possibly worse price.
Provide liquidity (wait for buyers): potentially better price, but risk that price moves against you.
Markets:
Quote-driven markets (FICC): liquidity provided by dealers who post bid and ask prices.
Limit-order (equity) markets: liquidity provided by limit orders placed by market participants (brokers, institutional traders, etc.).
This trade-off exists in both limit-order and quote-driven markets.
Why are short selling and leveraged long positions considered “mirror images”?
Both involve borrowing, posting collateral with a haircut, mark-to-market margining, and rollover risk.
Short selling: borrow a security, sell it
Leveraged long: borrow cash, buy a security
The mechanics and risks are symmetric.
What are the steps in taking a short position?
Borrow a security (bond or equity)
Post collateral with a haircut (e.g. borrow $100m security, post $110m cash)
Sell the borrowed security
Continuously renew the borrowing
Post additional collateral if losses occur (mark-to-market)
Substitute collateral as necessary
What are the steps in taking a leveraged long position?
Borrow cash
Post collateral with a haircut (e.g. borrow $100m cash, pledge $110m securities)
Buy the security
Continuously renew the borrowing
Post additional collateral if losses occur (mark-to-market)
Substitute collateral as necessary
What is a haircut in leveraged or short positions?
The excess collateral posted above the value of what is borrowed (e.g. $110m collateral for $100m exposure).
It protects the lender against price moves and counterparty risk.
How do lenders leverage long and short positions?
Long:
Buy securities and use them as collateral to borrow much of the purchase price
Exposure exceeds capital invested
Leverage can also be achieved using derivatives (e.g. forwards)
Short:
Sell securities they do not own
Borrow the security to complete the sale
Capital committed is only the haircut, not the full value
Leverage can also be achieved using derivatives (e.g. forwards)
How does settlement facilitate short selling?
T+2 settlement allows traders to sell first and borrow later
Securities are borrowed via:
Repo markets (fixed income)
Securities lending markets (equities)
How can derivatives create leverage for long or short positions?
Derivatives (e.g. forwards) provide economic exposure without full upfront payment, creating leverage without directly borrowing cash or securities.
Should short-selling be banned?
High frequency traders; day traders rely on “short selling”. Close out and settle only end of day position.
Critical to providing liquidity to secondary markets.
Short selling/ leveraged long purchase, ensures price of derivative and secondary markets are aligned.
No arbitrage: “future price = spot price + cost of carry + transaction costs”
BUT Leverage/ short selling associated with and maybe magnifies market instability (The “shorts pushed down the price”
Example:
May 2010, beginning of the Euro crisis, Germany with support from France announced a ban on naked short selling
Generally judged to have failed, volatility of Euro, and Eurozone bond and equity markets increased.
What are the consequences of leverage?
A market squeeze.
Market “shorts” have heavily borrowed a bond .e.g HM Treasury 3 year gilt, overnight in expectation of price fall
Price fall does not happen. They must either,
Go into the market to buy to close their positions,
Pay a margin to reborrow and hold their position
Market price may jump substantially for two reinforcing reasons
(a) market news (of many kinds); or
(b) short repurchases plus illiquidity moving price upwards
(lack of sellers of the particular bond in the market)
(a) + (b) = “vicious circle”, forced repurchases as shorts lose money, more price rises. Eventually all shorts pushed out of the market and price stabilises.
Market squeeze can also affect “longs” relying on leverage for short term gains
So unlike a market corner can push price down, until all leverage trades are closed.
Examples, (i) Reddit board squeezing of GameStop shorts in 2021. (ii) Government bonds ”on special” (many traders offering cash to repo a particular bond to maintain a short positions leads to repo rate against that particular bond going negative as well as bond price going up)
What is market abuse and manipulation
Legal terms with meaning established through prosecutions
Many examples
Insider trading
Unlawful disclosure of inside information
Front running a client trade that is large enough to move the market (e.g. buying before price rises)
Market manipulation is a sub-category of market abuse.
Prosecution for market manipulation normally requires establishing two things
The market manipulators have created an artificial price that differs from that which would have obtained in the absence of manipulation; and
They have done so with the intent of deceiving other market participants and hence conducting market transactions that profit themselves at their expense.
Are ‘market squeezes’ a manipulation?
Answer usually no, they are not
Market squeezes can push markets both higher or lower
But if co-rdinated trading is conducted to create an artificial price and earn a profit, they might be
Which length bonds have higher yields?
Long term bonds have higher risk than shorter ones (more chance for markets to change), therefore higher yields to compensate).
What is a bond’s coupon?
The fixed interest payment a bondholder receives, usually expressed as a percentage of the bond’s face (par) value.
Example: 5% coupon on $1,000 par = $50/year.
Paid annually, semiannually, or quarterly depending on the bond.
What is a bond’s yield?
The rate of return an investor earns on a bond.
Can refer to:
Current yield = annual coupon ÷ market price
Yield to maturity (YTM) = total return if held to maturity, accounting for coupon payments and any capital gain/loss from purchase price vs par.
What is the difference between a bond’s coupon and its yield?
Coupon: fixed interest set at issuance, based on face value
Yield: actual return based on current market price
Yield changes when bond price changes; coupon does not.
How does a bond’s market price relate to its yield?
Price ↑ means that Yield ↓
Price ↓ means that Yield ↑
Reason: coupon is fixed, so buying at a higher price reduces the effective return, buying at a lower price increases it.
What is yield to maturity (YTM)?
The internal rate of return if the bond is held to maturity.
Accounts for:
All coupon payments
Difference between purchase price and face value
Provides a comprehensive measure of return.
What is par value and how does it relate to premium and discount bonds?
Par value: The face value of a bond, usually $1,000, is what the issuer promises to pay back at maturity.
The coupon is calculated based on this par value.
Example: 5% coupon on $1,000 → $50/year.
A discount bond is selling below par value.
Example: $950 bond with a 5% coupon ($50/year).
Since you pay less than $1,000 but still get $50/year, your effective return (yield) is higher than the coupon.
A premium bond is selling above par value.
Example: $1,050 bond with a 5% coupon ($50/year).
Since you pay more than $1,000 but only get $50/year, your effective return (yield) is lower than the coupon.
You “overpaid” for the same fixed coupon.
What is the relationship between bond price, coupon, and yield?
Discount bond: Price < Par → Yield > Coupon
Premium bond: Price > Par → Yield < Coupon
At par: Price = Par → Yield = Coupon
Are bond yields nominal or real?
Bond yields are nominal, meaning they do not compensate for inflation. An exception is index-linked bonds, which adjust for inflation.
Why do corporate bonds usually offer higher yields than government bonds?
Corporate bonds have a risk of default, so investors require a higher yield compared to generally safer government bonds.
How does liquidity affect bond yields?
Bonds with lower liquidity (harder to buy or sell without affecting price) usually offer higher yields, as investors prefer more liquid bonds.
How does information discovery work in financial markets?
Prices reflect information discovery through trading.
Similar to a bidding war (car auction).
Buyers bid based on their information.
Price set by the buyer willing to pay the highest price.
Analogy is imperfect:
Markets are well regulated.
Investors have access to the same information.
Differences in willingness to pay depend on:
Risk vs return preferences.
Different interpretations of information.
Views about the views of others (Keynes, Soros).
Securities (stocks and bonds) are continuously traded.
New information is always arriving.
How are movements in equity prices reviewed and analysed?
Use data on:
US inflation.
10-year government bond yields.
Share prices.
Main analytical tool: Gordon Growth Model.
Used for analysing equity prices:
Relative valuation of two firms in the same sector.
Valuing the entire market (more subjective).
How is the Gordon Growth Model used to judge equity prices?
Applied to long-term increases in equity prices.
Required return on equities equals:
Inflation (𝜋).
Real interest rate (𝑟).
Equity risk premium (𝜌).
Equity risk premium is compensation for risk.
High equity prices may be good or bad.
Future equity price prospects are uncertain.
What are the key differences between traded equities and traded bonds?
Equities
Variable promise to pay (dividends).
Exchange listed and exchange traded.
Higher risk, but higher average return over time.
No maturity.
Returns from income and capital gains.
Bonds
Fixed promises to pay.
Exchange listed but often OTC traded.
Lower risk and lower return (especially investment grade).
Have a maturity.
Returns mainly from coupon income.
Some bonds are index-linked to inflation.
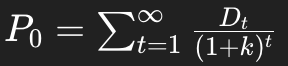
What is the Gordon Growth Model?
Simple model for valuing equities.
Share prices equal the present discounted value of future dividends.
General form: attached
Assumes constant dividend growth rate (g).
Gordon Growth formula:
P0 = D1/k − g
How can the rise and recent fall in share prices be explained using the Gordon Growth Model?
The Gordon Growth Model can be used to value the entire equity market.
Much of the rise in share prices over past decades is due to a fall in k, the required shareholder rate of return.
The required return can be decomposed as:
k = π + r + ρ
How have the components of the required return changed over time?
Inflation (𝜋):
Should not matter much.
Higher inflation also increases dividend growth (g).
Real interest rate (𝑟):
Has fallen by around 4% (400 basis points) since 1985.
Equity risk premium (𝜌):
Not directly observable.
Research suggests it has fallen from about 7% to 6% or less.
What are the limitations of the Gordon Growth Model in explaining equity prices?
An alternative explanation for high prices is psychology and emotion.
The Gordon model and other asset pricing models:
Work mainly for comparing prices of securities.
Do not pin down the absolute level of equity prices.
Because 𝜌 and 𝑘 are unobservable:
“Psychology and emotion” explanations
“Required return” explanations
Are observationally equivalent.
What is the Fisher equation and how is it used to measure real interest rates?
Nominal interest rates depend on:
Real interest rates.
Expected inflation.
Fisher equation:
i = r + πe
Irving Fisher:
Renowned American economist, early 20th century.
Mishkin’s measure of real rates:
r = i − πe
Treasury bill real rates:
Fall from about 5% in early 1980s to around 0% in 2020.
Historical note:
Real rates were low in the 1950s–60s.
Data distorted by financial interventions.
What are the different ways to measure real interest rates?
Ex post measure
Compare nominal yields and current inflation.
Falls from about 6% in early 1980s to around 0% today.
Question: short-term or long-term yields?
Ex ante measure
Uses expected inflation.
Measured using statistical models or surveys.
Results broadly similar.
Inflation-indexed securities
TIPS (US) and index-linked gilts (UK).
Fall from around 2% in early 2000s to 0%, then rise back to 2%.
Measures differ, but all suggest:
Real interest rates have fallen substantially.
Why do falling real interest rates matter in practice?
Falling real rates and higher equity prices help explain:
University lecture strikes.
Pension funds (simplified balance sheet):
Assets:
Bonds (older members).
Equities (younger members).
Liabilities:
Pension promises.
Linked to average salary.
Protected against inflation.
As real rates fall:
USS requires higher contributions to meet guarantees.
Universities must contribute more (less money for students).
Lecturers must pay more.
USS seeks to reduce promises to younger lecturers.
Legal promises already made to older generations.
Some good news:
Recent repricing of 10-year bonds helps sustain pension promises.
Can we use supply and demand to understand bond yields?
Short answer: yes and no.
Mishkin Chapter 5.2 discusses supply and demand in the bond market.
See Mishkin’s Figure 1 (and appendix on long-term yields).
Key limitation:
In the short run, bond supply is fixed.
Supply curve is vertical.
What determines demand for a particular bond?
Demand depends on:
Prices and yields of other similar bonds.
Bonds are close substitutes:
Demand curve is close to horizontal.
In very liquid markets:
Demand curve is almost perfectly horizontal.
Demand also depends on:
Investor perceptions of risk.
What is the Ramsey-based formula for the equilibrium interest rate and what do its components mean?
r= σ/q + θ + (α⋅n)
q = technological progress (PPF growth)
σ = inter-temporal elasticity of substitution (willingness to shift consumption)
θ = rate of time preference (impatience)
n = labor force growth
Why has desired physical capital investment fallen?
Shift from physical to human capital
Inequality
Fiscal deficits
Falling productivity growth
Effect: Leftward shift in the supply of bonds → fewer bonds issued → upward pressure on interest rates
Why has desired savings increased globally?
- Aging populations (demographics)
Rising inequality
Global savings glut
Effect: Rightward shift in the demand for bonds → more savings → downward pressure on interest rates
How do shifts in investment and savings interact to affect global interest rates?
- Falling investment (leftward supply shift) → tends to raise rates
Rising savings (rightward demand shift) → tends to lower rates
Low global interest rates occur when rising savings dominate weak investment
What is the role of human capital in the Rachel and Smith framework?
Shift from physical to human capital reduces physical investment demand → fewer bonds needed → structural shift in capital allocation