Chap 6 Linear correlation, linear regression and organisation of data with more than one variable
1/40
Earn XP
Description and Tags
Linear correlation, linear regression and organisation of data with more than one variable
Name | Mastery | Learn | Test | Matching | Spaced |
|---|
No study sessions yet.
41 Terms
Correlation
When the values of one variable vary systematically with respect to the values of the other (mutual relationship).
Graphical representation of a relationship
Two-dimensional graphical representation
Two-dimensional graphical representation
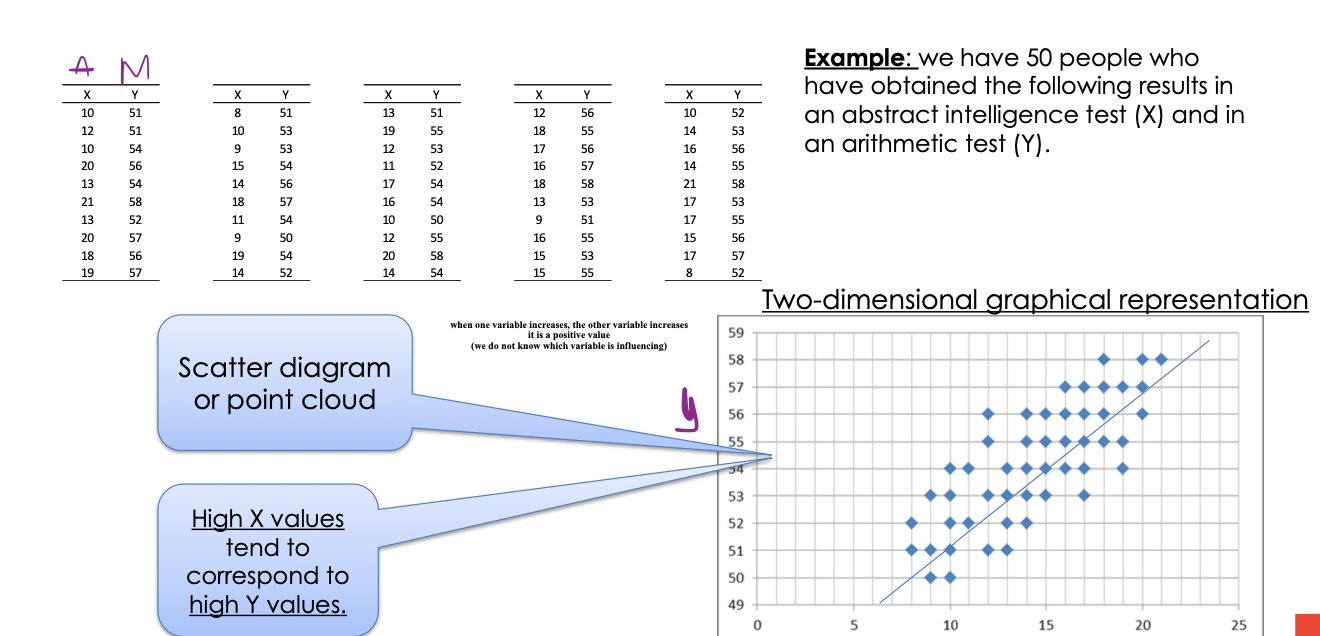
The simplest way to describe a two-dimensional distribution of a ratio is to represent the pairs of values in the Cartesian plane.
Graph of Linear correlation is called
point cloud or scatter plot
scatter plot
Graph of Linear correlation
Two-dimensional distributions
The set of pairs of values corresponding to each individual when we study simultaneously the values of two variables in a population.
Defined by two values (x,y)
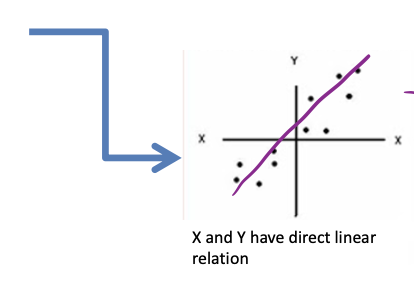
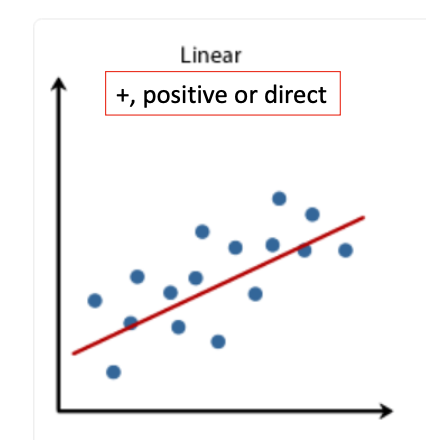
direct linear relationship
Two variables X and Y have a direct linear relationship when high values of X correspond to high values of Y and low values in X correspond to low values of Y.
positive correlation
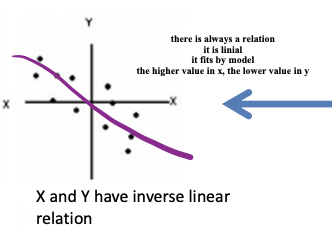
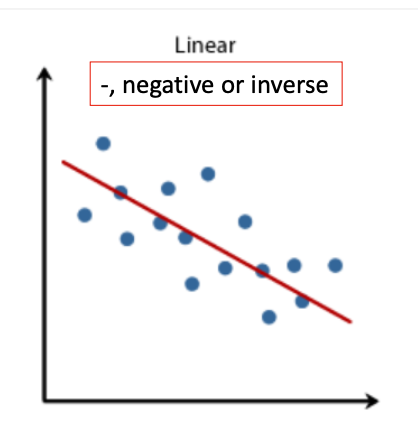
inverse linear relationship
Two variables X and Y have an inverse linear relationship when high values of X correspond to low values of Y and low values of X correspond to high values of Y.
negative correlation
Two-dimensional graphical representation example
Scatter plots or point clouds are a tool for correlation analysis. (POSITIVE OR DIRECT)
Scatter plots or point clouds are a tool for correlation analysis. (NEGATIVE OR INVERSE)
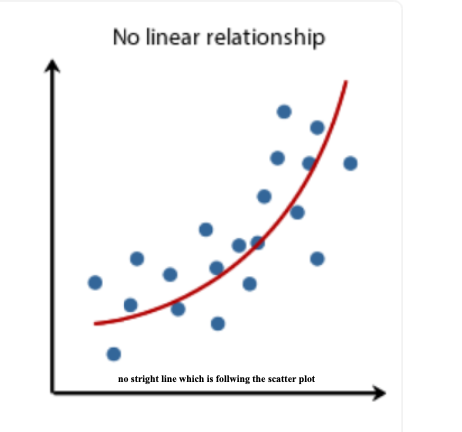
Scatter plots or point clouds are a tool for correlation analysis. (NO LINEAR RELATIONSHIP)
Quantification of a linear relationship
Correlation analysis
Simple correlation analysis
Correlation coefficient
Correlation analysis
It measures & indicates the degree to which the values of one variable are related to the values of another.
Simple correlation analysis
Measures and indicates the degree of relationship between an independent variable and a dependent variable.
Correlation coefficient
The value that quantifies the degree of correlation.
The result of the correlation analysis.
correlation coefficient is a number that shows how strong and in what direction two variables are related.
ranges from +1 to -1
formula for the correlation coefficient
we use something called the Pearson r.
covariance
This is almost exactly the same as the formula for variance, but instead of
multiplying scores by themselves we multiply the score on one variable (X) by the score on the second variable (Y)
Sxy (Sxy Formula (Sample Covariance Coefficient))
The covariance coefficient (Sxy) gives the direction (positive or negative) of the relationship between the two variables, but it doesn’t tell you how strong the relationship is (for that, we use the “PEARSON r “ correlation coefficient).

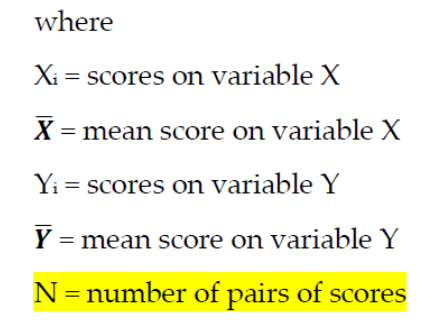
Covariance →
Sxy
It indicates the degree of point variation of two variables with respect to their mean
→ how much one variable moves when the other moves by the same amount.
Covariance → Sxy determines
whether there is dependence between the two variables
Covariance → Sxy is necessary
to estimate the regression line and the linear correlation coefficient.
Interpretation of covariance between X and Y
If sxy > 0
If sxy = 0
If sxy < 0
sxy > 0,
there is a direct (positive) covariance or relation
therefore large values of x correspond to large values of y.
sxy = 0
There is a no linear relation between the two studied variables.
Lacks maximum and minimum values
If sxy < 0
there is an inverse (negative) covariance or relation
Therefore large values of x correspond to small values of y
rxy
Pearson correlation coefficient
Values between -1 and 1
Pearson Correlation Coeficient
Is an index of how close the points on the scattergram fit the best-fitting straight line.
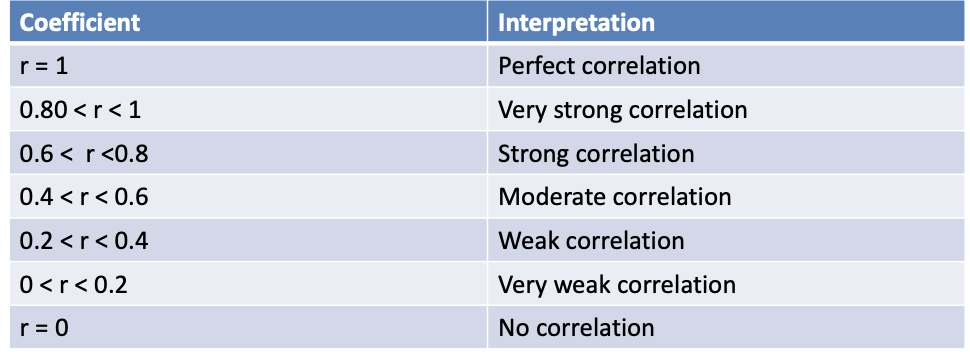
A value near to 1.00 means that the points of the scattergram all lie exactly on the best-fitting straight line, or direct/positive linear relation.
A value of 0.00 means that the points of the scattergram are randomly scattered around the straight line.
To summarize: the closer the relationship between the two variables, the higher is the correlation coefficient, up to a maximum value of 1.00.
value near to 1.00 means that the points
means that the points of the scattergram all lie exactly on the best-fitting straight line, or direct/positive linear relation.
A value of 0.00 means
that the points of the scattergram are randomly scattered around the straight line.
photo which indicates how strong or weak the correlation is
COEFFICIENT OF DETERMINATION:
The percentage of the variance of Y explained by X
rxy2

COEFFICIENT OF DETERMINATION
Is an index of how much variance two variables have in common.
The correlation coefficient is an index of how much variance two variables have in common
Why do we need to square the correlation coefficient?
you need to square the correlation coefficient in order to know precisely how much variance is shared.
The squared correlation coefficient is also known as the coefficient of determination.
A correlation coefficient of 0.64 means
that 64% of the variance is shared.
A correlation coefficient of 1.00 means
100% of the variance is shared.
Some clarifications on the interpretation of the linear correlation coefficient
It is recommended that it be interpreted together with the scatter diagram.
The values it offers have to be interpreted according to the field of study (i.e. intelligence, personality, etc.) therefore relate with the field of study.
Correlation coefficients are not sufficient to establish cause-consequence relationships between variables.
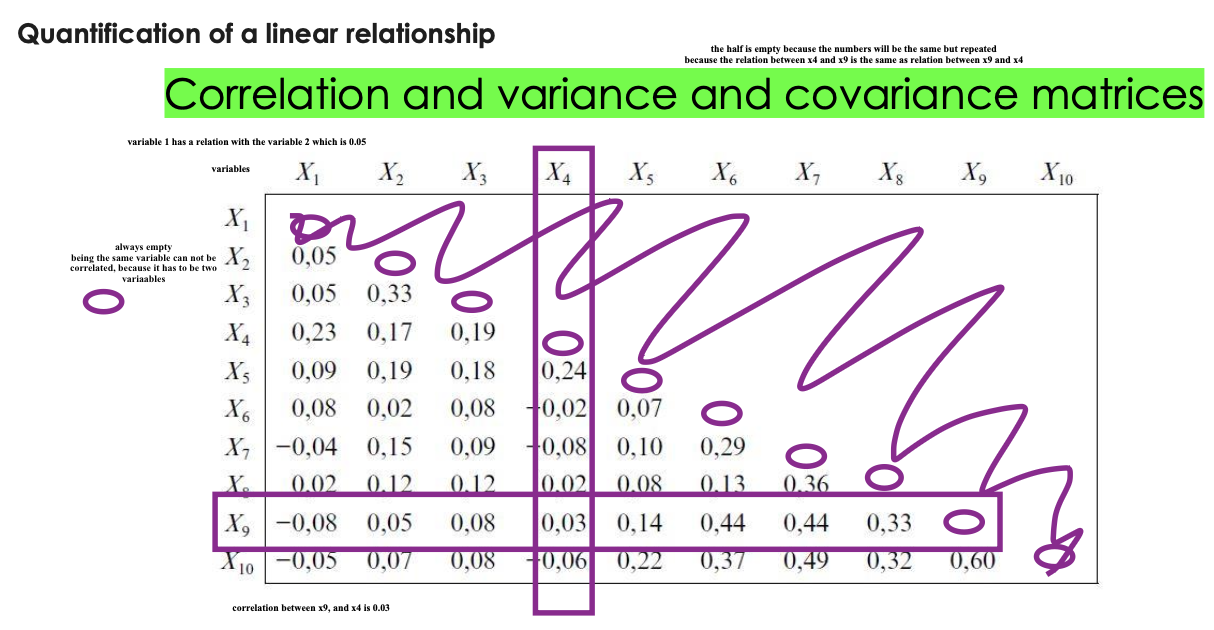
Correlation and variance and covariance matrices
Useful for representing sets of variables and the quantification of their relationships
The correlations/covariances of each variable with itself is always 1 (they do not appear in the matrix because they are redundant information).
The matrix is symmetric with respect to the main diagonal; all values appearing above it are repeated again below it.
The reason is that, necessarily, rxy = ryx
Correlation and variance and covariance matrices (photo)
Interpreting the results

Reporting the results
