STATS Final Exam Flashcards
1/86
There's no tags or description
Looks like no tags are added yet.
Name | Mastery | Learn | Test | Matching | Spaced | Call with Kai |
|---|
No analytics yet
Send a link to your students to track their progress
87 Terms
what are Z-scores ?
they indicate how many standard deviations value is away from the mean
What is the equation for Z-scores?
(x-u)/(standard deviation)
parameter mean
mean value of an entire group under the study (usually over periods of time)
parameter proportion
percentage of population that meets a certain criterion or test (usually whether or not questions)
how do you determine when you can reject H0 ?
value must be less than the a
what are conditions for inference?
sample size must be greater than 30
what does H0 stand for?
null value which states there is no difference between a hypothesized and estimated value.
What does HA stand for?
alternative hypothesis which states that there is a difference between a hypothesized and estimated value.
how big should p have to be have a right skewed graph?
small or <50
how big should p have to be to be left skewed?
large >50
what must you do to the sample size to decrease the margin of error?
increase sample size
whats the Z* for 90%?
1.64
What’s the a for 90%?
0.10
What’s the z* for 95%?
1.96
what’s the a for 95%?
0.05
what’s the z* for 99%?
2.57
what’s the a for 99%?
0.01
what’s a type I error?
when someone fails to reject a true null hypothesis
What’s a type II error?
when someone fails to reject a false hypothesis
68% of population is how many SD’s from the mean?
1
95% of population is how many SD’s from the mean
2
99.7% of population is how many SD’s from the mean
3
how do you find exact successes in a binomial problem?
P(X=k)
How do you find probability “of at least one” in a binomial problem?
1-P(X=0)
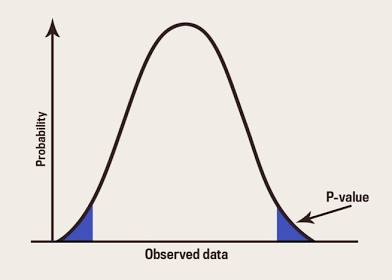
what does p mean?
probability of the shaded area of the graph
What is p head ?
sample proportion
As sample size increases what does standard error do?
decreases
CLT requirements
At least 10 successes and 10 failures
sample size of at least 30
samples must be independent
If you have to assume ME, what value do you use?
0.5
what factors would make the confidence interval narrower?
higher sample size
lower confidence level
how do you know when data provides convicing evidence?
when the p value is less than the significance level
What is a test statistic ?
a number calculated from data, that gives the compatibility with a null hypothesis
what must the z-score be to keep data under one standard deviation?
anything less than one
what must the z-score be for the data to be above average?
positive number
what must the z-score be for the data to be below average?
negative number
what is the equation of a test statistic?
z=(x-u)/SE
Descriptive Statistics
methods of collecting and presenting data
Inferential Statistics
Determining intelligent guesses from populations
Statistic
a number that summarizes the sample data
sample
a subset of units in a population
Parameter
a number that summarizes all of the data of an entire population (average population)
Population
a collection of units that are being studied
Data
collection of numbers, characteristics, images, and other items that provide information about something.
Variable
a characteristic of each individual element of a population.
nominal categorical variable
gender, colors, blood types
ordinal categorical variable
letter grades, education levels, spice levels, class status
discrete numerical variable
something that you can count and the number won’t progress. Ex: #of students in a class, # of dogs in house.
continuous numerical variable
any real numbers between two whole numbers. Ex: peoples height, temperature, age
How do you know if a study’s results can be generalized to a targeted population?
If the sample is randomly selected and representative of the entire population
Which type study can make inferences?
experimental
observational
experimental
stratified sampling
population is divided into non-overlapping subgroups (aka:stratum) that share similar characteristics
cluster sampling
dividing population into non-overlapping subgroups (aka:clusters). Perform a simple random sample then select subgroups.
random sampling
sample is selected randomly from a list with every individual of the population.
multistage sample
randomly select units from inside of a randomly selected cluster.
explanatory variable
cause
response variable
effect
blocking variable
groups experimental units with similar characteristics, so researchers can isolate the effect of the treatment and eliminate the influence of nuisance factors.
How do you calculate IQR?
Q3-Q1
How do you calculate max upper whisker
Q3+1.5xIQR
how do you calculate max lower whicker
Q1-1.5xIQR
what is the shape of the graph is the mean is less than the median?
left skew
what is the shape of the graph is the mean is greater than the median?
right skew
what does it mean to be mutually exclusive?
events that cannot happen at the same time
What is disjoint term also know as?
mutaully exclusive
What is non-disjoint events?
events that can happen at the same time.
how do you find Ac
P(Ac)=1-P(A)
why are mutually exclusive events dependent?
because the occurrence of one event directly affects the probability of the other event
what does x stand for in the calculator?
mean
what does Sx stand for in the calculator?
standard deviation
what does range of IQR equal?
Q1 to Q3
how do I determine if something is independent?
if it is the “cause” in the study
How do I determine if something is dependent?
if it is the “effect” in the study
how do you determine if probability distribution is valid?
if the total adds up to 1
how do I find (AorB)
=P(A)+P(B)-P(AandB)
how do I find (AandB)
=P(A)xP(B)
What does a Xdiff mean?
mean difference
What does Sdiff mean?
standard deviation difference
What is the purpose of paired data?
To find if the average difference is different than 0.
What’s a paired t-test?
uses one sample and compare different data within the same sample
What’s a two sample t-test?
uses two separate samples and compare data
What’s a z/t test?
Comparing means from two groups to see wether they are so far apart that the observed difference cannot reasonably be attributed to sampling variability.
What’s ANOVA?
how do you calculate degree of freedom (df)?
n-1
what does a one-tailed test measure?
greater or less than hypothesis, where the critical values are only on one side of the graph.
how does t* being larger than z* affect the graph?
the graph of t* will be wider because t* has a greater margin of error.
Can we be confident in our observation if the confidence level contains 0?
no
how do I determine if a outlier is an influential point?