HSCI 310 Exam 2
1/139
There's no tags or description
Looks like no tags are added yet.
Name | Mastery | Learn | Test | Matching | Spaced |
|---|
No study sessions yet.
140 Terms
Define statistics
a collection of methods for planning experiments, obtaining data, and then analyzing, interpreting and drawing conclusions based on the data
What relationship does the definition of statistics illustrate?
This definition illustrates the strong link between research methodology and statistics.
What are the two subgroups of statistics?
descriptive and inferential
What does descriptive statistics describe?
Describe large amounts of data in an abbreviated fashion.
Describe important characteristics of your data.
What does inferential use and what does it use this information for?
Uses sample data to draw conclusions and make inferences about a population.
What are the levels of measurement from lowest to highest?
Nominal
Ordinal
Interval
Ratio
What does the level of measurement of a variable determine?
It determines what statistical analyses can be used
What are the two principles used to determine the level of measurement in a variable?
Every variable must have two qualities:
1. Should be able to classify every observation in terms of one or more of its attributes
For example: The concept of sex traditionally has two classifications: males and females
2. Categories or attributes must be mutually exclusive
The variables can be characterized as being discrete or continuous
Discrete = A finite number of distinct values
Continuous = An infinite number of values
Which category is the simplest level of measurement?
Nominal
Nominal level of measurement classifies observations into _____ _____ _____.
mutually exclusive categories
True or false:
In the nominal level, participants are classified or identified according to common characteristics.
true
True or false:
In the nominal level, participants are not graded, ranked, or scaled in any manner
true
True or false:
In the nominal level, quantity is not implied, meaning that no assumptions of magnitude can be implied
true
Is the nominal level discrete or continuous?
discrete
Give an example of nominal level of measurement
genotype
blood type
zip code
gender
race
eye color
political party
Define the ordinal level of measurement
Assigns order to the set of observations
What is the limitation associated with ordinal level of measurement?
The distances between values are not numerically equivalent
No mathematical functions cannot be performed
Give an example of ordinal level of measurement
likert scale
socioeconomic status
rankings
class standing (freshman, sophomore, junior, senior)
letter grades (A, B, C, D)
Is the ordinal level discrete or continuous?
discrete
Define the internal level of measurement
classifies according to the extent to which an individual holds the characteristic
the scale has exact distances between levels
What does the interval level indicate about categories?
it can indicate how much categories differ
What are the limitations of the interval level of measurement?
the scale does not have a non-arbitrary or meaningful zero point, which means direct ratio comparisons are not possible
Give an example of interval level of measurement
pH
temperature
summed or averaged likert scales
Is the interval level discrete or continuous?
continuous
Which category is the highest level of measurement?
ratio
What are the characteristics of the ratio level of measurement?
the scale has order,
a standard unit of measure, and
a meaningful zero point.
Give an example of ratio level of measurement
Salary
Number of children
Height
Distance traveled
Amount of money in your bank account
True of false:
Descriptive statistics provide abbreviated summaries of large data sets and describes important characteristics
true
What are the four broad categories of descriptive statistics
1. Tables & Graphs of data/Summaries of Data
2. Measures of Central Tendency
3. Measures of Dispersion or Variation
4. Measures of Position
What is the ultimate form of descriptive statistics?
graphs
What is a frequency table?
A frequency table is a list of all values found in the variable with the corresponding frequency.
What are the types of measures of central tendency?
Mode
Median
Mean
What do measures of central tendency describe?
These statistics describe the central scores in the data.
Define mode
numerical midpoint of the interval that contains the highest frequency of observations
What are the advantages of using mode?
Easy to obtain
Used for statistical procedures with nominal data
Define median
point at which 50% of the scores sit above and below
What is the advantage of using median?
Insensitive to extreme scores
What is the most fundamental concept in statistical analyses using continuous data?
mean
What is the building block for inferential statistics?
mean
What is the advantage of using mean?
Every value in the observation is considered
What does variability refer to?
Variability refers to the degree of dispersion or differences among scores
Variability informs how the scores vary about the _____.
mean
What are the types of measures of variability?
Range
Variance
Standard deviation
Define range
the difference between the highest and lowest number in a set
What do standard deviation and variance measure?
They measure the variability among the scores about the mean.
Define variance
Variance is the average of the sum of squares
True or false:
Standard deviation measures in the unit of measure of the variable
true
What is the sum of squares principle?
The sum of the squared values represents the smallest possible value of variability that can be found in this data set using this deviation approach.
How do you calculate variance?
1. Sum the squared differences
2. Divide by n-1
What is the unit for variance
unit of measure squared
What is the variance equation?
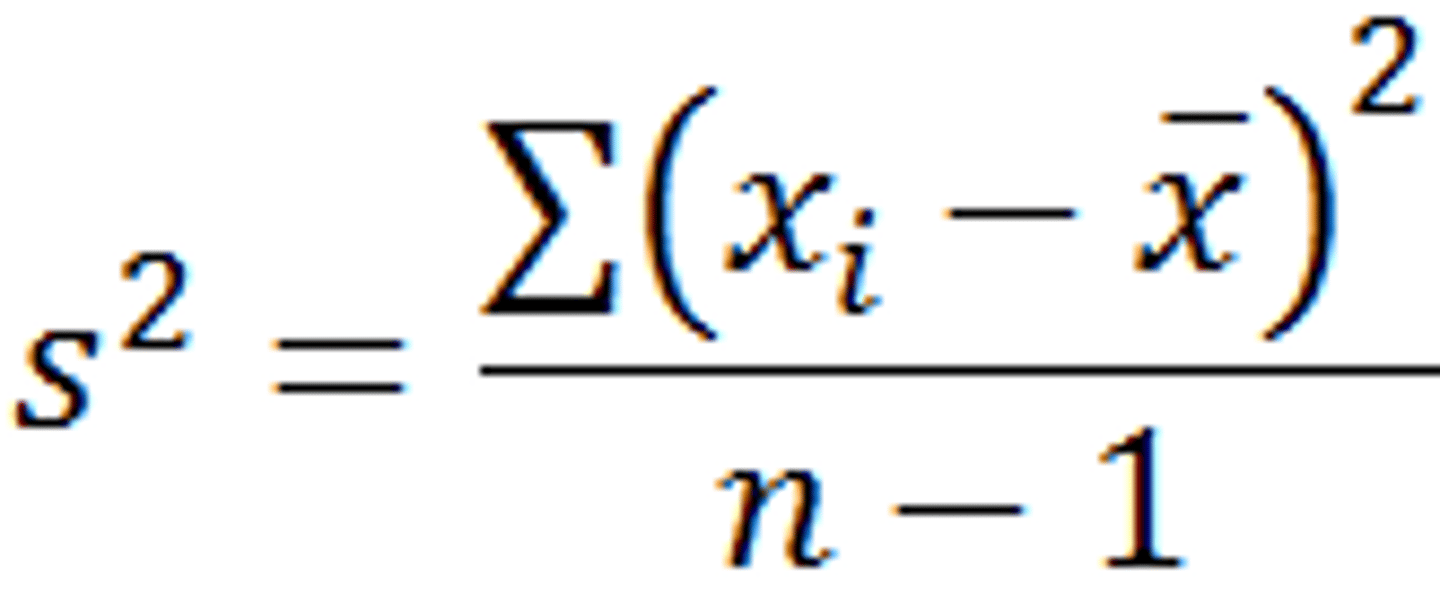
How do you convert variance to standard deviation?
take the square root of the variance
What are the characteristics of a normal distribution?
Symmetric
Asymptotic
Area under curve = 1.0
Area equals probability
What does normal distribution tell us?
approximately 68% of all scores will fall within (+/-) 1 SD of the mean
approximately 95% of all scores will fall within (+/-) 2SD of the mean
approximately 99% of all scores will fall within (+/-) 3 SD of the mean
What are measures of position used to describe?
Measures of position are used to describe how scores fall in relationship to one another.
What is important when comparing data across different groups or samples?
do not compare raw scores directly
What do percentiles tell you?
Percentiles tell you how a value compares to other values.
What are the types of standardized scores?
z-score
T-score
What are standardized scores?
a way of representing data in a standardized format when we take away the values of mean and standard deviation. i.e., we standardize so that both data sets have the same value for mean and standard deviation
What are the characteristics of z-scores?
are unitless
have a mean of 0 and a standard deviation of 1.0
represents the number of standard deviations a score is from the mean
What is the z-score equation?

When score (X) is greater than the mean (M), the z-score is
positive (+)
When score (X) is less than the mean (M), the z-score is
negative (-)
When score (X) is equal to the mean (M), the z-score is
0
What are the types of hypotheses?
statistical (H0)
substantive (H1,2,3...)
What is another name for statistical hypotheses?
null hypothesis
What kind of terminology/jargon do statistical hypotheses use?
It uses statistical jargon
Statistical hypotheses are written in a way where ___ ______ are expected.
no differences
Who makes a substantive hypothesis and what are substantive hypotheses based on?
Researchers' hypothesis based on previous data
This is usually phrased in a directional way based on the previous literature
True or false:
Substantive hypotheses are included in journal articles
true
True or false:
Substantive hypotheses do not include statistical jargon
true
What does the substantive hypothesis include?
1. the direction
2. the dependent variable
3. all conditions of the independent variable
4. the participants
What would the statistical hypothesis (H0) be in this example?
Is eccentric exercise more effective than eStim at recovering hamstring injury? The average recovery time for eStim is 10 days.
H0 = No statistical difference in recovery time will exist between eccentric exercise and eStim
H0: Μ = 10
What would the substantive hypothesis (H1,2,3,...) be in this example?
Is eccentric exercise more effective than eStim at recovering hamstring injury? The average recovery time for eStim is 10 days.
H1: Eccentric exercise will improve recovery time when compared to eStim
H1: M < 10
What are the general 4 steps in hypothesis testing?
Step 1: State the hypotheses
Step 2: Select the statistical test and the alpha level.
Step 3: Calculate the test statistic and the significance level
Step 4: Make your decision by interpreting the significance level of your test and comparing it your predetermined alpha value.
Describe the first step in hypothesis testing
Step 1: State the hypotheses
Hypotheses need to include direction, participants, independent variables, dependent variables, and statistical jargon (e.g., correlation, mean difference, etc.)
Describe the second step in hypothesis testing
Step 2. Select the statistical test and the alpha level.
The selection of the statistical test is dependent upon the research question and the research design.
What is the alpha level?
The error rate is associated with the mistake of rejecting the null hypothesis, when in fact the null hypothesis is true.
What are the types of alpha level errors
Type I and Type II
What is the mistake of the Type I error
the mistake of stating that differences exist, when in fact they do not.
What is the mistake of the Type II error
failing to reject the null hypothesis when it's in fact false.
Why do we have an error rate? Why are we not certain of our decision?
Remember, in inferential statistics, we use samples to draw conclusions and make inferences about populations.
Thus, we are making conclusions and decisions about a population that we have not tested.
As a result, some error always exists in our decision-making process.
This is why we say research never proves anything!!!!!!
What is the most common alpha level that researchers use?
.05
What does an alpha level of .05 mean?
An alpha level of .05 means that the researcher has a 5% chance of rejecting the null hypothesis when it is true.
Name the 4 common alpha levels and what kind of studies they are used for
0.10 - pilot studies
0.05 -- most utilized
0.01 -- laboratory researcher with stricter scientific controls
0.001 -- medical research
Significance values can be ___-tailed or ___-tailed.
one-tailed or two-tailed
Alpha level determines acceptable probability of which type of error?
Type I error
What are significance values referred to in literature?
p values
Anytime you have the sig. value or p value _____ , you will have a significant finding.
< 0.05
When your sig. value is _____ , then you have a non-significant finding
> 0.05
Describe step 3 of hypothesis testing
Step 3: Calculate the test statistic and the significance level
Plot the statistics against the critical value
The critical value is considered the cut-off point on the distribution
That is, any value past the critical value in any direction, we would say is a significant differences
Describe step 4 of hypothesis testing
Step 4: Make your decision by interpreting the significance level of your test and comparing it your predetermined alpha value.
P ≥ 0.05 = accept null
P < 0.05 = reject null
Is the correlation coefficient (r) quantitative or qualitative?
quantitative
What is the range of correlation?
-1.0 to 1.0
What is the range for positive correlation?
0.01 to 1.0
What is the range for negative correlation?
-0.01 to -1.0
What are examples of positive correlation?
The more time you spend running on a treadmill, the more calories you will burn.
The longer your hair grows, the more shampoo you will need.
The more money you save, the more financially secure you feel.
As the temperature goes up, ice cream sales also go up.
What are examples of negative correlation?
A student who has many absences has a decrease in grades.
The more one works, the less free time one has.
As one increases in age, often one's agility decreases.
If a car decreases speed, travel time to a destination increases.
What are the degrees of correlations (low, moderate, high)?
High: ± 0.50 - 1.00
Moderate: ± .30 - 0.49
Low: ± 0.29 and below
What does correlational research investigate?
Whether two characteristics vary in the same way
Strength of relationship between two or more characteristics