Correlations
1/19
There's no tags or description
Looks like no tags are added yet.
Name | Mastery | Learn | Test | Matching | Spaced |
|---|
No study sessions yet.
20 Terms
What is correlation stats?
a stats measure that describes the strength and direction of a relationship between two numerical variables
What’s the difference between correlation and chi square tests?
Chi-square tests association between two categorical variables while correlation tests the relationship between two contiunous variables
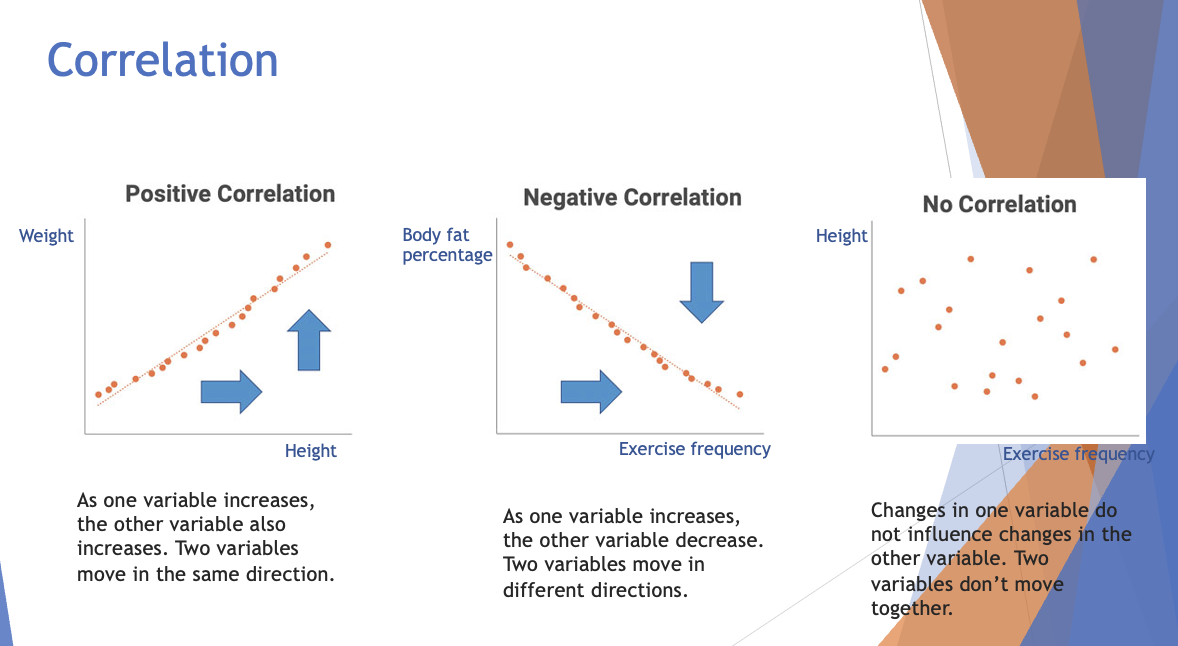
What is correlation?
changes in one variable are associated with changes in another variable ==> so these variables move together
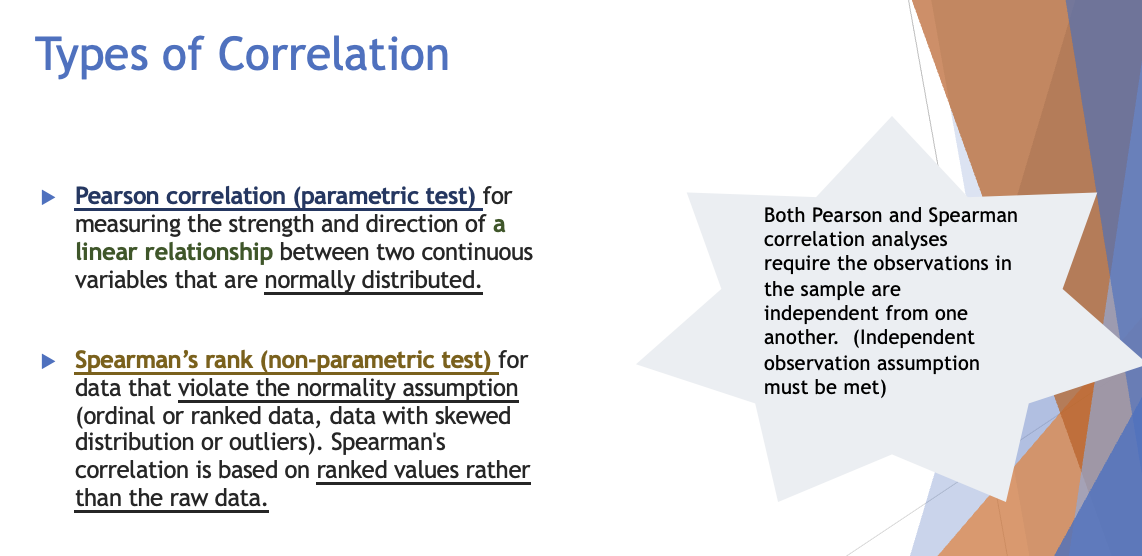
What are the two types of correlation?
Pearson Correlation ==> a parametric test for measuring strength and direction of a linear relationship between two continuous variables that are normally distributed
Spearman’s Rank ==> non parametric test for data that violates the normality assumption and instead has skewed, ordinal or ranked data. Spearman’s correlation is based on ranked values rather than raw data
When would we use Pearson correlation?
when the relationship between two variables is linear
uBoth variables are measured on a continuous scale (interval or ratio data).
uNormality: the data are normally distributed (or approximately so) for each variable.
Homoscedasticity: the variance of one variable is consistent across the range of the other variable
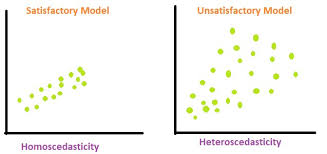
What is homoscedasticity?
Homoscedasticity is an assumption about the consistency of the variance (the spread of data) across all levels or values of your variables
so all points of data are around the same
What is the test statistic for Pearson correlation?
uPearson correlation coefficient: r
When do we use spearman’s rank correlation?
data is ordinal or interval or ratio ==> they don’t require normality or equal variance
assumptions of Pearson correlation are violated
it’s less sensitive to outliers
What is the test statistic for spearman’s rank?
uSpearman’s rank coefficient: 𝞺 (the Greek letter rho)
How do we decide if a correlation is strong?
The closer to 1 or -1, the stronger/weaker it is
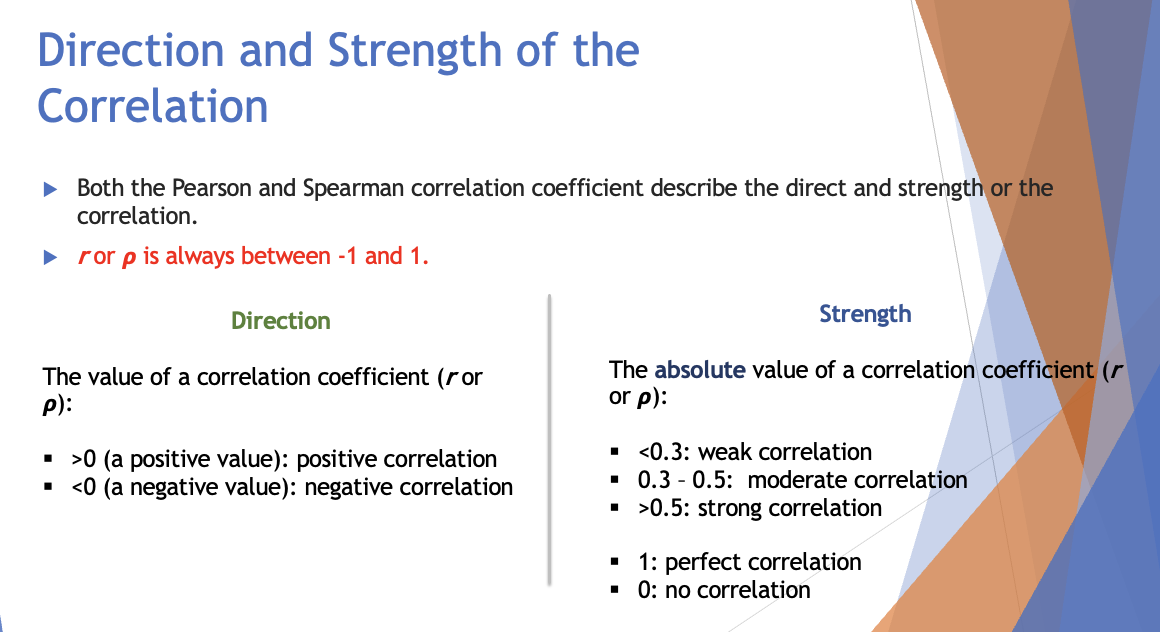
How do we sense direction for a correlation?
if r or p (correlation coefficients) are:
> 0 : positive
< 0: negative
ur or 𝞺 is always between -1 and 1.
What is deemed a weak correlation?
The absolute value of a correlation coefficient (r or 𝞺):
take away any positive or negative signs and JUST look at the #
<0.3: weak correlation
0.3 – 0.5: moderate correlation
>0.5: strong correlation
A larger correlation coefficient doesn’t mean the result has __________
statistical significance
you need a hypothesis test and check P-value for that
What is the different hypothesis for a correlation?
Null Hypothesis (H0)
r (or ρ) = 0 in the population, there is no correlation between the two variables in the population.
Alternative Hypothesis (Ha)
•For a two-tailed test
r (or ρ) ≠ 0 for a two-tailed test (any correlation, positive or negative).
•For a one-tailed test:
r (or ρ) >0 (positive correlation)
r (or ρ) <0 (negative correlation) ==> when one variable goes up, the other goes down
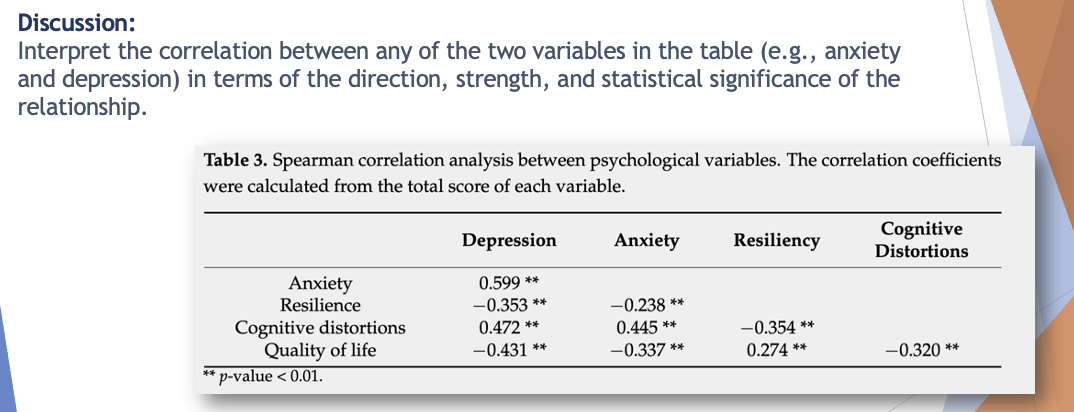
What is the significance marker?
Significance Marker: $**$
Interpretation: The double asterisk ($**$) indicates that the $p$-value for this correlation is less than $0.01$ ($p < 0.01$).
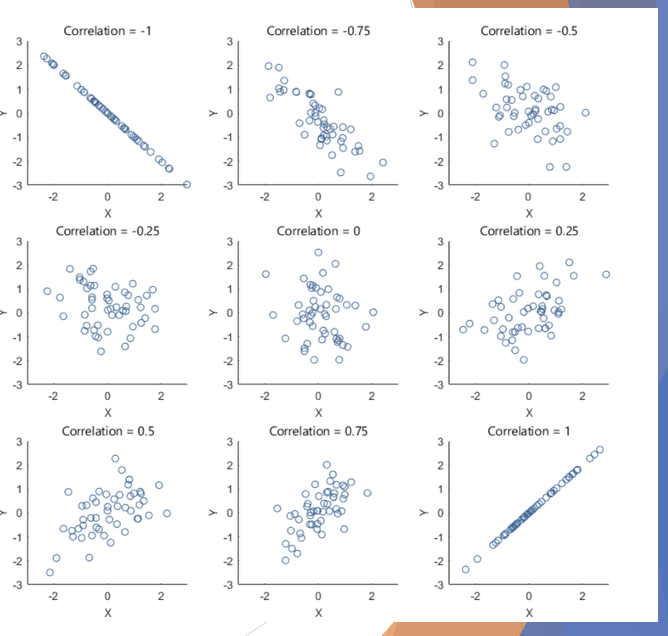
How do we interpret scatterplots and correlation?
Direction: Look at the trend of the points
Strength: Look at how closely the points cluster around a straight line
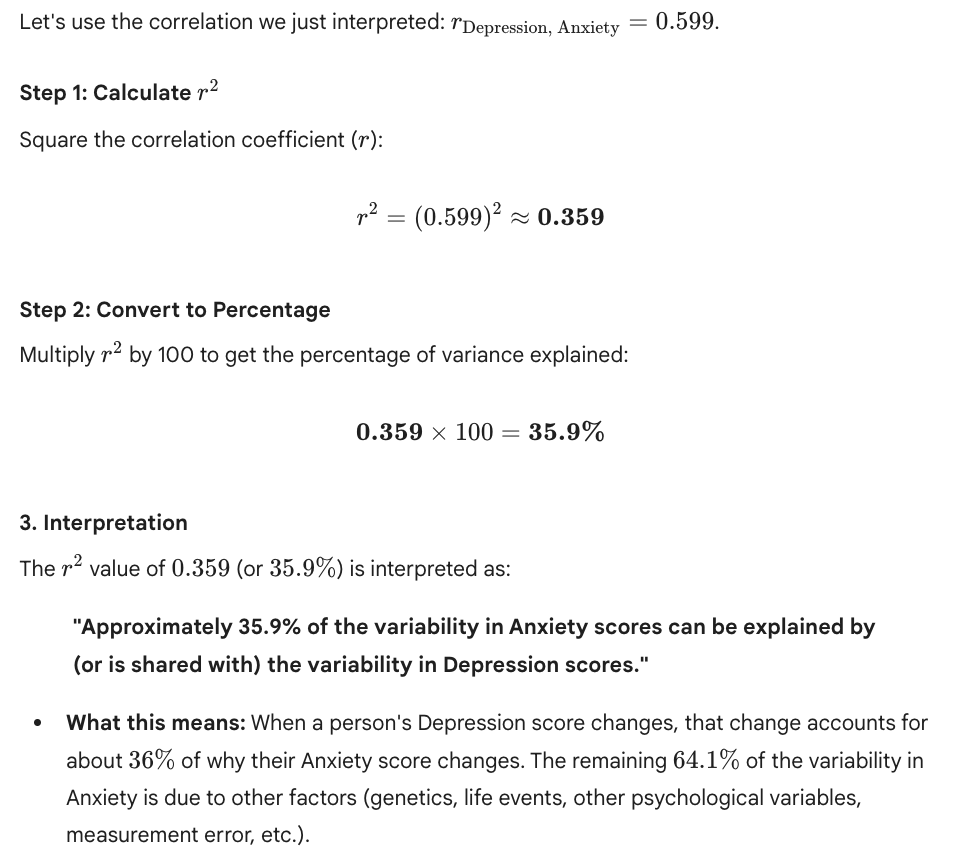
When you square the pearson coefficient (r) it becomes?
r2 = the coefficient of determination
uA measure of how much of the variability in one variable can be explained by the relationship with the other variable.
If you then multiply it by 100, it tells you something called the percentage of variance
u% of variance of one variable that is explained by the other variable.
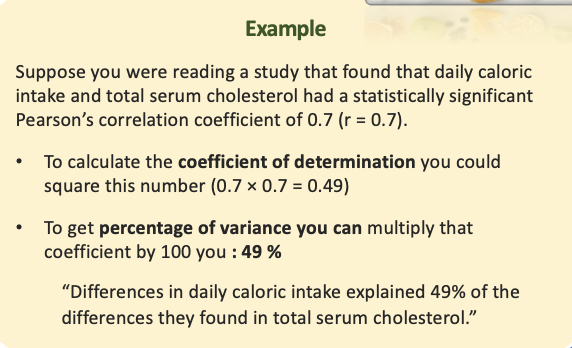
An example of percentage of variance:
telling us how much of one variable shift is accounted for by the second variable and that the rest of the shift is due to different factors
"How much of the total change (variability/shift) in one variable is accounted for (explained by) the corresponding change in the second variable, and that the remaining percentage is due to all other external or unmeasured factors."
What is hill’s causal criteria?
Hill's Causal Criteria (often referred to as the Bradford Hill Criteria) are a set of nine guidelines used in epidemiology to help determine if there is a causal relationship between a potential cause (like a pollutant or a behavior) and an observed effect (like a disease).
What are the nine points of hill’s causal criteria?
Temporality: ==> cause must precede effect (uSmoking habits must be established before the onset of lung cancer to claim a causal link.)
Strong association = makes causation more likely
Dose-Response Relationship
uIncreasing exposure leads to a greater effect. more junk food = higher risk of HF
Consistency ==> multiple studies
uThe association is observed repeatedly in different studies, populations, and settings.
Experiment ==> shows cause & effect
Analogy/Similarities uSimilar causal relationships exist, which strengthens the argument for causation
uE.g.,: If other environmental toxins are known to cause cancer, it is more plausible that tobacco, another environmental toxin, does the same.
Plausibility ==> it makes scientific sense
uE.g., The mechanism by which smoking causes damage to lung tissue is well understood.
Coherence ==> The association is consistent with existing knowledge
Specificity
uThe effect is specific to a particular cause and not explained by other factors.