Statistics
1/20
Name | Mastery | Learn | Test | Matching | Spaced | Call with Kai |
|---|
No analytics yet
Send a link to your students to track their progress
21 Terms
With continuous data, you will usually end up with a ____ shaped curve
Bell
What is standard deviation?
A measure of the spread of data around the mean
The higher the stabdaed deviation, the ____ the spread of data around the mean
Greater
± 2 standard deviations from the mean will always include __% of the data
95
Why is standard deviation better than range?
SD is less affected by anomalies than range
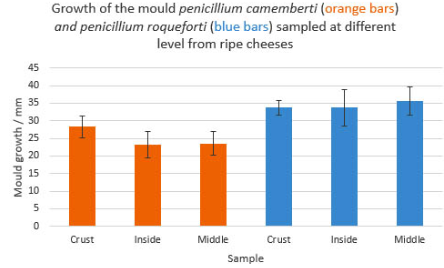
Is there a significant difference in the mean growth of penicillium camemberti mould between the crust and the inside? Why/why not?
There is not a significant difference between the mean growth of penicillium camemberti mould between the crust and the inside because they overlap.

Is there a significant difference in the mean growth of penicillium camemberti mould in the middle of the cheese and penicillium roqueforti mould in the middle of the cheese? Why/why not?
There is a significant difference between the growth of penicillium camemberti and penicillium roqueforti in the middle of the cheeses because they don’t overlap.
Which test is used to evaluate the signifcance between two means?
T-test
Which test tells us if the probablility that the difference between expected frequencies is down to chance or not?
Chi squared/ X2
Which test is used to see if the probability a correlation is down to chance or not?
Spearman’s rank
Write a general null hypothesis for a t-test
There is no significant difference between the means of two sets of data
Write a general null hypothesis for a X2 test?
There is no significant difference between expected and observed frequencies
Write a general null hypothesis for a spearman’s rank
There is no correlation between two variables
How do you calculate degrees of freedom for a t-test?
(number of values in data set 1 - 1) + (number of values in data set 2 - 1)
How do you calculate degrees of freedom for a X² test?
Number of categories - 1
How do you calculate degrees of freedom for a spearman’s rank test?
Number of pairs of values - 2
In a t-test, is a significance level of more than 5% significant or not significant?
Not significant
How to write a conclusion using the results from a statistical test?
Compare the test result with the critical value
State whether the probablilty/correlation/difference (between means/expected and observed frequencies) is down to chance is </> 5%
State whether the correlation is significant or not
State whether to accept or reject the null hypothesis
Choose a stats test: Is there a correlation between the number of species found in rock pools and their height above sea level?
Spearman’s rank
Choose a stats test: Is the mean height of boys in the 6th form significantly greater than the mean height of girls?
T-test
Choose a stats test: Woodlice placed in a choice chamber moved into different environments. The results are shown in the diagram below. Do the woodlice show a preference for a particular environment?
X²