6 - Metabolism and Pathways
1/134
Earn XP
Description and Tags
Proverbs 16:3
Name | Mastery | Learn | Test | Matching | Spaced | Call with Kai | Chat |
|---|
No analytics yet
Send a link to your students to track their progress
135 Terms
c. Metabolism
Sum of all chemical processes in the body
a. Catabolism
b. Anabolism
c. Metabolism
d. Homeostasis
a. True
Metabolism is broken down into pathways
a. True
b. False
a. True
A pathway usually has an irreversible step(s) to direct a pathway to its goal/end product
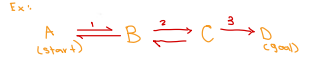
a. True
b. False
c. Rate-limiting step / Rate determining step
The term _____ is reserved for the irreversible, slowest step that dictates whether the pathway proceeds or stops."
a. Start button
b. Limiting step
c. Rate-limiting step
d. Committed step
c. ATP
Most common energy currency
a. GTP
b. NADH
c. ATP
d. FADH₂
a. True
ATP has 2 high energy
a. True
b. False
d. 2.5 ATP
NADH ("reduced NAD") is equivalent to ______
a. 1 ATP
b. 1.5 ATP
c. 2 ATP
d. 2.5 ATP
b. 1.5 ATP
FADH₂ ("reduced FAD") is equivalent to _____
a. 1 ATP
b. 1.5 ATP
c. 2 ATP
d. 2.5 ATP
b. 1 ATP
Other triphosphates (ex. GTP) are equivalent to ____
a. 0.5 ATP
b. 1 ATP
c. 1.5 ATP
d. 2 ATP
a. Anabolic
Builds up and uses energy
a. Anabolic
b. Catabolic
b. Catabolic
Breaks down and produces energy
a. Anabolic
b. Catabolic
a. Reduction
Removal of O
a. Reduction
b. Hydrolysis
c. Oxidation
d. Phosphorylation
d. Reduction
Addition of H
a. Oxidation
b. Hydrolysis
c. Phosphorylation
d. Reduction
c. Cell respiration
Process summarized by the equation C₆H₁₂O₆ + 6O₂ → 6CO₂ + 6H₂O + ATP
a. Photosynthesis
b. Glycolysis
c. Cell respiration
d. Fermentation
b. Cellular respiration
Starts with sugar and end in CO2`
a. Photosynthesis
b. Cellular respiration
c. Aerobic
Cellular respiration is classified as ______
a. Anaerobic
b. Fermentative
c. Aerobic
d. Photolytic
a. Photosynthesis
Starts with CO2 and end in sugar
a. Photosynthesis
b. Cellular respiration
Glycolysis
Fates of pyruvate
Citric acid cycle
Oxidative phosphorylation
Stages of Cellular Respiration [4]
d. Embden-Meyerhof Pathway
Glycolysis is also known as _______
a. Cori cycle
b. Krebs cycle
c. HMP shunt
d. Embden-Meyerhof Pathway
a. Glycolysis
Breakdown of glucose to two molecules of pyruvate
a. Glycolysis
b. Fates of pyruvate
c. Citric acid cycle
d. Oxidative phosphorylation
Energy investment (steps 1-5)
Energy payoff (steps 6-10)
[GLYCOLYSIS]
Glycolysis consists of two phases such as _____ [2]
a. 1-5
[GLYCOLYSIS]
Energy investment phase of glycolysis covers steps
a. 1-5
b. 6-10
c. 1-10
d. 5-10
c. 6-10
[GLYCOLYSIS]
Energy payoff phase of glycolysis covers steps
a. 1-5
b. 1-10
c. 6-10
d. 5-9
c. Cytosol
[GLYCOLYSIS]
Cellular site of glycolysis
a. Mitochondria
b. Nucleus
c. Cytosol
d. Endoplasmic reticulum
c. Insulin
[GLYCOLYSIS]
Glycolysis is stimulated by this _____ , indicating it happens in the fed state
a. Glucagon
b. Cortisol
c. Insulin
d. Epinephrine
a. Fed state
[GLYCOLYSIS]
Glycolysis is stimulated by INSULIN , indicating it happens in the ______
a. Fed state
b. Fasted state
c. Starved state
d. Stressed state
c. Phosphofructokinase (PFK)
[GLYCOLYSIS]
Rate-limiting enzyme of glycolysis
a. Hexokinase
b. Pyruvate kinase
c. Phosphofructokinase (PFK)
d. Aldolase
-synthesis
-genesis
[GLYCOLYSIS]
Suffix clue word indicating an anabolic process [2]
-lysis
[GLYCOLYSIS]
Suffix clue word indicating a catabolic process [1]
c. Kinase

[GLYCOLYSIS - DIAGRAM]
Transfers PO4
a. Isomerase
b. Mutase
c. Kinase
d. Aldolase
b. Isomerase

[GLYCOLYSIS - DIAGRAM]
Catalyzes "automatic functional isomer" conversion
a. Kinase
b. Isomerase
c. Aldolase
d. Mutase
d. Aldolase

[GLYCOLYSIS - DIAGRAM]
Splits into products
a. Isomerase
b. Kinase
c. Mutase
d. Aldolase
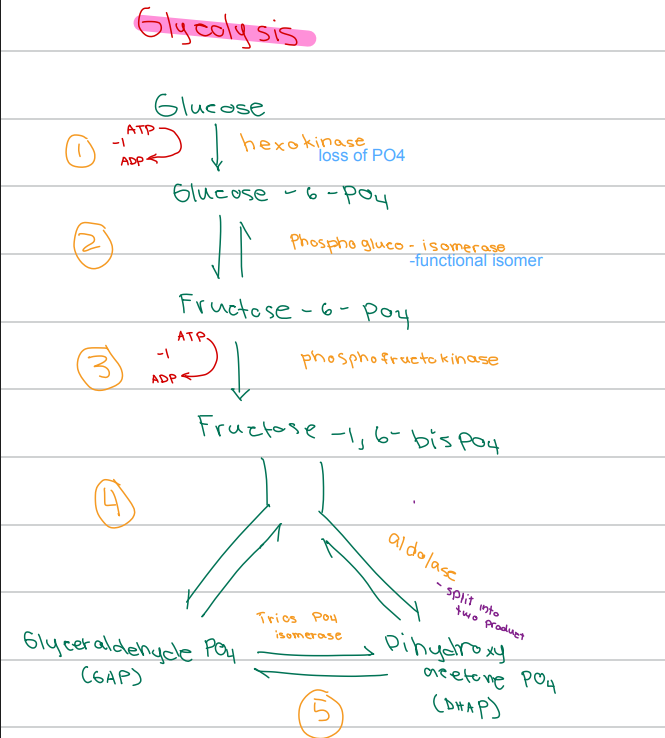
c. GAP and DHAP

[GLYCOLYSIS - DIAGRAM]
______ are referred to as trioses since they are split by aldolase enzyme into two
a. Pentoses
b. Tetroses
c. GAP and DHAP
d. Fructose-1,6-bisphosphate and Glucose-6-phosphate
c. Trioses

[GLYCOLYSIS - DIAGRAM]
GAP and DHAP are referred as ________ this since they are split by aldolase enzyme into two
a. Hexoses
b. Pentoses
c. Trioses
d. Tetroses
b. Hexokinase

[GLYCOLYSIS - DIAGRAM]
Enzyme catalyzing Glucose → Glucose-6-PO4
a. Phosphofructokinase
b. Hexokinase
c. Phosphoglucose isomerase
d. Aldolase
c. Phosphoglucose isomerase

[GLYCOLYSIS - DIAGRAM]
Enzyme catalyzing Glucose-6-PO4 → Fructose-6-PO4
a. Hexokinase
b. Phosphofructokinase
c. Phosphoglucose isomerase
d. Triose phosphate isomerase
d. Phosphofructokinase

[GLYCOLYSIS - DIAGRAM]
Enzyme catalyzing Fructose-6-PO4 → Fructose-1,6-bisPO4
a. Hexokinase
b. Aldolase
c. Phosphoglucose isomerase
d. Phosphofructokinase
b. Aldolase

[GLYCOLYSIS - DIAGRAM]
Enzyme that splits:
Fructose-1,6-bisPO4 → Glyceraldehyde-PO4 (GAP) and Dihydroxyacetone PO4 (DHAP)
a. Phosphofructokinase
b. Aldolase
c. Triose phosphate isomerase
d. Enolase
c. Triose phosphate isomerase

[GLYCOLYSIS - DIAGRAM]
Enzyme catalyzing the interconversion of Glyceraldehyde-PO4 (GAP)and Dihydroxyacetone PO4 (DHAP)
a. Aldolase
b. Phosphoglycerate mutase
c. Triose phosphate isomerase
d. GAP dehydrogenase
b. 2 ATP
[GLYCOLYSIS - DIAGRAM]
Total ATP used in glycolysis
a. 1 ATP
b. 2 ATP
c. 3 ATP
d. 4 ATP
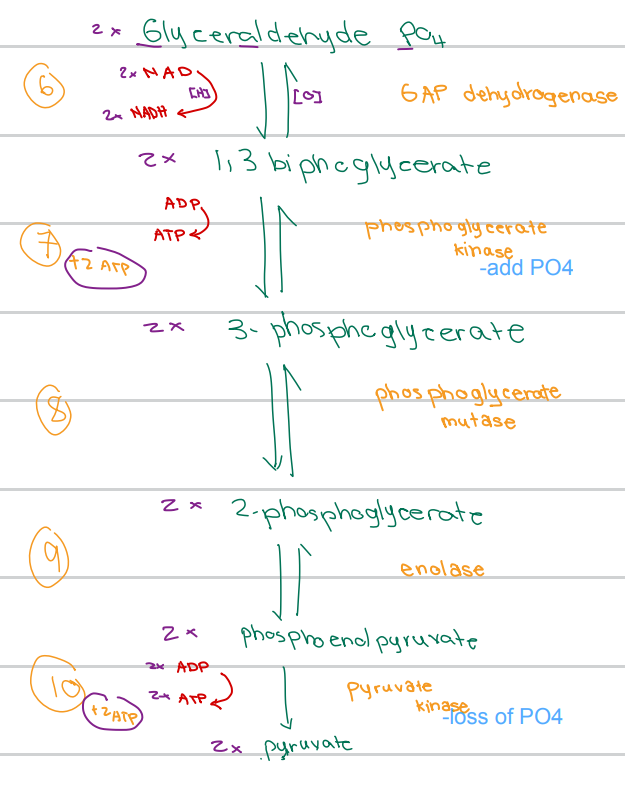
b. GAP dehydrogenase

[GLYCOLYSIS - DIAGRAM]
Enzyme catalyzing Glyceraldehyde-PO4 (GAP) → 1,3-bisphosphoglycerate
a. Phosphoglycerate kinase
b. GAP dehydrogenase
c. Phosphoglycerate mutase
d. Enolase
d. Oxidation

[GLYCOLYSIS - DIAGRAM]
Dehydrogenation is equivalent to _______
a. Reduction
b. Hydrolysis
c. Phosphorylation
d. Oxidation
c. Phosphoglycerate kinase
[GLYCOLYSIS - DIAGRAM]
Enzyme catalyzing 1,3-bisphosphoglycerate → 3-phosphoglycerate
a. Pyruvate kinase
b. Phosphoglycerate mutase
c. Phosphoglycerate kinase
d. Enolase
b. Phosphoglycerate kinase

[GLYCOLYSIS - DIAGRAM]
Add PO4
a. Pyruvate kinase
b. Phosphoglycerate kinase
c. Phosphoglycerate mutase
d. Enolase
c. Pyruvate kinase

Loss of PO4
a. Phosphoglycerate kinase
b. Phosphoglycerate mutase
c. Pyruvate kinase
d. Enolase
c. Phosphoglycerate mutase

[GLYCOLYSIS - DIAGRAM]
Enzyme catalyzing 3-phosphoglycerate → 2-phosphoglycerate
a. Enolase
b. Phosphoglycerate kinase
c. Phosphoglycerate mutase
d. Pyruvate kinase
b. Enolase

[GLYCOLYSIS - DIAGRAM]
Enzyme catalyzing 2-phosphoglycerate → phosphoenolpyruvate
a. Phosphoglycerate mutase
b. Enolase
c. Pyruvate kinase
d. Phosphoglycerate kinase
d. Pyruvate kinase

[GLYCOLYSIS - DIAGRAM]
Enzyme catalyzing phosphoenolpyruvate → pyruvate
a. Enolase
b. Phosphoglycerate kinase
c. Phosphoglycerate mutase
d. Pyruvate kinase
b. 2 ATP/glucose

[GLYCOLYSIS - DIAGRAM]
Glycolysis net ATP yield
a. 1 ATP/glucose
b. 2 ATP/glucose
c. 3 ATP/glucose
d. 4 ATP/glucose
c. Substrate-level phosphorylation

Type of phosphorylation occurring at steps 7 and 10, the steps that synthesize ATP
a. Oxidative phosphorylation
b. Chemiosmotic phosphorylation
c. Substrate-level phosphorylation
d. Photophosphorylation
1,3,10
Hexokinase (hk)
Phosphofructokinase (pfk)
Pyruvate kinase (pk)
Irreversible steps of glycolysis [3]
d. Decreases blood sugar
Effect of glycolysis on blood sugar
a. Increases blood sugar
b. No effect on blood sugar
c. Stabilizes blood sugar
d. Decreases blood sugar
c. Insulin
[Effect of Glycolysis on Blood Sugar]
Stimulates glycolysis
Decreases blood sugar
a. Glucagon
b. Cortisol
c. Insulin
d. Epinephrine
d. Glucagon
[Effect of Glycolysis on Blood Sugar]
Inhibits glycolysis
Increases blood sugar
a. Glucagon
b. Cortisol
c. Insulin
d. Epinephrine
c. Insulin
[Effect of Glycolysis on Blood Sugar]
Fed state
a. Glucagon
b. Cortisol
c. Insulin
d. Epinephrine
d. Glucagon
[Effect of Glycolysis on Blood Sugar]
Fasted state
a. Insulin
b. Epinephrine
c. Cortisol
d. Glucagon
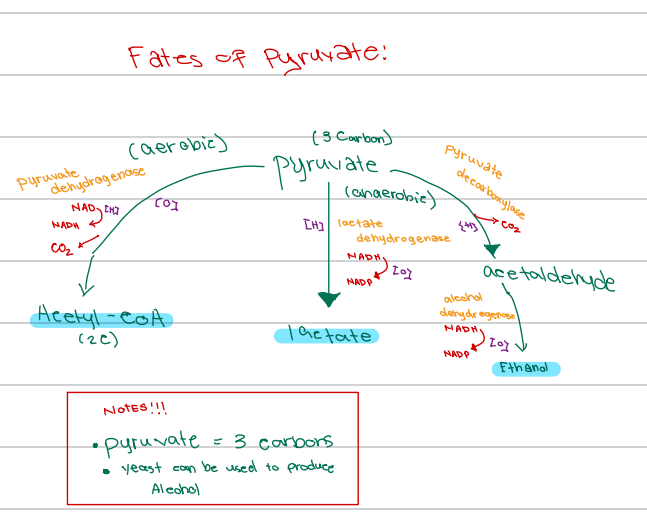
b. 3 carbons

[Fates of Pyruvate]
Number of carbons in pyruvate
a. 2 carbons
b. 3 carbons
c. 4 carbons
d. 6 carbons
d. Acetyl-CoA

[Fates of Pyruvate]
Under aerobic conditions (mitochondrial), pyruvate is oxidized to
a. Lactate
b. Ethanol
c. Oxaloacetate
d. Acetyl-CoA
a. 2 carbons

Number of carbons in acetyl-CoA
a. 2 carbons
b. 3 carbons
c. 4 carbons
d. 5 carbons
c. Pyruvate dehydrogenase (PDH)

[Fates of Pyruvate]
Enzyme that catalyzes the oxidation of pyruvate → acetyl-CoA under aerobic conditions
a. Lactate dehydrogenase (LDH)
b. Pyruvate decarboxylase
c. Pyruvate dehydrogenase (PDH)
d. Alcohol dehydrogenase
c. Lactate

[Fates of Pyruvate]
Under anaerobic conditions (cytosolic), pyruvate is reduced to
a. Ethanol
b. Acetyl-CoA
c. Lactate
d. Acetaldehyde
b. Lactate dehydrogenase (LDH)
[Fates of Pyruvate]
Enzyme that catalyzes the reduction of pyruvate → lactate under anaerobic conditions
a. Pyruvate dehydrogenase (PDH)
b. Lactate dehydrogenase (LDH)
c. Pyruvate decarboxylase
d. Alcohol dehydrogenase
d. Ethanol

[Fates of Pyruvate]
Under anaerobic conditions in yeast (cytosolic), pyruvate is converted to _________
a. Lactate
b. Acetyl-CoA
c. Acetaldehyde
d. Ethanol
b. Pyruvate decarboxylase

[Fates of Pyruvate]
Enzyme that converts pyruvate → acetaldehyde during anaerobic conditions in yeast
a. Lactate dehydrogenase
b. Pyruvate decarboxylase
c. Alcohol dehydrogenase
d. Pyruvate dehydrogenase
c. Alcohol dehydrogenase

[Fates of Pyruvate]
Enzyme that follows pyruvate decarboxylase to convert acetaldehyde → ethanol in yeast
a. Pyruvate dehydrogenase
b. Lactate dehydrogenase
c. Alcohol dehydrogenase
d. Aldolase
b. Yeast

[Fates of Pyruvate]
This organism can be used to produce alcohol from pyruvate
a. Bacteria
b. Yeast
c. Fungi
d. Virus
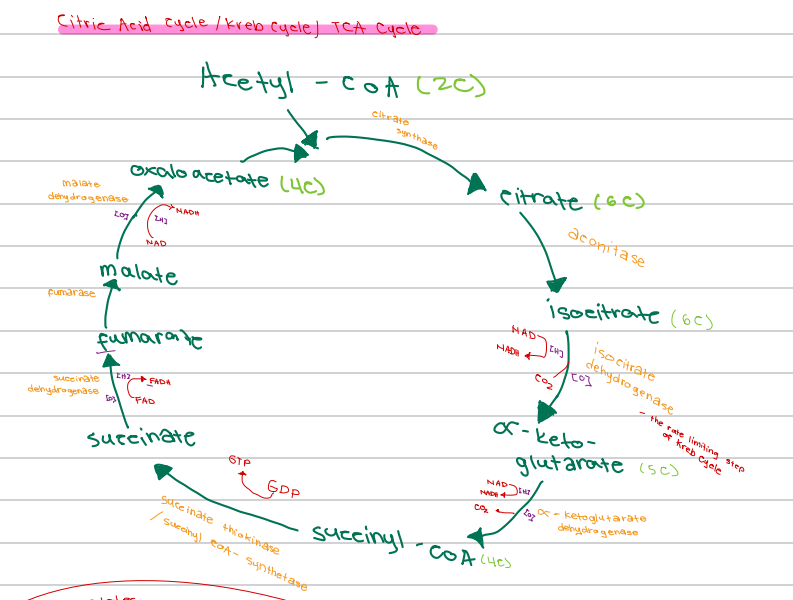
Kreb’s Cycle
Tricarboxylic acid (TCA) cycle
[CITRIC ACID CYCLE]
The citric acid cycle is also known as _____ [2]
b. Citric acid cycle
Converts acetyl-CoA to two molecules of CO₂
a. Glycolysis
b. Citric acid cycle
c. Pentose phosphate pathway
d. Gluconeogenesis
b. Mitochondrial matrix
[CITRIC ACID CYCLE]
Cellular site of the citric acid cycle
a. Cytosol
b. Mitochondrial matrix
c. Nucleus
d. Endoplasmic reticulum
c. Isocitrate dehydrogenase (IDH)
[CITRIC ACID CYCLE]
Rate-limiting enzyme of the citric acid cycle
a. Pyruvate dehydrogenase
b. Citrate synthase
c. Isocitrate dehydrogenase (IDH)
d. Succinate dehydrogenase
b. Citric acid cycle
[CITRIC ACID CYCLE]
Central pathway/hub for energy generation
a. Glycolysis
b. Citric acid cycle
c. Pentose phosphate pathway
d. Gluconeogenesis
b. Amphibolic
[CITRIC ACID CYCLE]
The citric acid cycle is described as _______ since it has both catabolic and anabolic roles
a. Allosteric
b. Amphibolic
c. Anaplerotic
d. Anabolic
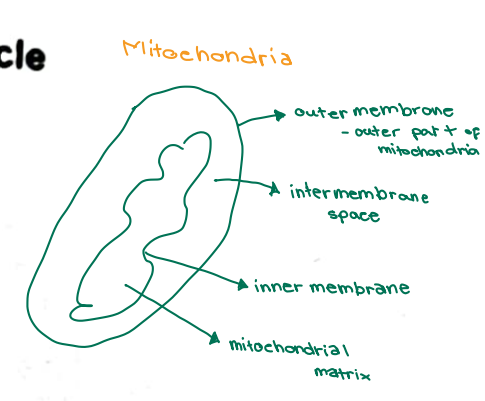
Parts of Mitochondria:
c. Citrate synthase

[CITRIC ACID CYCLE DIAGRAM]
Enzyme that converts Acetyl-CoA and Oxaloacetate → Citrate
a. Aconitase
b. Isocitrate dehydrogenase
c. Citrate synthase
d. Succinate dehydrogenase
c. 6C
[CITRIC ACID CYCLE DIAGRAM]
Number of carbons in Citrate
a. 4C
b. 5C
c. 6C
d. 2C
c. Aconitase

[CITRIC ACID CYCLE DIAGRAM]
Enzyme that converts Citrate → Isocitrate
a. Citrate synthase
b. Fumarase
c. Aconitase
d. Malate dehydrogenase
d. Isocitrate dehydrogenase

[CITRIC ACID CYCLE DIAGRAM]
Enzyme that converts Isocitrate → alpha-ketoglutarate
a. Succinate dehydrogenase
b. Alpha-ketoglutarate dehydrogenase
c. Citrate synthase
d. Isocitrate dehydrogenase
c. 5C

[CITRIC ACID CYCLE DIAGRAM]
Number of carbons in alpha-ketoglutarate
a. 4C
b. 6C
c. 5C
d. 2C
c. Isocitrate dehydrogenase step

[CITRIC ACID CYCLE DIAGRAM]
The rate-limiting step of the Krebs cycle / Citric acid cyle/ TCA cycle
a. Citrate synthase step
b. Succinate dehydrogenase step
c. Isocitrate dehydrogenase step
d. Malate dehydrogenase step
c. Alpha-ketoglutarate dehydrogenase

[CITRIC ACID CYCLE DIAGRAM]
Enzyme that converts alpha-ketoglutarate → Succinyl-CoA
a. Isocitrate dehydrogenase
b. Succinate thiokinase
c. Alpha-ketoglutarate dehydrogenase
d. Aconitase
b. 4C

[CITRIC ACID CYCLE DIAGRAM]
Number of carbons in Succinyl-CoA
a. 2C
b. 4C
c. 5C
d. 6C
c. Succinate thiokinase / Succinyl-CoA synthetase

[CITRIC ACID CYCLE DIAGRAM]
Enzyme that converts Succinyl-CoA → Succinate
a. Succinate dehydrogenase
b. Fumarase
c. Succinate thiokinase / Succinyl-CoA synthetase
d. Malate dehydrogenase
d. GTP

[CITRIC ACID CYCLE DIAGRAM]
High-energy compound generated during the conversion of Succinyl-CoA → Succinate
a. ATP
b. NADH
c. FADH₂
d. GTP
b. Succinate dehydrogenase

[CITRIC ACID CYCLE DIAGRAM]
Enzyme that converts Succinate → Fumarate
a. Fumarase
b. Succinate dehydrogenase
c. Malate dehydrogenase
d. Aconitase
c. FADH₂

[CITRIC ACID CYCLE DIAGRAM]
High-energy compound generated during the conversion of Succinate → Fumarate
a. GTP
b. NADH
c. FADH₂
d. ATP
a. Fumarase

[CITRIC ACID CYCLE DIAGRAM]
Enzyme that converts Fumarate → Malate
a. Fumarase
b. Succinate dehydrogenase
c. Aconitase
d. Citrate synthase
b. Malate dehydrogenase

[CITRIC ACID CYCLE DIAGRAM]
Enzyme that converts Malate → Oxaloacetate
a. Fumarase
b. Malate dehydrogenase
c. Succinate dehydrogenase
d. Citrate synthase
b. 4C

[CITRIC ACID CYCLE DIAGRAM]
Number of carbons in Oxaloacetate
a. 2C
b. 4C
c. 5C
d. 6C
c. 3

[CITRIC ACID CYCLE DIAGRAM]
Number of NADH produced per turn of the Krebs cycle
a. 1
b. 2
c. 3
d. 4
a. 1

[CITRIC ACID CYCLE DIAGRAM]
Number of FADH₂ produced per turn of the Krebs cycle
a. 1
b. 2
c. 3
d. 4
a. 1

[CITRIC ACID CYCLE DIAGRAM]
Number of GTP produced per turn of the Krebs cycle
a. 1
b. 2
c. 3
d. 4
c. 10 ATP

[CITRIC ACID CYCLE DIAGRAM]
Net ATP yield per Acetyl-CoA in the Krebs cycle
a. 7.5 ATP
b. 8.5 ATP
c. 10 ATP
d. 12 ATP
b. Citrate

[CITRIC ACID CYCLE DIAGRAM]
Krebs cycle intermediate used for fatty acid synthesis, supporting its amphibolic nature
a. Oxaloacetate
b. Citrate
c. Succinyl-CoA
d. Alpha-ketoglutarate
d. Alpha-ketoglutarate

[CITRIC ACID CYCLE DIAGRAM]
Krebs cycle intermediate used for amino acid synthesis and breakdown
a. Citrate
b. Succinyl-CoA
c. Oxaloacetate
d. Alpha-ketoglutarate
a. Oxaloacetate (OAA)

[CITRIC ACID CYCLE DIAGRAM]
Krebs cycle intermediate used for glucose production
a. Oxaloacetate (OAA)
b. Citrate
c. Succinyl-CoA
d. Alpha-ketoglutarate
d. Succinyl-CoA

[CITRIC ACID CYCLE DIAGRAM]
Krebs cycle intermediate used for heme synthesis
a. Citrate
b. Oxaloacetate
c. Alpha-ketoglutarate
d. Succinyl-CoA
b. Dehydrogenase

[CITRIC ACID CYCLE DIAGRAM]
BEQ: Clue for identifying the steps in the Krebs cycle that produce energy
a. Synthase
b. Dehydrogenase
c. Thiokinase
d. Mutase
c. Succinate

[CITRIC ACID CYCLE DIAGRAM]
BEQ: Clue for identifying the step in the Krebs cycle that generates GTP
a. Citrate
b. Fumarate
c. Succinate
d. Isocitrate
c. Oxidative phosphorylation
Synthesis of ATP via oxidation of NADH or FADH₂ in the electron transport chain
a. Glycolysis
b. Substrate-level phosphorylation
c. Oxidative phosphorylation
d. Photophosphorylation
c. Oxidative phosphorylation
Considered the final step in cell respiration
a. Glycolysis
b. Citric acid cycle
c. Oxidative phosphorylation