Maxwell–Boltzmann distribution
 Call Kai
 Learn
Learn Practice Test
 Spaced Repetition
 Match
Match Flashcards
 Knowt Play
1/5

There's no tags or description
Looks like no tags are added yet.
Name | Mastery | Learn | Test | Matching | Spaced | Call with Kai | Chat |
|---|
No analytics yet
Send a link to your students to track their progress
6 Terms
What does the Maxwell–Boltzmann distribution show?
The Maxwell–Boltzmann distribution is a graph showing how the energies (kinetic energies) of particles in a sample of gas are distributed at a given temperature.

What are the key features of a Maxwell–Boltzmann distribution curve you must be able to describe and draw?
The key features are:
The curve starts at the origin (0,0) — no particles have zero kinetic energy.
It rises to a peak — the most probable energy (the energy possessed by the greatest number of particles).
It is asymmetric — the right-hand tail is long and never touches the x-axis (some particles always have very high energies).
The area under the entire curve represents the total number of particles in the sample.
The activation energy (Ea) is marked on the x-axis to the right of the peak — only particles with energy to the right of this mark (under the tail of the curve) have sufficient energy to react.
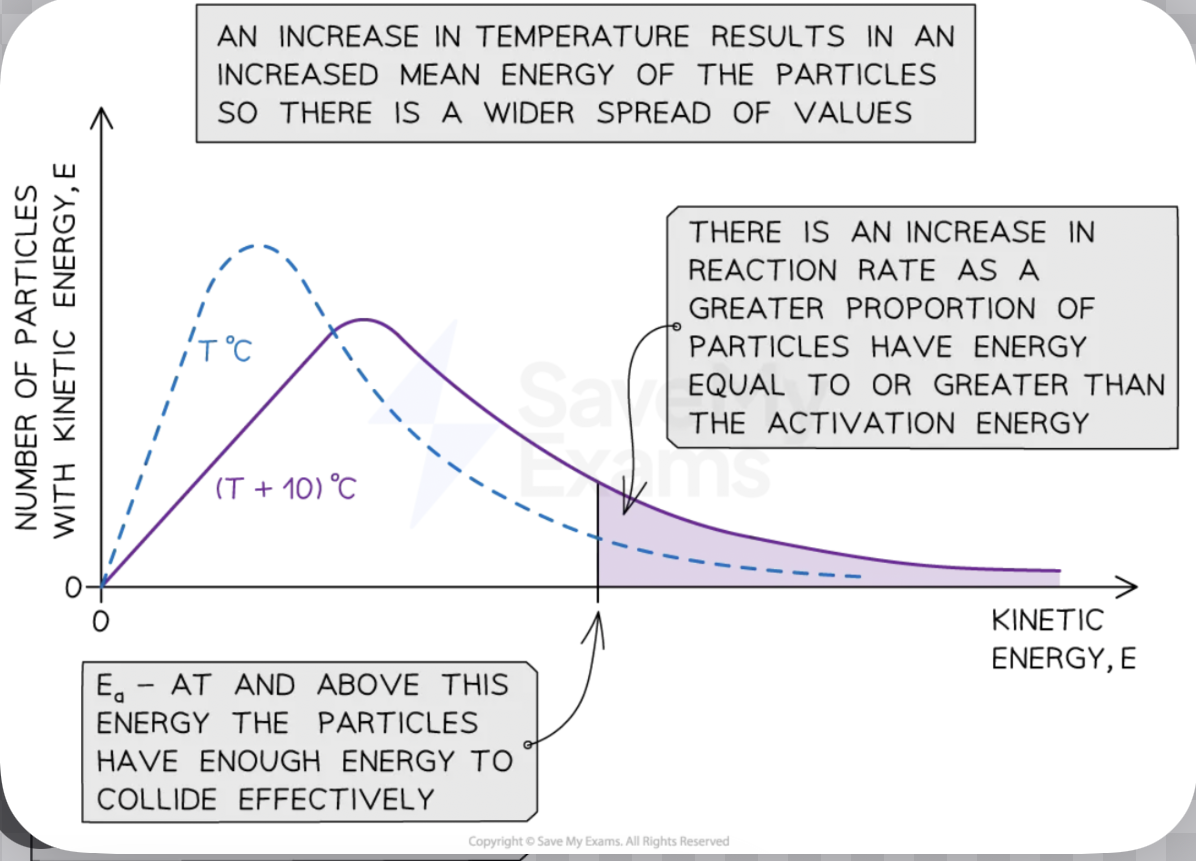
How does increasing temperature affect the Maxwell–Boltzmann distribution curve?
When temperature increases: the peak of the curve shifts to the right (higher energy) and becomes lower and flatter. The area under the curve remains the same (the total number of particles is unchanged). Crucially, the area under the curve to the right of the activation energy (Ea) increases significantly — a much greater proportion of particles now have energy ≥ Ea. This explains why even a small temperature rise greatly increases the rate — the increase in the proportion of successful collisions is much larger than you might expect.
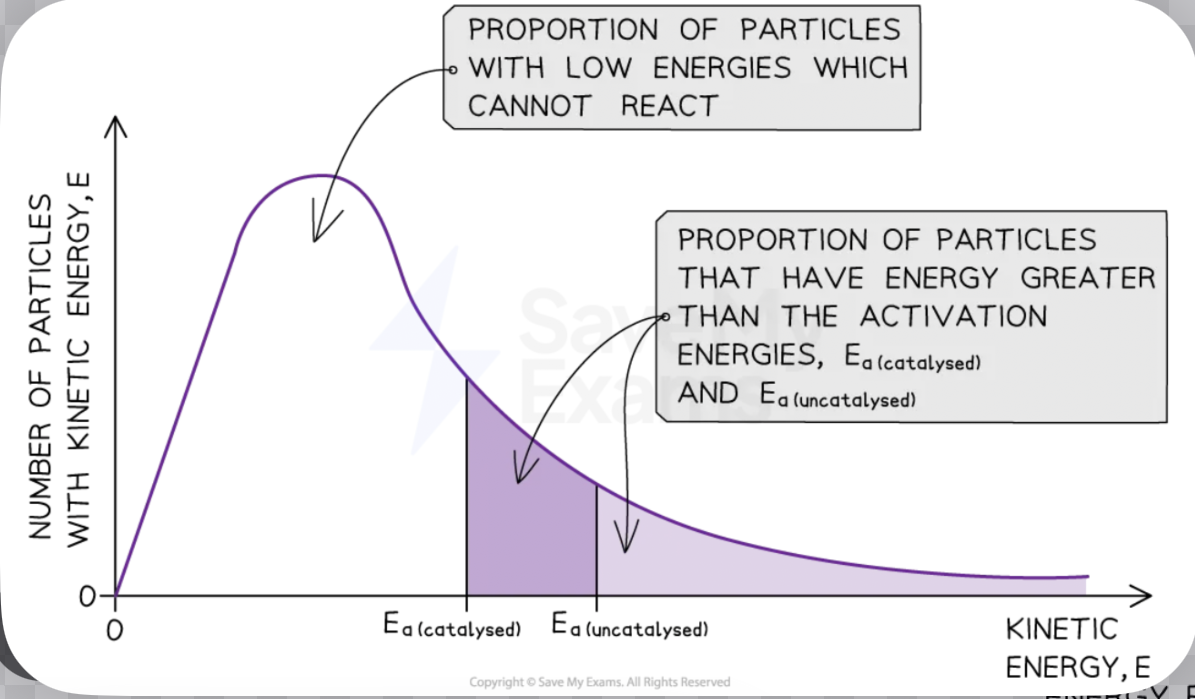
How does a catalyst affect the Maxwell–Boltzmann distribution, and how is this shown on a diagram?
A catalyst does not change the Maxwell–Boltzmann distribution curve at all — the shape and position of the curve remain exactly the same because the temperature has not changed and the particles' energies are unaffected. What changes is the position of the activation energy line — the catalyst lowers Ea, so the Ea line shifts to the left on the energy axis. This means a greater proportion of particles (larger area under the curve to the right of the new, lower Ea) now have sufficient energy to react, so the rate increases.
Why does the Maxwell–Boltzmann curve never touch the x-axis on the right-hand side?
Because there is always a small but non-zero probability of particles having very high energies. In a large sample, there will always be some particles with extremely high kinetic energy — the probability approaches zero but never actually reaches it.
Describe the key difference between how a temperature increase and a catalyst increase the rate, using the Maxwell–Boltzmann distribution.
A temperature increase shifts the entire distribution curve to the right (higher energies) and flattens it, with Ea staying in the same position — more particles now exceed Ea. A catalyst leaves the curve completely unchanged but moves the Ea line to the left — again more particles now exceed Ea. Both result in a greater proportion of successful collisions, but by completely different mechanisms: temperature changes the energy of the particles; a catalyst changes the energy required for reaction.