Home Range & Habitat Selection
1/14
There's no tags or description
Looks like no tags are added yet.
Name | Mastery | Learn | Test | Matching | Spaced | Call with Kai |
|---|
No analytics yet
Send a link to your students to track their progress
15 Terms
How can home ranges be defined?
as the area traversed by an individual for food, mating, caring, not occasional explorations
The part of an animal’s cognitive map that it updates
What are the 2 ways home range maps are drawn? Describe them.
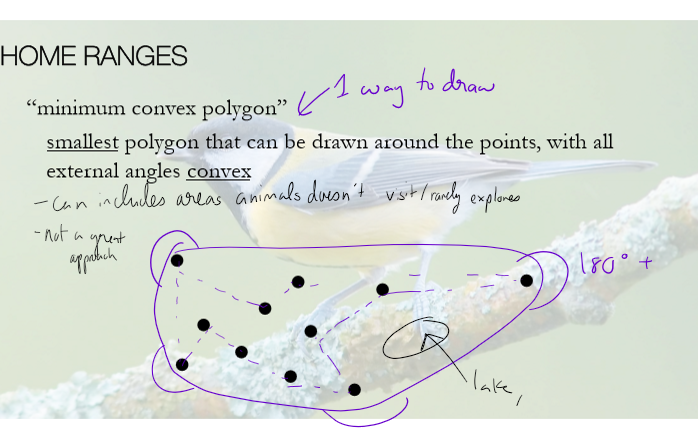
minimum convex polygon - smallest polygon that can be drawn around a point with all external areas convex
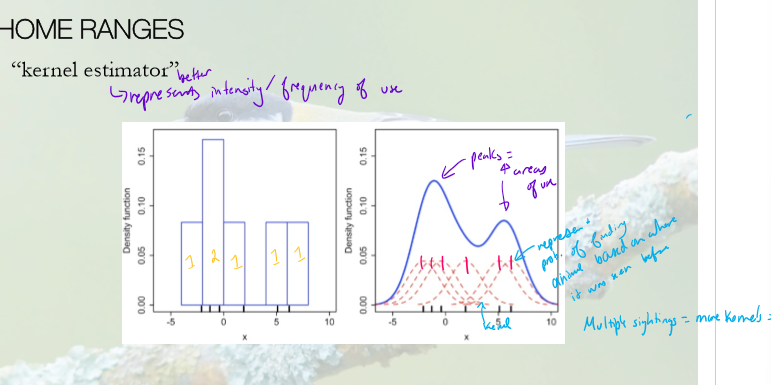
Kernel estimator - represents the intensity/frequency of land use using kernels that increase the likelihood of an animal being seen in that area
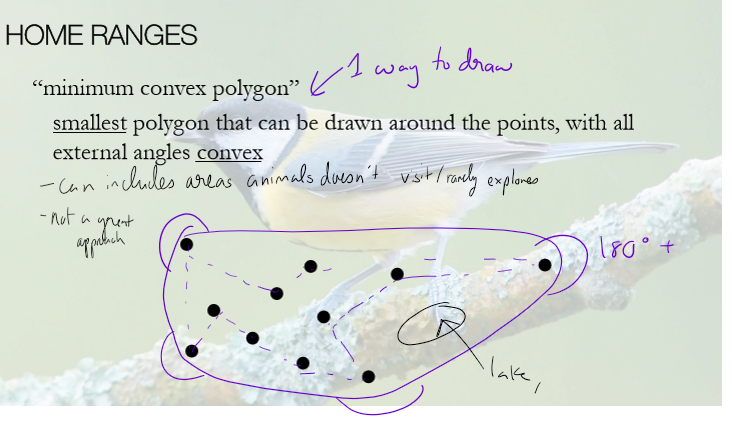
What are some issues with the minimum convex polygon approach to drawing home ranges?
can include areas that animals don’t visit or rarelt explore, such as lakes, or just include areas that the animal doesn’t visit (due to the convex rule)

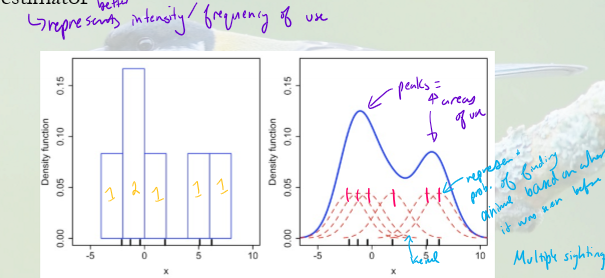
How do kernel estimators for defining home ranges work?
collects data on where an animal was seen, converted to a “kernel"
each kernel represents the probability of finding an animal in that area
multiple sightings = multiple kernels = more likely to see that animal there
creates map where peaks represent areas of higher use

what is habitat selection?
process by which organisms choose environments based on availability, quality of resources, and competition to promote survival/reproduction
When do we know when an animal prefers a habitat?
Can only be perfromed in a lab setting; provide all options equally and let them choose

A group of students are interested in studying raccoon habitat selection in SLO.
SLO is approximately 50% urban, 15% oak woodland and 35% grassland.
These students find that raccoons spend 50% of their time in urban areas, 15%
in oak woodland and 35% in grassland. Are they:
A long-term study of habitat selection for bison in Yellowstone National
Park has revealed the following information: bison use grassland, conifer
forest, and riparian areas in the following percentages: 85%, 5%, 10%.
Those areas represent 20%, 25%, and 10% of Yellowstone, respectively.
Assuming all habitats are available to the bison, which habitat are bison
avoiding?

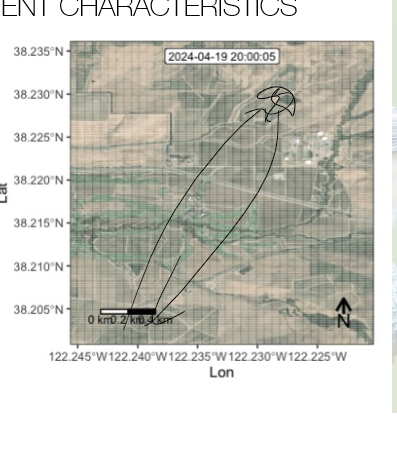
What are movement characteristics? How would you characterize commute and hunting movement?
measurable features/patterns that describe how an organism moves through space/time, used to understand an animal’s behavior and habitat use
commuting: fast, straight/directed, few turn angles, long step length
hunting: slow, zigzag, lots of turn angles, short step length, localized area use
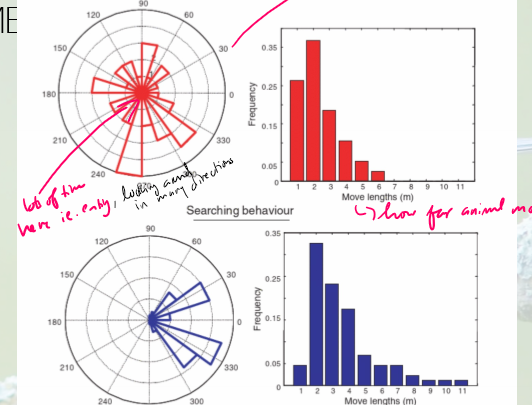
What are step characteristics in terms of movement characteristics? What step characteristics would you expect to see in foraging vs searching behavior?
geometry (with turn angle, step length, and frequency) of an animal’s movement
foraging: short step length, lots of turning angle
searching: longer step lenght, turn angles in one direction, more directed pattern

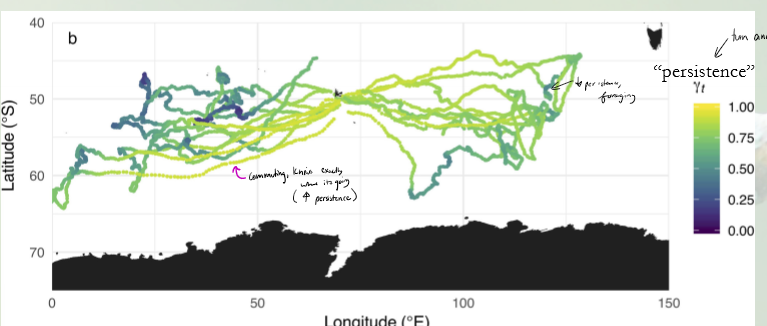
What is persistence in movement characteristics?
shows how consistently an animal maintains its direction of movement over time (inferred from turn angle and step length)
commuting has high persistence, foraging has low

Describe the levels of habitat selection
geographic range selection - where species is across region, determined by precipitation, climate, evolutionary history, etc. ex. moose are in North America
Home range estabilishment - where species home range is within geographic range, determined by habitat quality, resource availability, competition, etc. Ex. moose using boreal forest (in a study, deciding what makes something out vs in range)
within home range - selection of specific habitat types or patches within the home range ex. uses riparian and grassland within range equally ( in a study, in range)
habitat for particular life activities - selection of specific areas for life activities like feeding and nesting ex. moose uses that shrub instead of this one
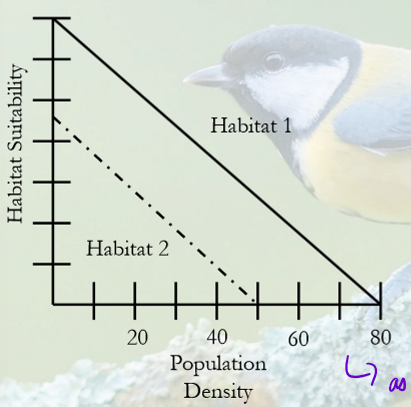
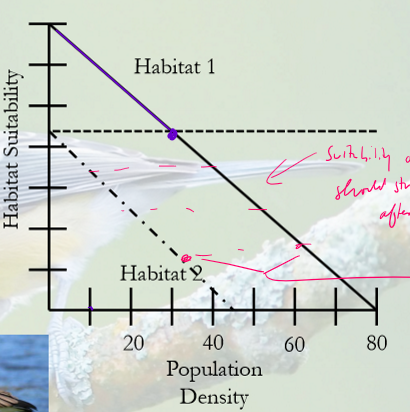
What is ideal free distribution?
explains how animals distribute themselves among patches in proportion to habitat suitability and population density
Ideal beacause eveery individual assumed to know suitability of habitats
free because individuals can move whereever they want
as population densirt increases, habitat suitabillity decreases
As animals move between patches:
High-quality patches attract more individuals.
But as more animals enter, competition increases and per-capita resources decrease.
Eventually, animals in all patches have equal fitness payoffs (no incentive to move).
This results in an equilibrium distribution where resource availability and suitabiity is equal across patches


Assume Habitat 1 and 2 represent
different breeding grounds for
cackling geese. Both are empty at the
beginning of the summer. Habitat 1
begins filling first. At what point will
individuals start selecting habitat 2?
When Habitat 1 density is at
What is ideal despotic distribution?
dominant individuals occupy the best habitats, forcing subordinates into lower-quality areas, so fitness is not equal across individuals.