Lecture 2 - Systems & Feedback
1/18
There's no tags or description
Looks like no tags are added yet.
Name | Mastery | Learn | Test | Matching | Spaced |
|---|
No study sessions yet.
19 Terms
System
Collection of connected, associated, or interdependent small sub-units (components) that work together and form a larger complex unit. These components and the entire system tend to have reasonably well-defined boundaries
It tends to be organised and have non-random arrangements
The interconnections between components determine behaviour of the system
How systems function imply a flow or transfer of material, energy, or information. This requires a driving force to push the flow
Environmental Systems
Tend to not have clear boundaries between components or even between systems. Besides truly isolated system, we rely on “boundary conditions” to roughly define boundaries or and within environmental systems.
They tend to have dynamic behaviour that changes from time to time and dependent on the situation, inputs, and outputs.
These connections tend to be non-linear and can branch to have multiple influences on another component, have a single output from multiple parts, and so on
Boundaries
Define how systems may functions.
Can be open, having a transfer of matter and energy between systems and the environment
Can be closed, having only a transfer of energy between systems and the environment
Can be isolated, having no transfer of energy or matter. There are questions about whether there are truly isolated systems, but serve as useful models.
System Analysis
The study of the composition and function of a system
System Modelling
The representation of a system in a more understandable fashion for the purpose of experiments, testing, predictions, and sharing information
Environmental System Assumptions
Able to sub-divide real world parts into discrete function units
Units have predictable and simple behaviour compared to the whole
Inputs and outputs and interrelationships between components can be determined
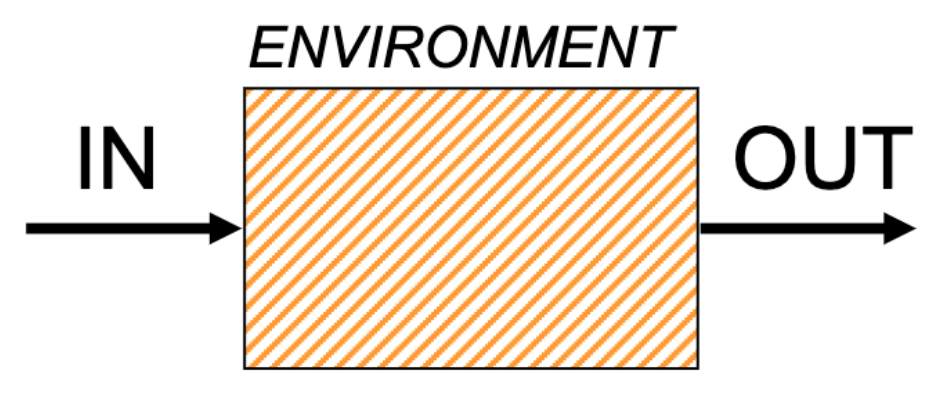
Black Box
When only inputs and outputs are understood
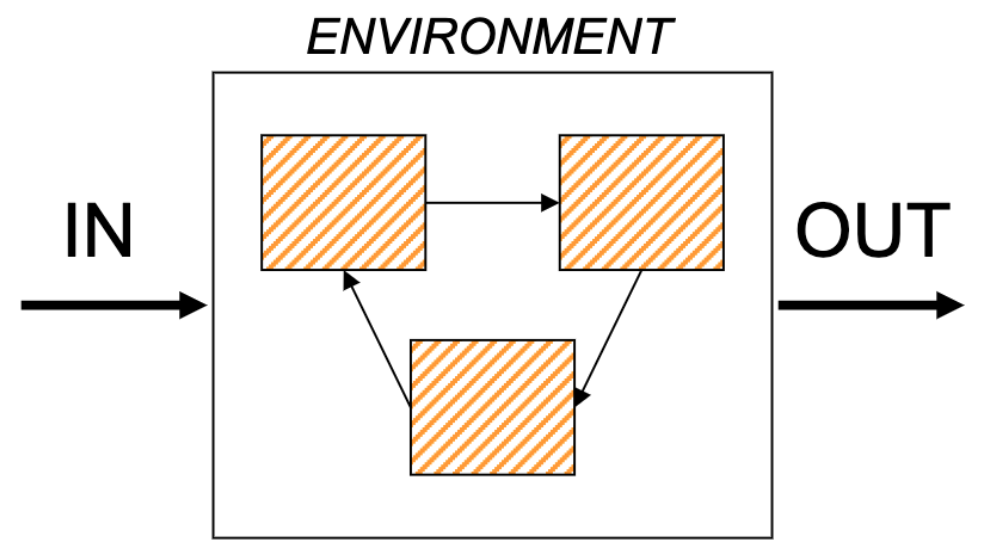
Grey Box
When inputs and outputs are understood, with some understanding of components
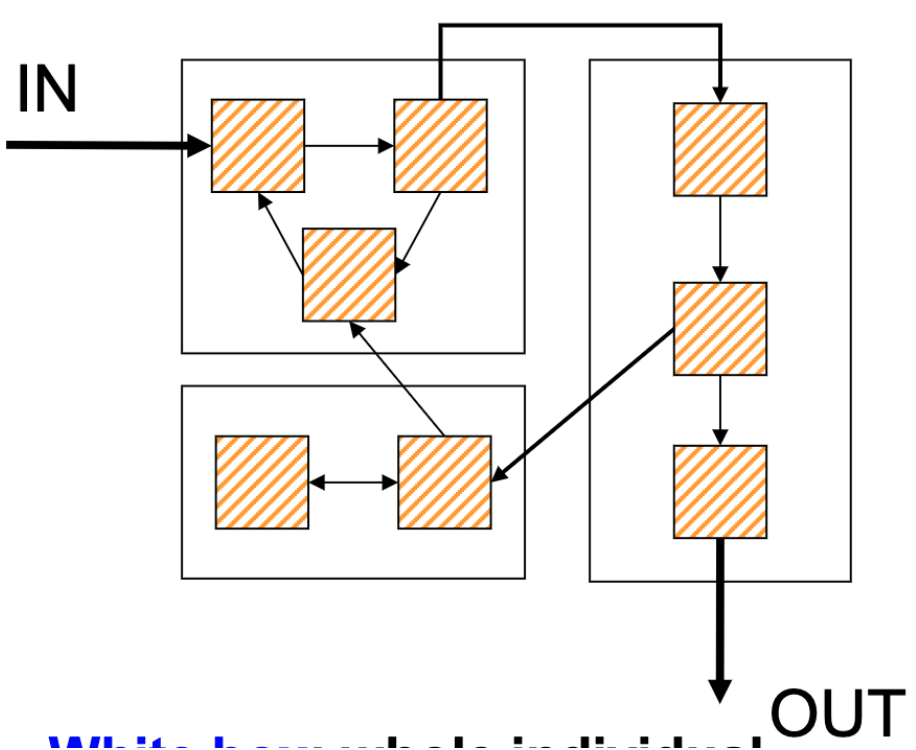
White Box
When the whole individual relationship is understood, including individual componenets, and their stores & flows
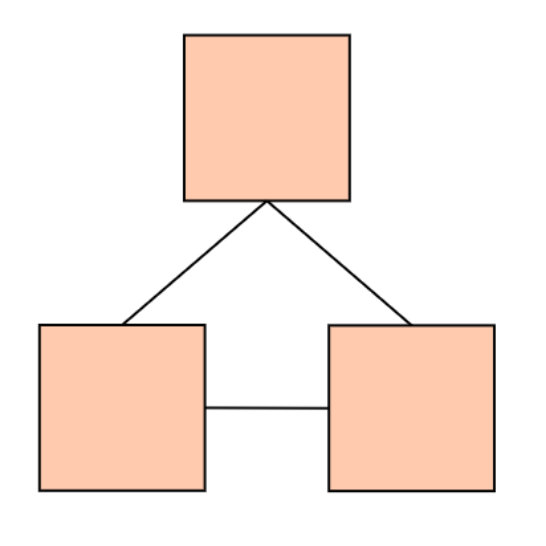
Morphological
Emphasises the relationship between components & strengths

Cascading
Show components linked by flows of mass, energy, or both
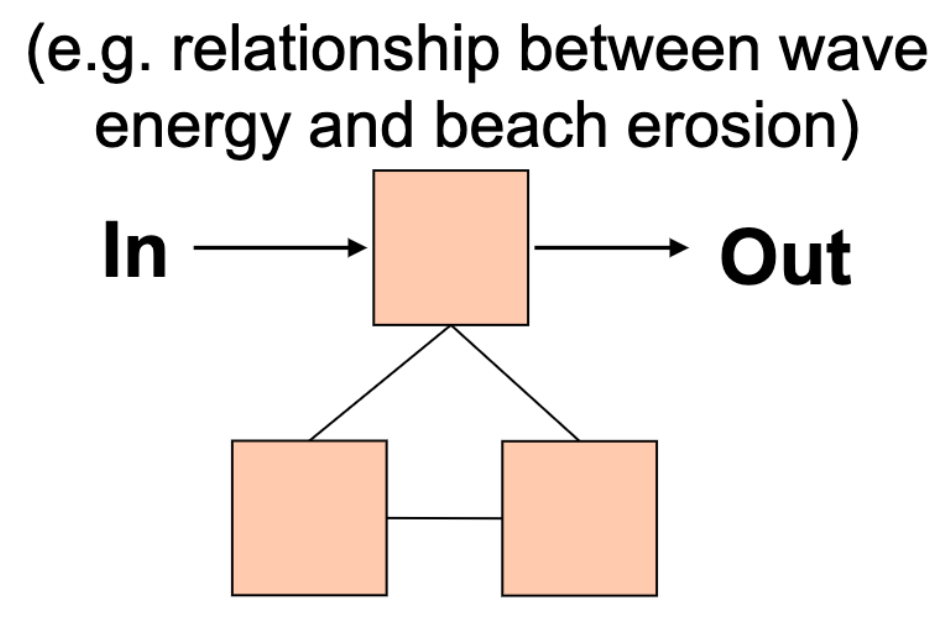
Process-Response
A hybrid that emphasises relationship between system form and process
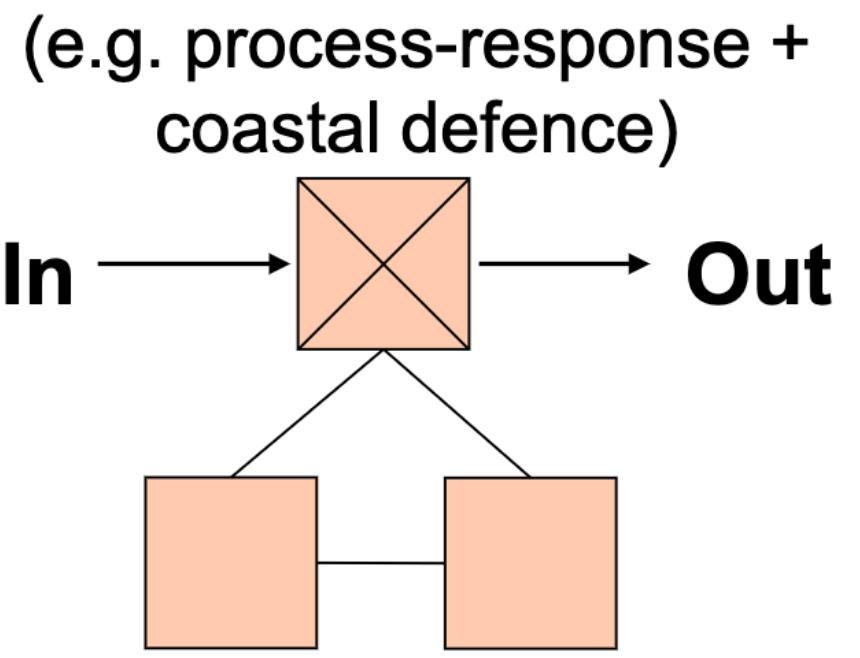
Control
Process-Response with human influence, typically human control of the system
Steps of Systems’ Analysis
Lexical: defining the system
Parsing: defining the links
Modelling: constructing the model
Validation: testing the model
The steps are iterative and should be repeated to continue bettering the system
Equilibrium
Stationary but not unchanging. It just means the system returns to the same/prior state after perturbation (stress/change).
Statistical equilibrium occurs when systems varies around some average value in the long-term (with some changes).
Response to perturbation would be when system returns to pre-perturbation conditions. How long it takes is dependent on the scale and timing of perturbation, connections within the system, and so on
Positive Feedback
Amplification-type process, once a change starts, it is maintained and amplified
One example is with permafrost. As temperatures rise, permafrost soils start to thaw out and release CO2 into the atmosphere. The emitted CO2 then contributes to more warming which leads to more permafrost thaw
Negative Feedback
Counteractive-process where the effect of the change is reduced, maintaining the system state
One example would be predator-prey relationships where there is a negative feedback in their populations. As prey populations rise, so will predator populations. But, after some time, predator populations will cause prey populations to reduce. Then, with less prey, predator populations will reduce too.
Another example would be cloud formation and temperatures. As temperatures raise, it’ll result in more evaporation which then increases cloud cover. As cloud cover increases, it reflects more sunlight into space, resulting in lower temperatures.
Virtual World
How we model the real world by simplifying it. It is needed as most of the time, we can’t just haphazardly experiment and test upon the real world without major consequences/risks.
From the real world, we’d collect abstractions and data depending on what researchers are interested in studying and or looking for.
Since this is a human-led process, there tends to be abstractions, errors, and misconceptions.
Data may not be ambiguous and not accurately model the real world
One example would be how climate scientists noticed holes in the ozone layer in the real world but wasn’t reflected upon in their data. However, it was only so because the way the collected & organised their data resulted with them ignoring the data that indicated holes
From the data, we’d decide how to implement into the world (virtual or real)
Usually, we’d design models that represent the real world known as the virtual world. These models tend to be very simplified versions of the real world and may even ignore or depart from the real world. But this is allowed due to the simplification & abstractions
From the implementation, we are able to predict and learn from the outputs and results
Due to the differences between the real and virtual world, there tend to be different sets of hypotheses for both