Chapter 10: Correlation and Regression
1/29
There's no tags or description
Looks like no tags are added yet.
Name | Mastery | Learn | Test | Matching | Spaced | Call with Kai |
|---|
No analytics yet
Send a link to your students to track their progress
30 Terms
Correlation Analysis
Statistical study of the strength and direction of the relationship between two quantitative variables.
Scatterplot (Scatter Diagram)
A two-dimensional graph that plots individual paired observations to visualize the possible relationships between two variables.
Positive Linear Correlation
Relationship in which an increase in one variable corresponds to increases in the other variable.
Negative Linear Correlation
Relationship in which an increase in one variable correspond to decreases in the other variable.
No Linear Correlation
Situation where an increase in one variable has no consistent impact on the other variable.
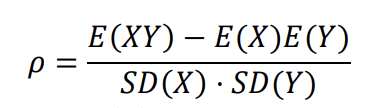
Linear Correlation Coefficient (ρ)
A summary measure that denotes the strength of the linear relationship existing between two variables (say X and Y), that is independent of the respective scales of measurement
denoted by 𝜌 (lowercase Greek letter rho
Formula of the Linear Correlation Coefficient
Properties of the linear correlation coefficient
−1 ≤ ρ ≤ 1
positive value means that the line slopes upward (to the right)
negative value means that the line slopes downward (to the right)
ρ = 0 → no linear coefficient
p = -1 or +1 → perfect linear relationship
p close to 1 or -1 → strong linear relationship
Pearson Product-Moment Correlation Coefficient (r)
Sample statistic that estimates ρ; calculated from paired data to quantify linear association.
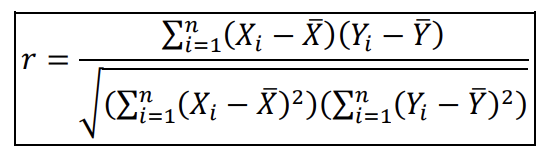
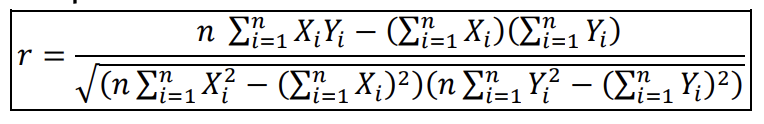
Computational formula for r
Perfect Linear Correlation
Case where ρ = ±1 and every data point falls exactly on a straight line.
Hypothesis Test for ρ
Uses test statistic T = (r − ρ₀) / √[(1 − r²)/(n − 2)] with t-distribution (n − 2 df) to assess a specified population correlation.
![<p>Uses test statistic T = (r − ρ₀) / √[(1 − r²)/(n − 2)] with t-distribution (n − 2 df) to assess a specified population correlation.</p>](https://knowt-user-attachments.s3.amazonaws.com/926d5a45-5588-404e-9b79-1ee34e23c142.png)
Correlation Does Not Imply Causation
Strong association alone cannot establish that one variable causes changes in another; third factors or coincidence may exist.
Simple Linear Regression Model (SLRM)
A probabilistic model that relates a response variable Y to an explanatory variable X via a linear function plus random error. → Yᵢ = β₀ + β₁Xᵢ + εᵢ
Response Variable (Y)
Outcome being predicted or explained in regression analysis.
Explanatory Variable (Predictor, X)
Variable used to predict or explain changes in the response variable.
Regression Coefficient β₀
Y-intercept of the regression line → expected value of Y when X = 0 (may be uninterpretable if 0 is outside data range).
Regression Coefficient β₁
Slope of the line; expected change in mean Y for a one-unit increase in X.
Random Error Term (εᵢ)
A representation of the effect of unobserved factors that affect the response variable to some extent; assumed:
independent,
normally distributed
mean 0
constant variance σ²
Random distribution of Y variable in the simple linear regression model
𝑌𝑖 = 𝛽0 + 𝛽1𝑋i + 𝜀i, where 𝜀i~Normal(0, 𝜎2)
Regression Equation
E(Y) = 𝛽0 + 𝛽1xi
Least Squares Method
Estimation technique that chooses β̂₀ and β̂₁ to minimize the sum of squares of the deviations of the observed value of Y from its expected value (choosing the “best-fitting” line that fits all data points as much as possible).
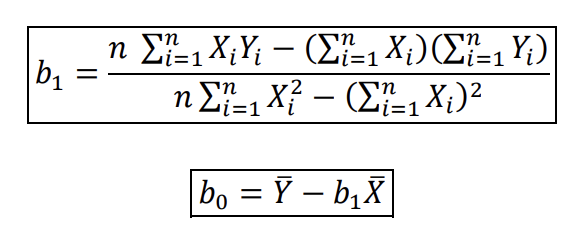
Least of Squares Estimators
𝑏1 = 𝛽̂1 and 𝑏0 = 𝛽̂0 are given as follows:
On Extrapolation of the Regression Model
The estimated regression equation is appropriate only for the relevant range of X.
Testing if there is no linear relationship between Y and X
Hypothesis Test → Ho: 𝛽1 = 0 versus Ha: 𝛽1 ≠ 0.
Confidence Interval → construct a confidence interval for 𝛽1 and check if it contains 0
Residual (dᵢ)
Difference between observed and predicted response: dᵢ = Yᵢ − Ŷᵢ.
Coefficient of Determination (R²)
Proportion of the variability in the observed values of the response variable Y that can be explained by the explanatory variable X through their linear relationship
Purpose of the Coefficient of Determination
Used to assess the goodness-of-fit of the linear regression model
Range of the Coefficient of Determination (R2)
R² = r² (0 ≤ R² ≤ 1)
Perfect probability = 1
No predictive capability = 0
Interpretation of the Coefficient of Determination
An R² of __ means that __% of the variance/variability in Y can be predicted/explained by X