SNAB TOPIC 5- On the Wild side
1/31
There's no tags or description
Looks like no tags are added yet.
Name | Mastery | Learn | Test | Matching | Spaced | Call with Kai |
|---|
No analytics yet
Send a link to your students to track their progress
32 Terms
5.1 Understand the terms ecosystem, community, population and habitat.
Ecosystem: All the organisms, biotic and abiotic elements of an environment
Population- All of the organisms of ONE species living in a habitat at one time
Community: All populations of organisms living in a habitat
Habitat- the place where an organism lives
5.2 Understand that the numbers and distribution of organisms in a habitat are controlled by biotic and abiotic factors.
The numbers and distribution of organisms in a habitat are controlled by biotic and abiotic factors.
5.3 Understand how the concept of niche accounts for distribution and abundance of organisms in a habitat.
Niche- the role a species takes in its habitat
Niche concept : Only one organism can occupy each niche in a habitat at one time. If there is an overlap, the best adapted organism will outcompete the other organism.
Distribution and abundance will depend on the number and type of niches available within the habitat
CORE PRACTICAL 10:
Carry out a study on the ecology of a habitat, such as using quadrats and
transects to determine distribution and abundance of organisms, and
measuring abiotic factors appropriate to the habitat.
Equipment
Quadrat (Open, 10x10)
Transect (50m)
Clipboard
Equipment for chosen abiotic variable (lux meter for light intensity; barometer for wind pressure; densiometer for shade/cover; hygrometer for humidity)
Method
Choose a site where there is a clear gradient in an abiotic variable
Lay out transect
Place quadrat at set intervals with bottom left corner on the mark at each sampling point
Record percentage cover at each sampling point for chosen species at each interval, by counting how many squares are mostly covered by the selected species.
Measure and record the abiotic variable at each sampling point. Take multiple recordings at each sample point for a mean value.
Graph
Plot a graph of percentage cover against the chosen independent, abiotic variable.
Statistics
Calculate means for the repeats of abiotic factors at each sampling point
-Use T-test to compare means between two groups
-Use Spearman's to assess correlation between variables
-Use Chi-squared test to evaluate if there is a significant difference/association between two variables.
5.4 Understand the stages of succession from colonisation to a climax community.
Primary succession: Coloniser species, establishes habitable soil
Secondary succession- takes over barren soil
Organic matter is added to the ground through plant death.
[Rock is penetrated by roots. Sands are held together by roots]
Soil conditions improve.
More complex /varied/productive plants such as shrubs can survive, followed by shade intolerant trees and shade tolerant trees. Eventually, a climax community forms.
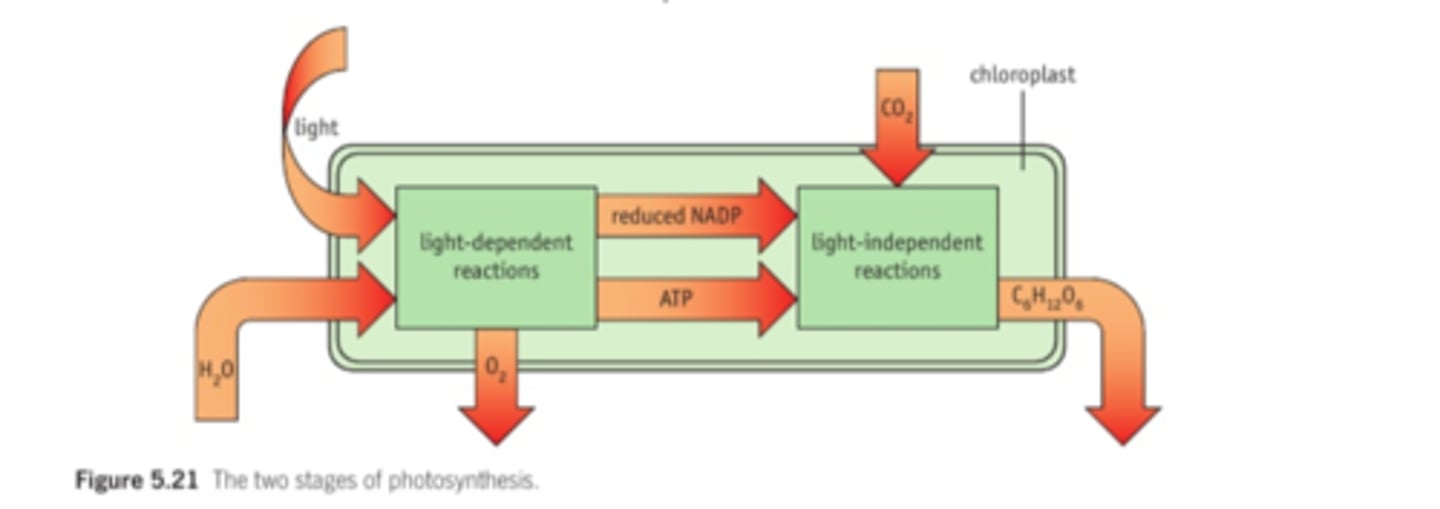
5.5 Understand the overall reaction of photosynthesis as requiring energy from light to split apart the strong bonds in water molecules, storing the hydrogen in a fuel (glucose) by combining it with carbon dioxide and releasing oxygen into the atmosphere.
Overall equation:
6H2O + 6CO2 --> C6H12O6 + 6O2
5.6 Understand how phosphorylation of ADP requires energy and that hydrolysis of ATP provides an immediate supply of energy for biological processes.
ADP + Pi --(energy)--> ATP
ATP-----> ADP + Pi + energy
ATP provides an immediate supply of energy
energy is released from: the exothermic reaction of hydrogen bonds being made between the released Pi + water molecules.
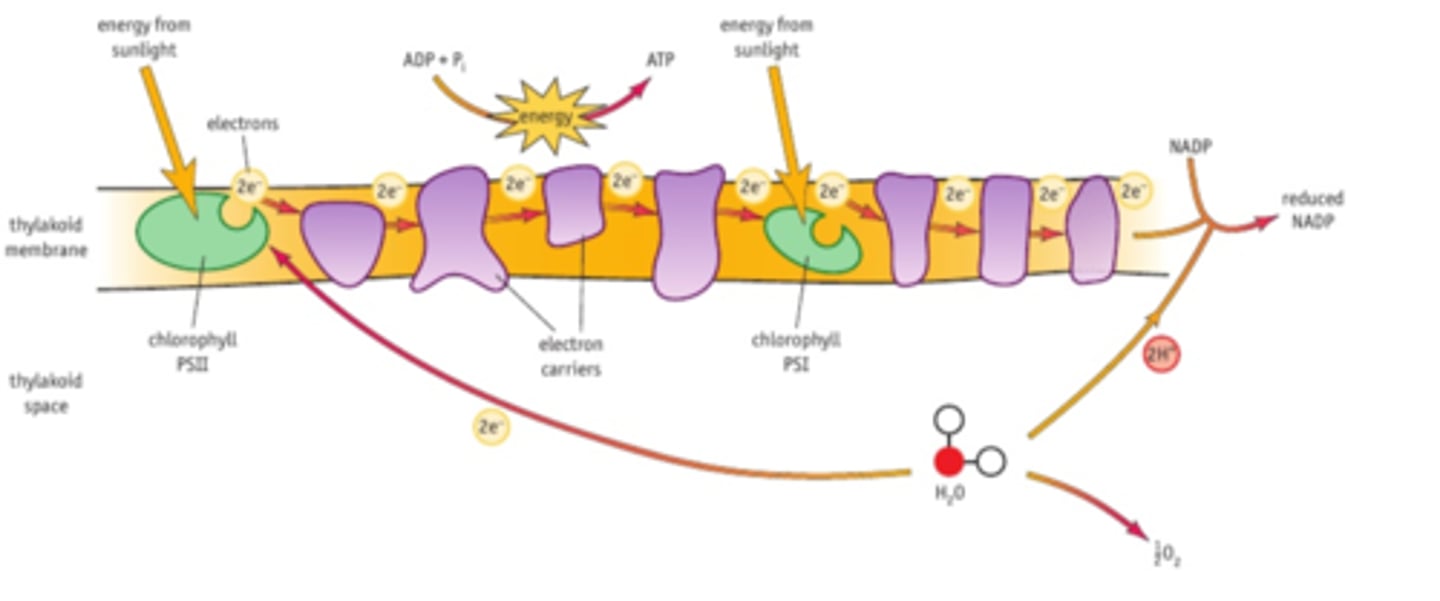
5.7 Understand the light-dependent reactions of photosynthesis including how light energy is trapped by exciting electrons in chlorophyll and the role of these electrons in generating ATP, reducing NADP in photophosphorylation and producing oxygen through photolysis of water.
PSI absorbs light energy of 700nm. PSII absorbs at 680.
Light excites electrons in chlorophyll in the thylakoid membrane, within the chloroplast.
Light also splits water by photolysis, releasing 1/2O2 , 2 electrons and protons
The electrons leave chlorophyll, travel down electron carriers, releasing energy.
This energy is used to generate ATP
In cyclic photophosphorylation, the electrons lost by PSII are regained from the ones released from photolysis of water.
In non cyclic photophosphorylation,
PSI loses electrons, that go down the ETC and reduce NADP (with protons), making NADPH. PSI only regains electrons from accepting the ones from PSII through the last electron carrier in the ETC.
5.7 (PART B) The light dependent reaction
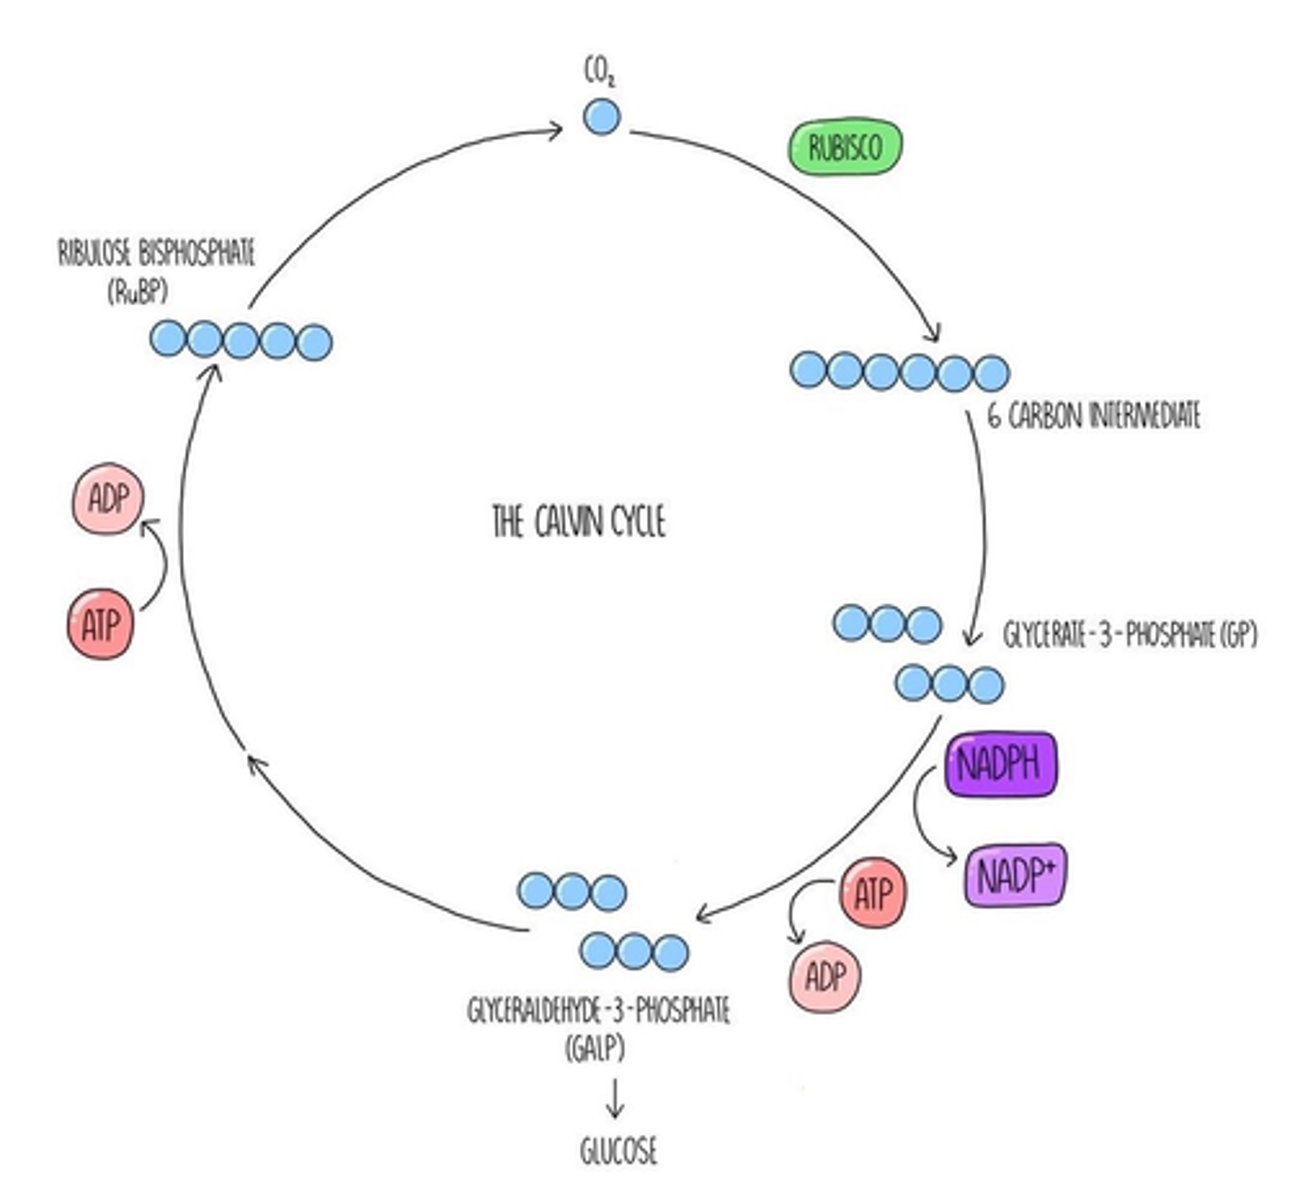
5.8 i) Understand the light-independent reactions as reduction of carbon dioxide using the products of the light-dependent reactions (carbon fixation in the Calvin cycle, the role of GP, GALP, RuBP and RUBISCO).
-CO2 is fixated with RuBP, a 5 carbon compound, by the RUBISCO enzyme
-The unstable 6 carbon intermediate splits into 2 GP.
-The GP is reduced by NAPH using energy from ATP, to form GALP
1/6 GALP--> glucose--> polysaccharides, lipids, amino acids, nucleic acids
5/6 GALP--> regenerate RuBP using energy from ATP
5.8 i) (PART B) Calvin cycle
5.8 ii) Know that the products are simple sugars that are used by plants, animals and other organisms in respiration and the synthesis of new biological molecules (polysaccharides, amino acids, lipids and nucleic acids).
Glucose--> polysaccharides, lipids, amino acids, nucleic acids
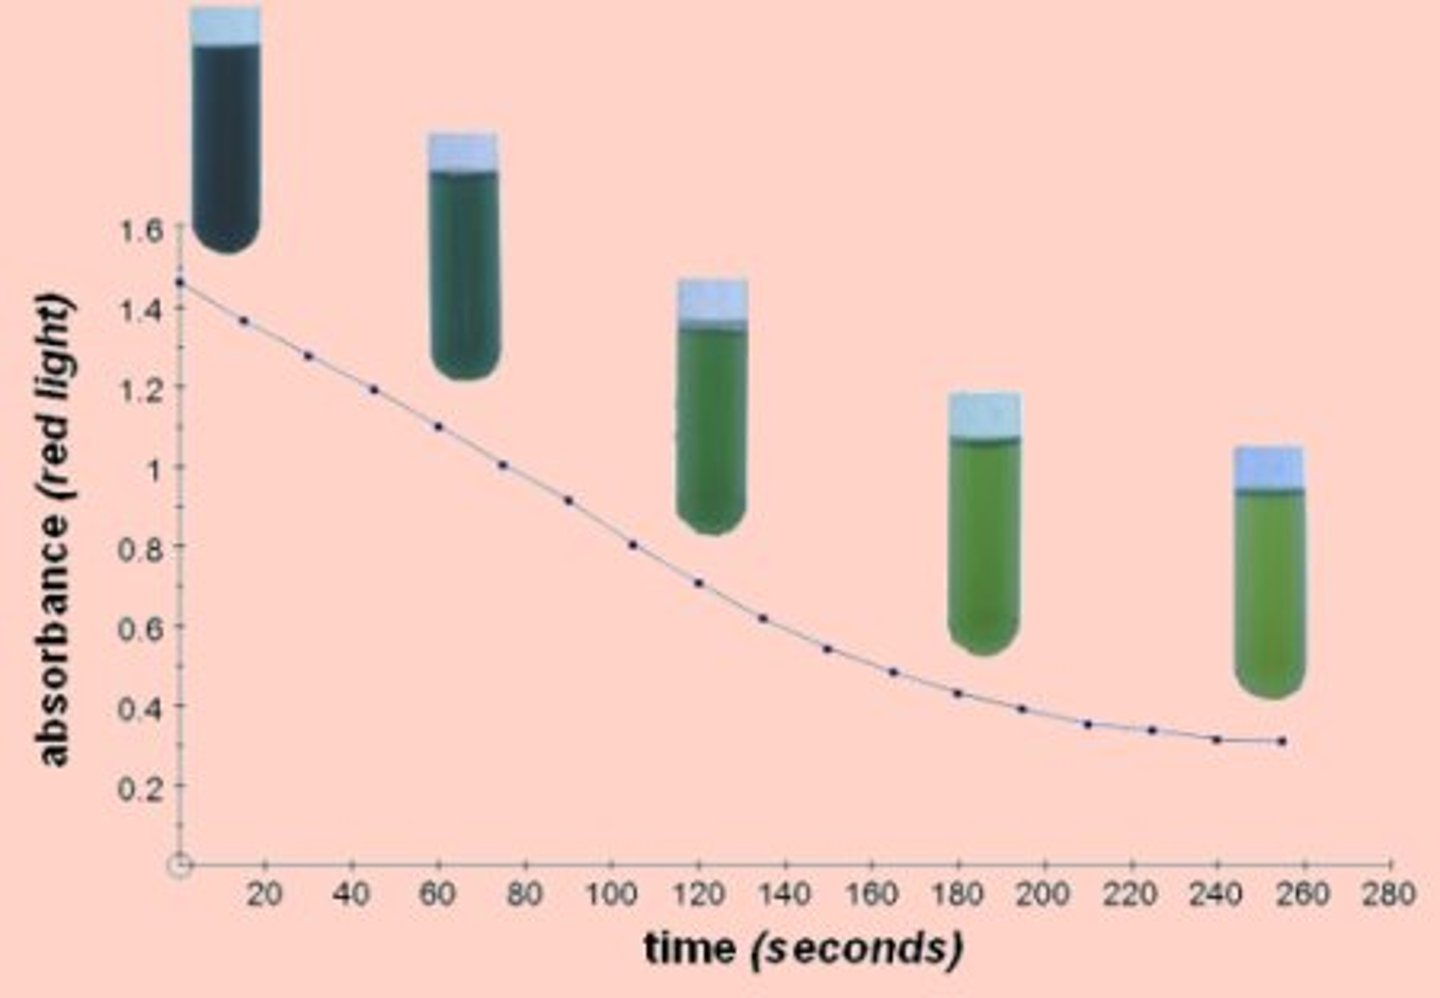
CORE PRACTICAL 11:
Investigate photosynthesis using isolated chloroplasts (the Hill reaction).
Equipment
•Leaf sample
•scissors
•mortar and pestle
•Centrifuge & tubes
•Ice-water-salt bath
•Glass rod
•Measuring cylinder
•Beaker
•Pipettes
•Lamp
•Isolation medium (sucrose solution)
•Buffer
•DCPIP solution
•Colorimeter
Method
1) Cut and crush leaf sample
2) Place in cold isolation solution
3) Filter/strain sample into beaker using funnel and muslin cloth
•Place beaker in a cold water bath
4) Centrifuge a sample in a tube at high speed for 10 minutes
•Once chloroplasts are separated, discard the supernatant
5) Add ice cold isolation medium to pellet/sediment
•Add buffer solution, mix
6) Pour 5cm3 of the solution into 5 test tubes
7) Place test tube rack with one of the test tubes a determined distance away from the lamp
8) Add 10cm3 DCPIP to the test tube
9) Immediately take a sample and place it in a colorimeter, measure the absorbance under a red filter
10) Vary the distances from the lamp
•Take a sample every two minutes for 10 minutes
Control
Place one of the tubes in a dark cupboard, covered with tin foil. Measure the absorbance for this and compare the results with this value.
Graph
Plot a graph of absorbance against time for each distance from the light
Explanation/conclusion
As light intensity decreases, the rate of photosynthesis decreases
This means less electrons are released by chlorophyll
This means DCPIP is decolourised less
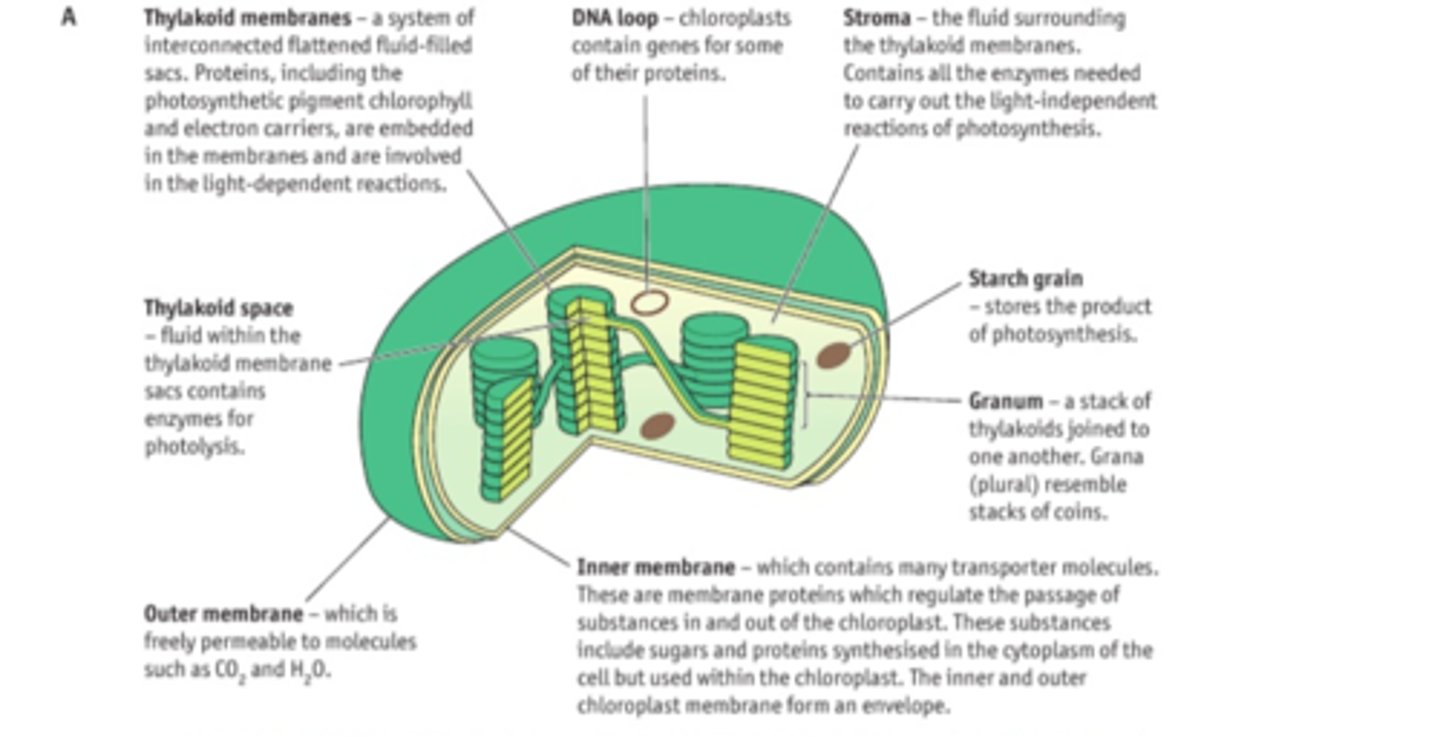
5.9 Understand the structure of chloroplasts in relation to their role in
photosynthesis.
5.10 i) Be able to calculate net primary productivity.
NPP=GPP-R
5.10 ii) Understand the relationship between gross primary productivity, net primary productivity and plant respiration.
•GPP=Total input of energy (e.g. from sun or from energy available in carbohydrates in plants)
•R=energy used plant respiration
•NPP=energy stored as biomass available to herbivores
NPP=GPP-R
GPP is higher than NPP
In animals:
•Inefficient digestion (<100% absorbed), egestion
•Respiration
In plants:
•Some light passes through leaves (translucent)
•Not all light hits leaves
•Not all wavelengths of light absorbed
•Some light reflected
5.11 Know how to calculate the efficiency of biomass and energy transfers between trophic levels.
(percentage increase/decrease calculations)
Energy efficiency = (net productivity energy received) x 100
5.12 Understand the different types of evidence for climate change and its causes, recognising correlations and causal relationships.
Evidence
•Records of CO2 levels
•Temperature records
Pollen found in peat bogs-
•pollen is preserved in peat bogs
•a plant species can be identified from its pollen
•climate affects the type of plants growing
•depth of peat correlates with period of time since pollen was produced
•changes in pollen over time indicate changes in climate
Dendrochonology- the study of tree rings;
•Size/width of rings is affected by the temperature in each year
•tree rings are wider in warm/wet years
•tree rings are thinner when it is cold/dry.
•Very thin rings may indicate droughts.
•Changes in width of rings over time (from centre) indicate a changing climate
5.12 sorry i forgot to include ice cores
Ice cores are another way of analysing climate change:
•ice from deeper below is older
•ice has bubbles
•bubbles have different levels of CO2 going up the ice core
•this indicates climate change over time
5.13 Understand the causes of anthropogenic climate change, including the role of greenhouse gases (carbon dioxide and methane) in the greenhouse effect.
Greenhouse gases are released by fossil fuel burning and livestock.
These trap infrared radiation within the atmosphere, leading to an increase in Earth's surface temperature
5.14 i) Understand that data can be extrapolated to make predictions and that these are used in models of future climate change.
Data can be extrapolated to make predictions and that these are used in models of future climate change.
5.14ii) Understand that models for climate change have limitations.
Limitations of models
-They do not include factors such as human effort to reduce greenhouse gas emissions.
-Limited power of computers/equipment
-Models' inability to reproduce atmospheric phenomena
5.15 Understand the effects of climate change on plants and animals (distribution of species, development and life cycles).
Effects of climate change
•Changing rainfall patterns
•Changes in seasonal cycles
Effects on plants/animals
Change in distribution of species, i.e. migration.
Migration may cause extinction of species due to competition
Changes in development of species. e.g. sex determination of some reptiles is dependent on temperature
Disrupted life cycles of species
5.16 Understand the effect of temperature on the rate of enzyme activity and its impact on plants, animals and microorganisms.
As temperature increases, enzyme activity initially increases too.
However, past the optimum temperature, enzymes become denatured and the activity slows down because the shape of the active site has changed.
Increased temperature may mean development of animals could be sped up, shortening the life cycle. Sex determination of reptiles may be affected.
Increasing temperature may mean that microorganisms will multiply faster as cellular activity speeds up. It may also be past the optimum temperature for some microorganisms so they could die off. Hotter temperatures are more welcoming to pathogens (37degreesC)
5.17 Understand how evolution (a change in the allele frequency) can come about through gene mutation and natural selection.
•Variation of phenotypes/genotypes from random mutations.
•Environmental change poses as a Selection pressure
•Some individuals have advantageous alleles
->Selective advantage for these individuals
-->Can survive and reproduce
--->Passes on alleles to their offspring
----->Over time, the frequency of certain alleles within a population changes.
(This can lead to sympatric speciation between populations, when new species are developed)
5.18 Understand the role of the scientific community (scientific journals, the peer review process, scientific conferences) in validating new evidence, including proteomics and genomics, that supports the accepted scientific theory of evolution.
Scientific community role
•Scientific journals
•The peer review process
•Scientific conferences
Proteomics/Genomics are the studies of proteins and genomes.
•By comparing genomes between species, scientists can construct phylogenetic trees, linking multiple species to common ancestors. (This is done by seeing the degree of similarity between the genetic sequence in both species.)
By studying proteins
•An organism's adaptation to its environment through the proteins can be understood.
•A phylogenetic tree can be made by comparing primary sequences of amino acids in the proteins of similar species. The more similar the sequences are, the more similar the DNA is.
5.19 Understand how isolation reduces gene flow between populations, leading to allopatric or sympatric speciation.
Allopatric isolation: geographic isolation of two populations
Sympatric isolation: non-geographic isolation e.g. temporal, behavioural, gametic, anatomic
Isolation reduces gene flow between the population and accumulation of genetic differences can cause speciation.
This means that they can no longer breed to produce fertile offspring
CORE PRACTICAL 12: Investigate the effect of temperature on the initial rate of an enzyme-catalysed reaction, to include Q10.
Equipment
Water bath
Boiling tube
H2O2 solution
Soaked peas
Gas syringe
Mortar and pestle
Stopwatch
Delivery tube/bung
Method
1) Measure set mass of peas
2) Grind and place in boiling tube
3) Set up delivery tube and gas syringe
4) Add 5cm3 H2O2
5)Immediately attach bung/delivery tube to boiling tube
6) Time reaction for a controlled time
7) Measure volume of gas produced at regular time intervals
8) Repeat experiment at different temperatures
Control variables
•Concentration of H2O2 solution
•Mass of peas
•Time of reaction
Graph
Plot graph of temp against concentration
Calculation
Rate= Volume of gas/time
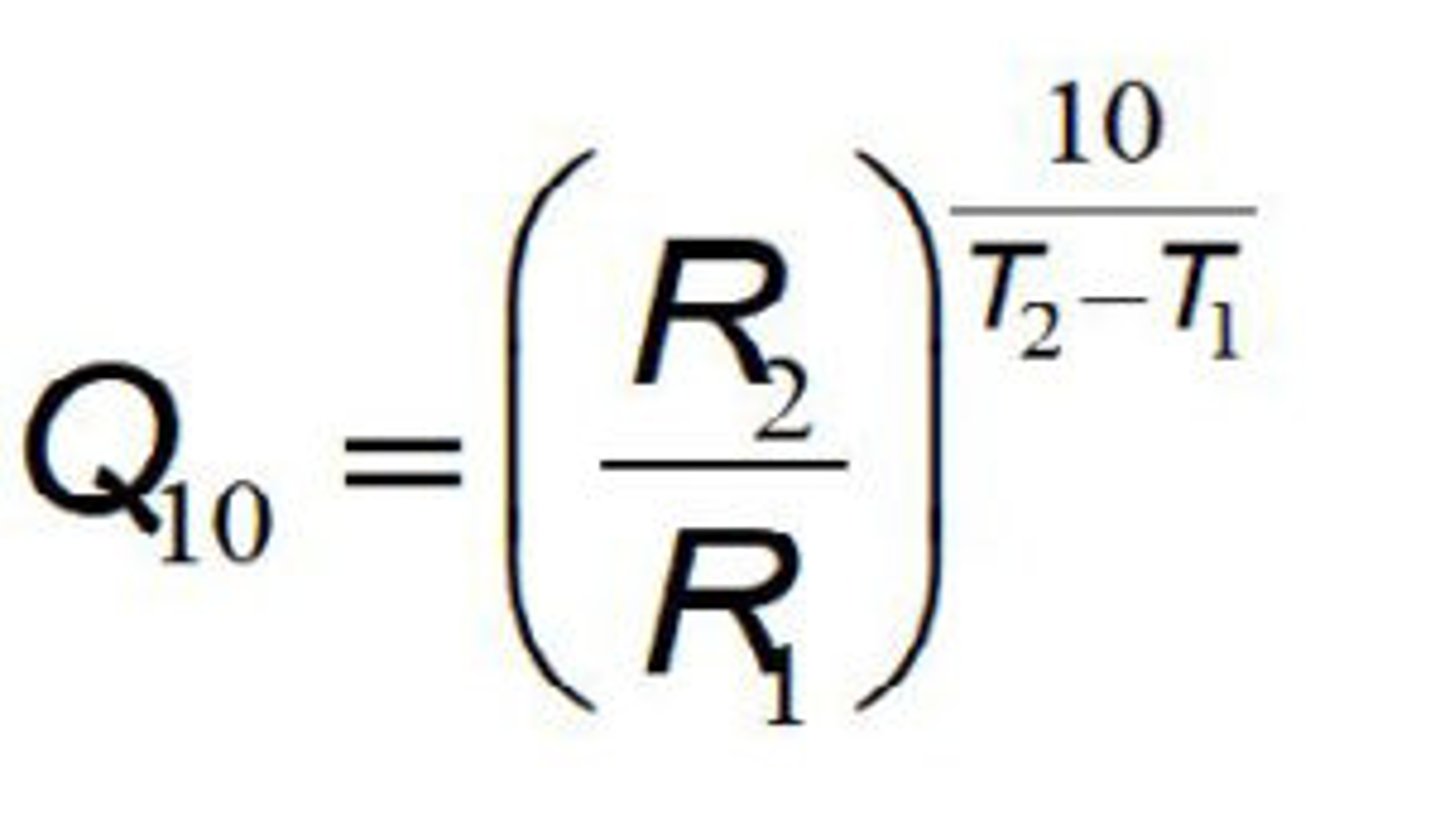
Q10= (Second rate/First rate) ^(10/second temp-first temp).
Q10 being larger means that temperature increase affects the reaction more (typically around 2-3)
CORE PRACTICAL 13: Investigate the effects of temperature on the development of organisms (such as seedling growth rate, brine shrimp hatch rates).
Equipment
5 water baths
Beaker
Sea salt
Egg cysts
Magnifying glass
Method
1)Measure 2g sea salt, add to 100cm3 water in beaker
2)Take a pinch of egg cysts, count 40 with magnifying glass
3)Place 40 in 5 separate beakers
4)Place separate beakers in separate water baths (at 10°C, 15°C, 20°C, 25°C and 30°C)
5)Count number of hatches larvae each day
6) Repeats can be made for each temperature
Graph
Plot number of larvae against time
Statistics
Spearman's rank to determine statistical relationship.
5.20 Understand the way in which scientific conclusions about controversial issues, such as what actions should be taken to reduce climate change or the degree to which humans are affecting climate change, can sometimes depend on who is reaching the conclusions.
The conclusions of decisions regarding climate change may lie in their own best interests
E.g. An oil company would likely not vouch for sanctions on fossil fuels
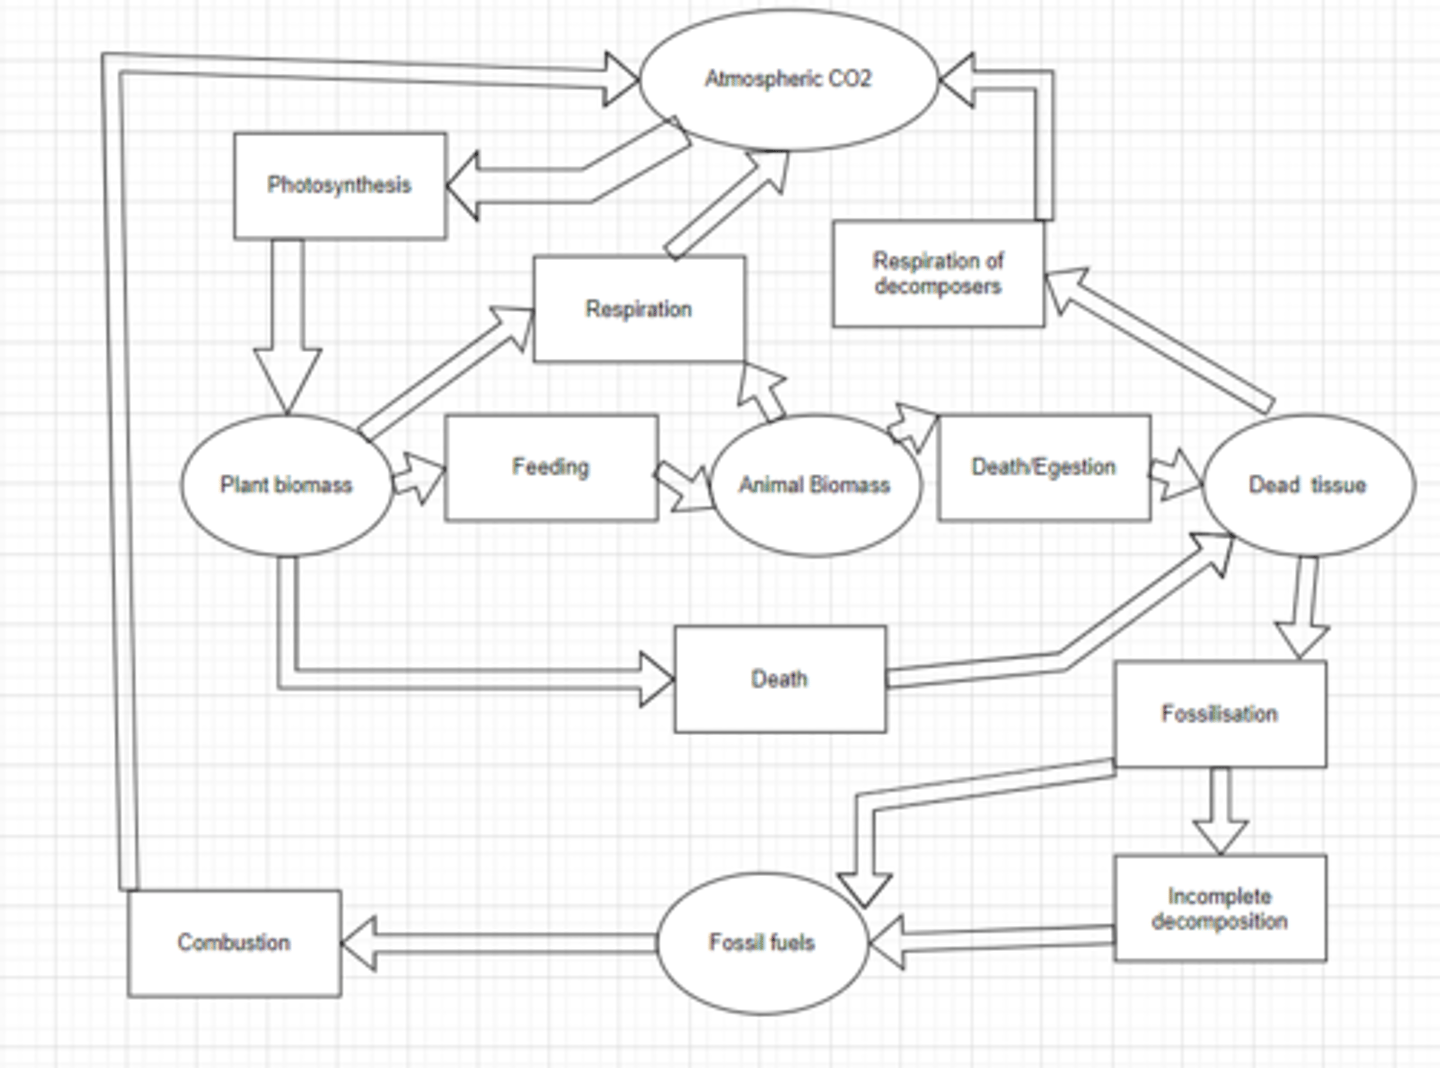
5.21 Understand how knowledge of the carbon cycle can be applied to methods to reduce atmospheric levels of carbon dioxide.
-Reducing combustion of fuels
-Reducing livestock numbers
-Reforestation to increase photosynthesis
(Carbon cycle image attached)
5.22 Understand how reforestation and the use of sustainable resources, including biofuels, are examples of the effective management of the conflict between human needs and conservation.
Examples of the effective management
-Reforestation
-Use of sustainable resources