EQ1- How and why do places vary? In depth study of a local place + a contrasting one
1/35
There's no tags or description
Looks like no tags are added yet.
Name | Mastery | Learn | Test | Matching | Spaced |
|---|
No study sessions yet.
36 Terms
Economic activity can be classified by…
Sector
Type of employment
Employment types examples
Part time
Flexitime
Job sharing
Sub contract
Zero hours contract
Teleworking/ hotdesking
Freelance
Self-employment
Economic sector examples
Primary
Secondary
Tertiary
Quaternary
Quinary
Part time
A person works only some hours, so study or family can be combined with work
Flexitime
Workers can choose start and finish times within set limits
Job sharing
2 people share the same job, so one full time job is shared
Sub contract
Taking on a single job without any commitment to further work once its finished.
Zero hours contract
An arrangement for people to work when it’s available, no fixed hours and no pay if no work
Teleworking/ hotdesking
The ability to use IT to work anywhere and anytime, with no need for a permanent desk in an office.
Freelance
An outside company or self-employed worker can be bought in to get a job done.
Self-employment
Working for oneself rather than for an employer.
Primary sector
Extraction of raw materials: mining, farming
Secondary sector
Manufacturing and processing. iron and steel: car manufacturing
Tertiary sector
Service sector, tourism and banking
Quaternary
High tech research and design
Quinary
Knowledge management, consultancy Leadership/ CEO’s
Show how there are differences in economic activity which is reflected through variation in social factors using data
Millwall, Tower Hamlets
median house price is £55,000 higher than London average
employment rate: 73.6 compared to London avg of 69.2
life expectancy is 83 years compared to E. avg of 81 years
higher % of L4 qualification (57.2% in Millwall, 37.7% London)
Custom House, Newham
median house price is £115,000 lower than London avg
employment rate: 62.8 compared to London avg of 69.2
life expectancy is 5 years below England avg (76 years compared to 81 years)
% of no qualifications is 8% higher than London avg
GVA( gross value added)
Contribution to the economy of a producer, industry or sector.
Impact of inequalities of pay in different sectors + types of employment on quality of life
Where there is a higher GVA(£22,000+), there is more employment in financial + insurance services (higher paying). e.g. SE England
there is a higher life expectancy seen in these areas
where there is lower GVA, there is more employment in manufacturing and agriculture (lower paying). e.g. N England
there is a lower % of people reporting good health e.g. N England only has 73.5-78.7% compared to SE England with 84.5-88.1%
In which two ways can a place change overtime?
function
demographic characteristics
What are the 4 functions
administrative: government
commercial: office-based e.g. business, banking
retail: restaurants, clothing, etc.
industrial: transport, factories, ports
2 types of functions
Specialist function: historically been in larger settlements (e.g. banks and department stores)
Low-order function: tend to be everywhere (e.g. grocery stores or pubs)
Give 3 examples of demographic characteristics
age structure
gentrification
ethnic composition
Gentrification
a change in the social structure of a location. It often improves the social structure but can be seen to be an unfair process.
Steps of gentrification
Affluent(wealthy) people move into the area
New money in the area leads to the improvement in the place- renovation of buildings, etc.
More middle-class people attracted to area, landlords will increase price of rent
People who live there before are priced out
Overall value of area increases- new resources, businesses
How has the function of Millwall and Custom house changed from 1980?
Millwall
Change from industrial(ports(Vitoria Dock), factories(Chemical works)), dockyards/shipyards to retail(Canary Wharf shopping centre) and commercial(HSBC, J.P. Morgan) +global financial hub
Custom House
Retail: housing, local supermarkets, Residential areas
How has demographic characteristics changed in Millwall + Custom House?
Millwall: gentrification
% of social grades D-E fell from 41-32% from 1980-90 due to more wealthy people moving in with higher paying jobs
Custom House: Ethnic change
56% white pop. 1991 decreased to 29% in 2011
African pop. doubled from 1991-2011
Newham: age structure
under 20yrs: 30% of population
64+: -2.3% change between 2011-2007
age 20-64: 13.7% increase between 2011-2007
Reasons for change - with reference to London Docklands
PHYSICAL FACTORS: River Thames silted up + boats getting larger so couldn’t come this far upstream. So Docks moved downstream to Tilbury, away from London
ACCESSIBILITY: Containerisation needed fewer dockers
Manufacturing decline meant portside industries such as food refining closed down
HISTORICAL DEVELOPMENT: Sub-standard housing built in 1950s +60s were built to replace bomb damaged housing from WW2.
How can change be measured?
employment trends
demographic changes
land use changes
levels of deprivation
Deprivation
The loss of (or access to) services which underpin quality of life.
e.g. housing, income, education, health, transport
What is the IMD?
Stands for Index of Multiple Deprivation
ranks deprivation from 1st- most deprived area
has 7 domains:
Income deprivation- income support, tax credit, disability credit, asylum seeker
Employment deprivation- unemployment benefit, incapability benefit, disability allowance, new deal 18-24s
Health deprivation
Education, skills, training deprivation
barriers to housing
crime
living environment deprivation
Tower Hamlets ranked 3rd most deprived of 326 districts in England in 2007. This improved to 7th in 2010 and 81st in 2015.
Millwall is still 7 000 out of 32 000 in most deprived areas in England.
Custom house is ranked 1 500 out of 32 000 in most deprived areas in England.
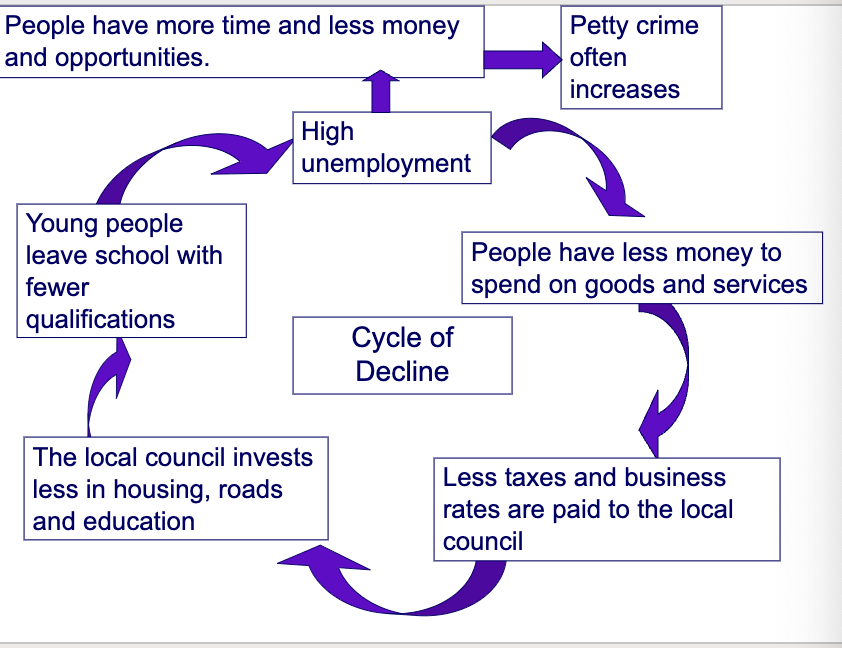
Cycle of decline
London Docklands change in data in 1980s
Employment: 30,000 jobs lost, male unemployment 60% (6x UK avg)
Land use: 50% Docklands derelict
Demographics: E London pop. declined 100,000
Deprivation- living environment: 30% housing unsatisfactory for human habitation
Regional + national influences on characteristics of London Docklands
LDDC(London Docklands development corporation(1981-1998)) aimed to
1. economically regenerate area by attracting private investment
2. physically regenerate space of Docklands to aid the investment
3. improve living conditions and prospects of the community of the Docklands
LOCAL PLANNING CHANGE: LDDC enterprise zone
no corporation tax for 10 years
streamlined planning
newspaper companies moved from Fleet street to Isle of Dogs 1980
Transport improvements
Roads- £450m Limehouse link connects Docklands to Central London
— Housing knocked down to build the tunnel
Bridges- West India Dock
DLR- 1987, cost £73m
— Didn’t run in evenings + limited on weekends
Jubilee line extension
— subject to delays + finished late in 2000
International + global influences on characteristics of London Docklands
Transport, containerisation
London City Airport- 1987, situated in Royal Docks, used for business flights for quick access to Docklands
Demographic change
migration- ethnic changes, pop. turnover(41-50+% turnover 2007-2009), gentrification
Deregulation 1980s- International businesses in enterpise zone(TNC’S)
growth of financial centre at HSBC, Bank of America
How has economic + social changes influenced people’s identities? (different attitudes towards change)
Original pop: don’t want to be kicked out due to house price increase from £50k 2 bedroom flat to 200,000 (1985-1987)- becomes unaffordable. Gentrification replaces low income OG pop with high income new residents- loss of community.
Migrating pop: improvement is being seen as employment increased by 57,000 in the UDA from 1981-1998, cultural diversity is improving- seen through demographic change e.g. African pop. doubled from 1991-2011
Businesses: improvement is being seen as 41421 employees attracted, no. of firms increased by 1,600 between 1981-1998.