PSY 1900 Quiz 2
 Call Kai
 Learn
Learn Practice Test
 Spaced Repetition
 Match
Match Flashcards
 Knowt Play
1/25

There's no tags or description
Looks like no tags are added yet.
Name | Mastery | Learn | Test | Matching | Spaced | Call with Kai | Chat |
|---|
No analytics yet
Send a link to your students to track their progress
26 Terms
central tendency
typical
center
middle value
mean
average, arithmetic mean
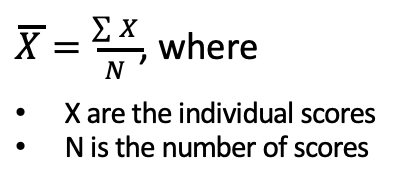
x̄ vs. μ
x̄ = sample mean
μ = population mean
median
the middle value

mode
most common value
highest frequency
range
difference between the smallest and largest scores
first quartile

third quartile
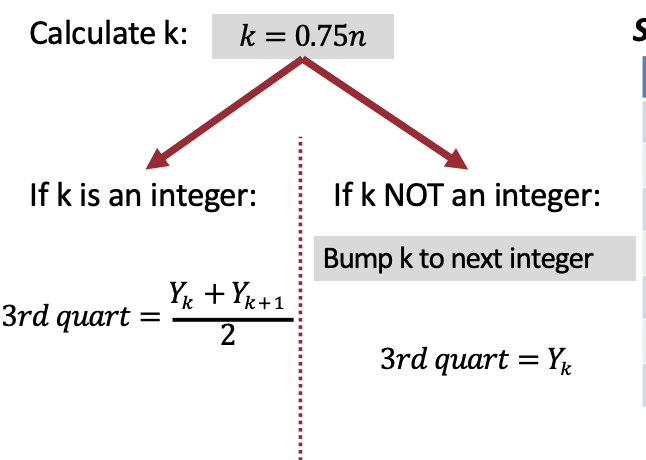
interquartile range
3rd quartile – 1st quartile
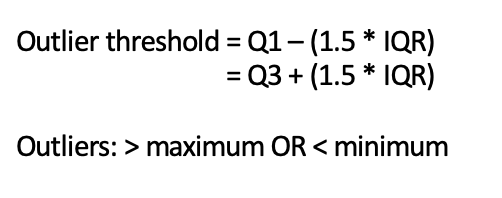
outlier threshold
variance
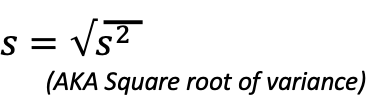
average amount a score deviates from the average score
standard deviation
coefficient of variation

descriptive statistics of central tendency
mean, median, mode
descriptive statistics of spread
range, interquartile range, variance, standard deviation, coefficient of variation
frequency
number of occurrences of a value (or range of values) in a sample
frequency distribution
frequencies of EACH value (or range of values) in a sample
relative frequency
proportion of occurrences of a value (or range of values) in a sample
relative frequency distribution
relative frequency of EACH value (or range) in a sample
graphs for categorical variables
1 variable
frequency table
pie graphs (relative)
bar chart (frequency or relative)
2 variables
grouped bar graph
mosaic plot
graphs for numerical variables
1 variable
frequency table
histogram
line graph
strip chart
box plot
2 variables
scatter plot
line graph
map
graphs for numerical & categorical variables (1 each)
strip chart
box plot
multiple histograms
WARNINGS!
FREQUENCY IS NOT A VARIABLE.
PARTICIPANTS ARE NOT A VARIABLE.
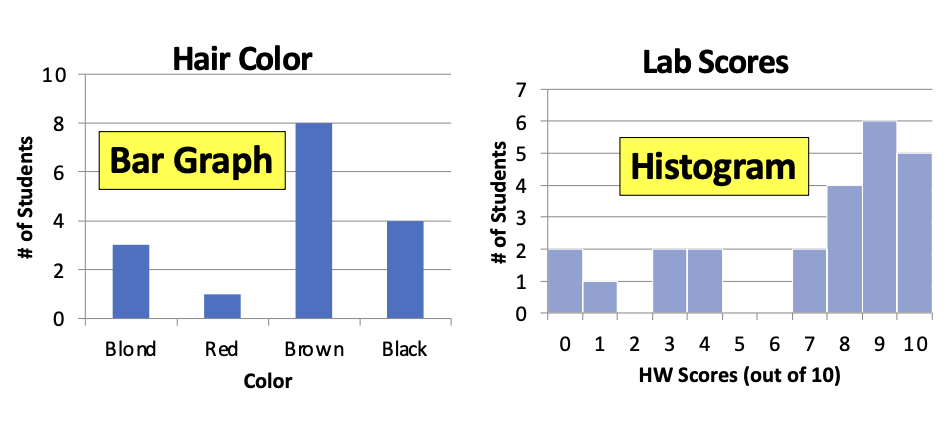
bar graph vs. histogram
bar graph = categorical (gaps)
histogram = numerical (no gaps) → use line graph for time
types of distributions
normal
bimodal
skewed (direction based on tail)
uniform
describing distributions
is there any association? strong or weak?
unimodal vs. bimodal
skew
peaks
outliers