Science as a Way of Knowing - Scientific Method Vocabulary
1/28
Earn XP
Description and Tags
Vocabulary flashcards covering the steps of the scientific method, variables, data types, data analysis, conclusions, and types of graphs
Name | Mastery | Learn | Test | Matching | Spaced |
|---|
No study sessions yet.
29 Terms
Scientific Method
A systematic process for investigating questions: ask a question, perform background research, form a hypothesis, conduct experiments, record and analyze data, draw conclusions, and communicate results.
Question
The specific inquiry you want to answer in a science investigation.
Background Research
The step where you determine what you already know and learn more about your topic.
Hypothesis
An educated guess about what will happen in an investigation, usually written as an If…Then statement and based on observations.
If…Then Statement
A sentence structure used to state a hypothesis, describing how the independent variable affects the dependent variable.
Independent Variable
The variable that the experimenter deliberately changes to test its effect. What “I” change.
Dependent Variable
The variable that is measured or observed in response to changes in the independent variable.
Control (Constants)
Elements of the experiment kept the same across trials to ensure a fair test (e.g., same amount of time, water, fertilizer).
Observations
Fact-based notes gathered through the senses during an experiment.
Inferences
Conclusions or interpretations drawn from observations about what happened in the experiment.
Quantitative Data
Data that can be measured and recorded using numbers.
Qualitative Data
Descriptive data using words.
Graphs and Charts
Visual tools used to display data and help analyze trends.
Trend
A general pattern or direction observed in data.
Analyze Data
Examine data using tools like graphs and charts to identify patterns and draw conclusions.
Draw a Conclusion
Decide whether the hypothesis was supported or rejected, summarize findings, and suggest future improvements.
Experiment
The procedure designed to test a hypothesis by manipulating the independent variable and observing the effect on the dependent variable.
Independent Variable Examples
Examples of factors you change in an experiment, such as type of seed, amount of light, or music genre.
Dependent Variable Examples
Examples of outcomes you measure, such as plant height, leaf size, or test scores.
Control Examples
Examples of constants to keep the test fair, such as same time, same amount of water, or same fertilizer.
X-Axis
The horizontal line at the bottom of a graph. Always represents the independent variable.
Y-Axis
The vertical line at the top of a graph. Always represents the dependent variable (what is being measure)
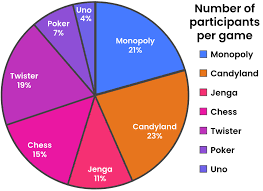
Pie Chart
A circular graph that shows proportions of a whole, with each slice representing a category's contribution to the total. Always adds to 100%
Bar Graph
A type of graph that displays data using rectangular columns to represent the frequency or value of different categories.

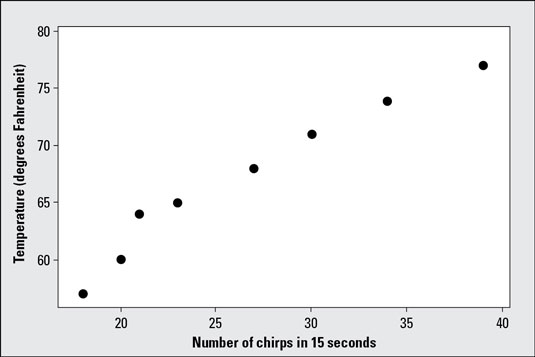
Scatterplot
A type of graph that uses dots to represent the values obtained for two different variables, showing their relationship and correlation.
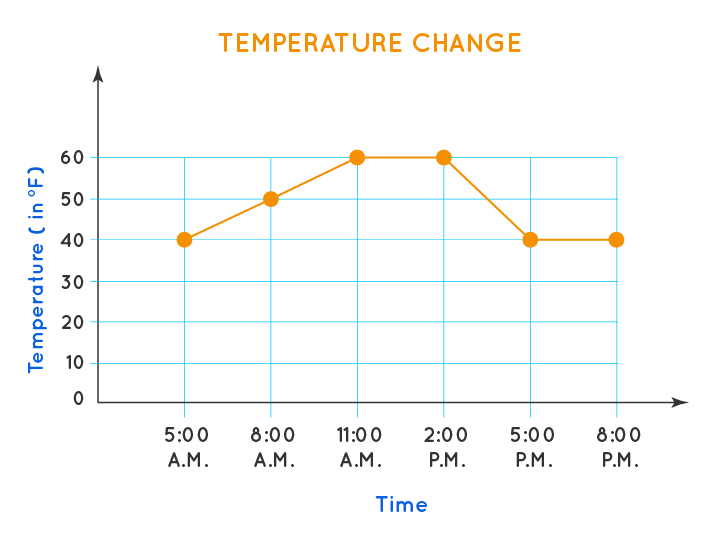
Line Graph
A type of chart that displays information as a series of data points connected by straight line segments, typically used to show trends over time.
Mean
The average of a set of values, calculated by adding all the numbers together and dividing by the total number of values.
Median
The middle value of a set of numbers when arranged in ascending or descending order.
Mode
The value that appears most frequently in a dataset.