AP Calculus AB Unit 1: Limits and Continuity
 Call Kai
 Learn
Learn Practice Test
 Spaced Repetition
 Match
Match Flashcards
 Knowt Play
1/159

There's no tags or description
Looks like no tags are added yet.
Name | Mastery | Learn | Test | Matching | Spaced | Call with Kai | Chat |
|---|
No analytics yet
Send a link to your students to track their progress
160 Terms
Horizontal Asymptote
The line y = b is a horizontal asymptote of the graph of a function y = f(x) if either limx→∞ f(x) = b or limx→-∞ f(x) = b.
sin0
0
sin(π/6)
1/2
sin(π/4)
1/√2 = √2/2
sin(π/3)
√3/2
sin (π/2)
1
sinπ
0
sin(3π/2)
-1
sin2π
0
cos0
1
cos(π/6)
√3/2
cos(π/4)
1/√2 = √2/2
cos(π/2)
0
cosπ
-1
cos(3π/2)
0
cos2π
1
tan0
0
tan(π/6)
1/√3 = √3/3
tan(π/4)
1
tan(π/3)
√3
tan(π/2)
undefined
tanθ (in terms of sine and/or cosine)
sinθ/cosθ
cotθ (in terms of sine and/or cosine)
1/tanθ
cscθ (in terms of sine and/or cosine)
1/sinθ
secθ (in terms of sine and/or cosine)
1/cosθ
An odd function is...
... symmetric with respect to the origin, like y=x^3, y=sinx, or y=tanx. f(-x) = -f(x)
graph of y = sinx

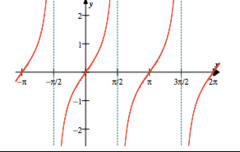
graph of y = tanx
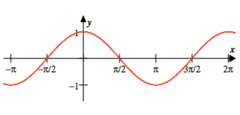
graph of y = cosx
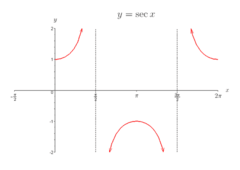
graph of y = secx
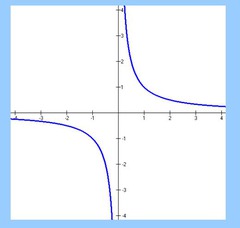
graph of y = 1/x
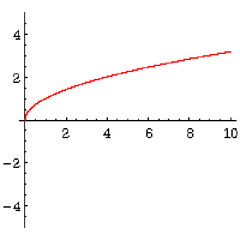
graph of y =√x
graph of y = √1-x^2

graph of y = |x|

graph of y = lnx

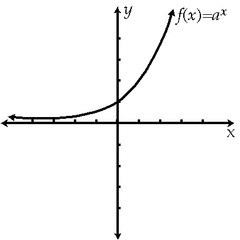
graph of y = e^x
An even function is...
...symmetric with respect to the y-axis (like y = x^2, y = cosx, or y = |x|
ƒ(-x) = -ƒ(x)
A horizontal asymptote occurs at y = b when...
... lim ƒ (x) = b
x →±∞
A vertical asymptote occurs at x = a when...
... lim ƒ ( x ) = ±∞
x→a⁺⁻
indicated by substitution yielding ƒ(a) = nonzero/0
ƒ(x) is continuous at x = c when...
1. ƒ(c) exists
2. lim ƒ(x) exists; and
x→c
3.lim ƒ(x) = f(c)
x→c
Intermediate Value Theorem: If f is continuous on [a,b], then...
... there exists some c in [a,b] such that f(c) = k for any y-value k between f(a) and f(b)
Average rate of change is...
∆y/∆x = (ƒ(b) - f(a)) / (b-a)
A secant line is...
..the line connecting two points on a curve.
Instantaneous rate of change is...
lim (ƒ(a+h) - ƒ(a)) / h
h→0
A tangent line is...
...the line through a point on a curve with slope equal to the slope of the curve at that point.
A normal line is...
... the line perpendicular to the tangent line at the point of tangency.
Point-slope form of a linear equation
y-y₁ = m(x-x₁)
Verbal Definition of a Limit
The y-value that a function approaches as the x-value gets closer and closer to a point c from left and right.

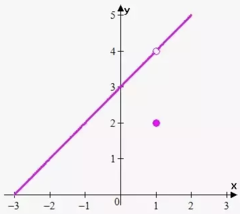
How can a limit exist at a point where a function value does not exist?
Where a hiccup function exists, where there is a hole at c, but the graph approaches the same y-value as it approaches c from the left and right.
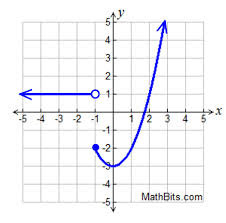
How can a function value exist at a point where a limit does not exist?
If c does not approach the same y-value from both side, then the limit does not exist, but there is a function value when approaching c from either left or right.
Three cases in which a limit DNE (does not exist):
1. differing behavior from left and right
2. unbounded behavior (limit approaching infinity)
3. oscillating behavior
What is an indeterminate form and what does it indicate?
0/0 is called an indeterminate form that is yielded when using direct substitution to find a limit value and indicates that there is a hole in the graph. Therefore, another method must be used to find the limit.
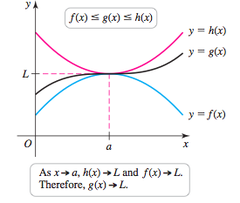
The Sandwich Theorem
If f(x) ≤ g(x) ≤ h(x) for all values where x ≠ c in some interval about c, and limx→c f(x) = limx→c h(x) = L, then limx→c g(x) = L.
- therefore all limits have the same value at y values at c
If direct substitution yields the indeterminate form 0/0, try:
1. simplifying complex fractions
2. factor (trnomial, GCF, difference of two squares)
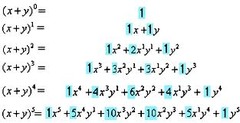
3. expanding a binomial power
Pascal's Triangle
Why do we only care about certain terms in the numerator and denominator?
b/c the terms with the highest degrees in the denominator and numerator increase the fastest
End behavior and asymptotes when the larger degree is in the denominator?
for rational functions f(x) = ax^m+... and g(x) = bx^n +...
End Behavior: limx→±∞ f(x)/g(x) = 0
Horizontal Asymptote: y = 0
End behavior and asymptotes when the largest degrees in the denominator and numerator are equal?
for rational functions f(x) = ax^m+... and g(x) = bx^n +...
End Behavior: limx→±∞ f(x)/g(x) = a/b
Horizontal Asymptote: y = a/b [the ratio of leading coefficients]
End behavior and asymptotes when the largest degree is in the numerator?
for rational functions f(x) = ax^m+... and g(x) = bx^n +...
End Behavior: limx→±∞ f(x)/g(x) = DNE
Horizontal Asymptote: no horizontal asymptotes
What must be true about a function if it has a horizontal asymptote?
The limit as x approaches ±∞ exists.
If a function has a horizontal asymptote y = k, what must be true about this function?
The limit as x approaches ±∞ of f(x) exists.
List these functions from the slowest relative growth rate to the fastest relative growth rate based on f(100) [explain why]:
cosx
a^x , where a > 1
x^n, where n > 0
logx
1. cosx [b/c the range of cosx always stays between -1 and 1
2. logx [b/c this logarithms always produces a gradual concave down slope]
3. x^n [b/c a polynomial is only ever increasing based on a constrained exponent, so x is the variable]
4. a^x [b/c an exponential is continuously compounded based on a variable exponent x, so as the exponential approaches infinity, the exponential function will always be greater than the polynomial functions; however it is important to note that an exponential function, at some point, may be less than a polynomial]
How can a function have more than one horizontal asymptote?
If the value of the limit as x approaches -∞ of f(x) is different from the value of the limit as x approaches +∞ of f(x).
Why is lim x→-∞ e^x equivalent to lim x→∞ 1/e^x?
b/c e^-∞ = 1/e^∞
Vertical Asymptote
line x = a is a vertical asymptote of the graph of a function y = f(x) if either limx→a⁺ f(x) = ±∞ or limx→a⁻ f(x) = ±∞
-occurs when a value of x makes the denominator 0
-0/0 means there's a hole in the graph
-nonzero/0 means a vertical asymptote (limit DNE)
How can we tell whether the function approaches +∞ or −∞ at a vertical asymptote?
1. find which value(s) of x makes the denominator zero and the value(s) of x that makes the numerator zero
2. put the zeroes on a line and test the direction of the graph on the left and right of the x value that makes the denominator zero
3. the sign (positive or negative) of evaluated number on the graph towards the left and right of the x value making the denominator zero tells you whether the function if approaching ±∞
- if the graph behavior towards the left/right if negative, then the graph is approaching -∞ and vice-versa
Approaching Without Reaching
Getting closer and closer to a value or point without actually reaching it.
Value the Function Approaches
This is the number that the output of a function gets closer to as the input approaches a certain value.
Limiting Value
The limiting value is the value that the outputs of a function approach as the input approaches a certain value.
Function Output Trends
Function Output Trends mean how the values of a function change or behave as the inputs approach a certain number.
Predicted Behavior
The expected output of a function near a specific input, based on observing its values nearer and nearer that input.
Closer and Closer Behavior
The idea that the function's output gets increasingly near a certain number as the input approaches a specific value.
Tending Toward a Value
Tending toward a value means that as the input changes, the output or variable moves closer and closer to a certain number, which we call the limit.
Nearby Values
Nearby values are the numbers that are close to a particular number on the number line. We look at these values to understand how a function behaves near that number.
Getting Arbitrarily Close
Getting arbitrarily close means that a value can be made as near as we want to another value by choosing inputs close enough. There is no fixed distance; we can make the difference smaller than any positive number.
Arbitrary Closeness Concept
The arbitrary closeness concept means that for any small positive number, no matter how tiny, we can find an input value close enough to a point so that the function's output is within that small distance from the limit.
Not Necessarily Reaching the Point
It means that a function can approach a value arbitrarily closely as the variable approaches a point, even if the function never equals that value or is not defined at the point itself.
Limit Expression
A math expression written using limit notation that describes the value a function approaches when the input nears a specific number.
Non-Uniqueness Implies Nonexistence
If two different limits are found when approaching a point from different sides, then the overall limit at that point does not exist.
Uniqueness of the Limit
If a limit of a function at a point exists, it is the only limit at that point; there cannot be two different limits for the same input.
Limit Symbol
The limit symbol is written as lim and is used to indicate that we are finding the limit of a function as a variable approaches a certain value.
Existence of Limit
The limit of a function at a point exists only if the values the function approaches from both sides are equal and finite as the input nears that point.
Limit Notation
Limit notation is how we write limits using symbols and expressions to describe what value a function approaches as the input approaches a certain point.
Variable Tending Expression
A variable tending expression shows the variable getting closer and closer to a specific value, often written as “𝑥 → 𝑎,” where 𝑥 is the variable and 𝑎 is the value.
Visual Interpretation of Limits
Visual interpretation of limits means understanding how function values behave near a specific point by looking at the graph of the function.
Graphical Behavior Near Point
Graphical behavior near a point shows how a function behaves on the graph when the input values are very close to that point from both sides.
Equality of Left-Hand and Right-Hand Limits
The limit at a point is the same from both directions, so the left-hand limit and the right-hand limit must be equal for the two-sided limit to exist.
Approach from Right on Graph
Approach from right on a graph refers to observing how the function behaves as the input values get close to a point from larger values on the right side.
One-Sided Limit on Graph
A one-sided limit on a graph shows the behavior of a function's values as the input approaches a specific point from only one side, either from the left or the right.
Approach from Left on Graph
Approach from left on a graph means looking at the values of a function as the input gets closer to a particular point coming from smaller values, or from the left side on the x-axis.
Right-Hand Limit
The right-hand limit of a function at a point is the value that the function approaches as the input gets closer to that point from values greater than the point. It observes the function's behavior from the right side only.
Left-Hand Limit
The left-hand limit of a function at a point is the value that the function approaches as the input gets closer to that point from values less than the point. It looks at the behavior of the function from the left side only.
Limit From Graph Shape
Limit from graph shape means estimating the limit by looking at the overall form and trend of the graph near a point. The shape suggests what value the function is getting close to, even if the function is not defined exactly at that point.
One-Sided Limits Graphically
One-sided limits graphically focus on the limit of a function as the input moves towards a point from only one side — either the left or the right. This helps understand cases where the function’s behavior is different on each side of the point.
Left-Hand and Right-Hand Limits from Graphs
Left-hand and right-hand limits from graphs are determined by observing the function values as the inputs approach a point from the left side and the right side. These limits show whether the function approaches the same value from both directions or not.
Non-Existence via Divergent One-Sided Limits
Non-existence via divergent one-sided limits happens when the limit of a function approaching a point from the left is different from the limit approaching from the right, or one of the limits does not exist. In such cases, the two-sided limit does not exist.
Comparing Tables of Values for One-Sided Limits
A table of values helps estimate one-sided limits by listing function outputs for inputs that get closer and closer to the limit point from one direction. Comparing those tables from the left side and the right side shows how function values behave near that point, which helps to understand if the two-sided limit exists or not.
Left-Hand Limit Table
A Left-Hand Limit Table lists function values for inputs approaching a point from the left side, or values less than the target point.
Pattern Recognition in Values
Observing the function values in a numerical table to see if they approach a single number as the input gets closer to the limit point.
Testing Values Closer To Limit
Testing Values Closer To Limit involves finding function outputs for inputs increasingly closer to the limit point, to better approximate the limit value.