STATS FINAL: Chi-Square Tests
1/15
There's no tags or description
Looks like no tags are added yet.
Name | Mastery | Learn | Test | Matching | Spaced | Call with Kai |
|---|
No study sessions yet.
16 Terms
What are chi-square tests?
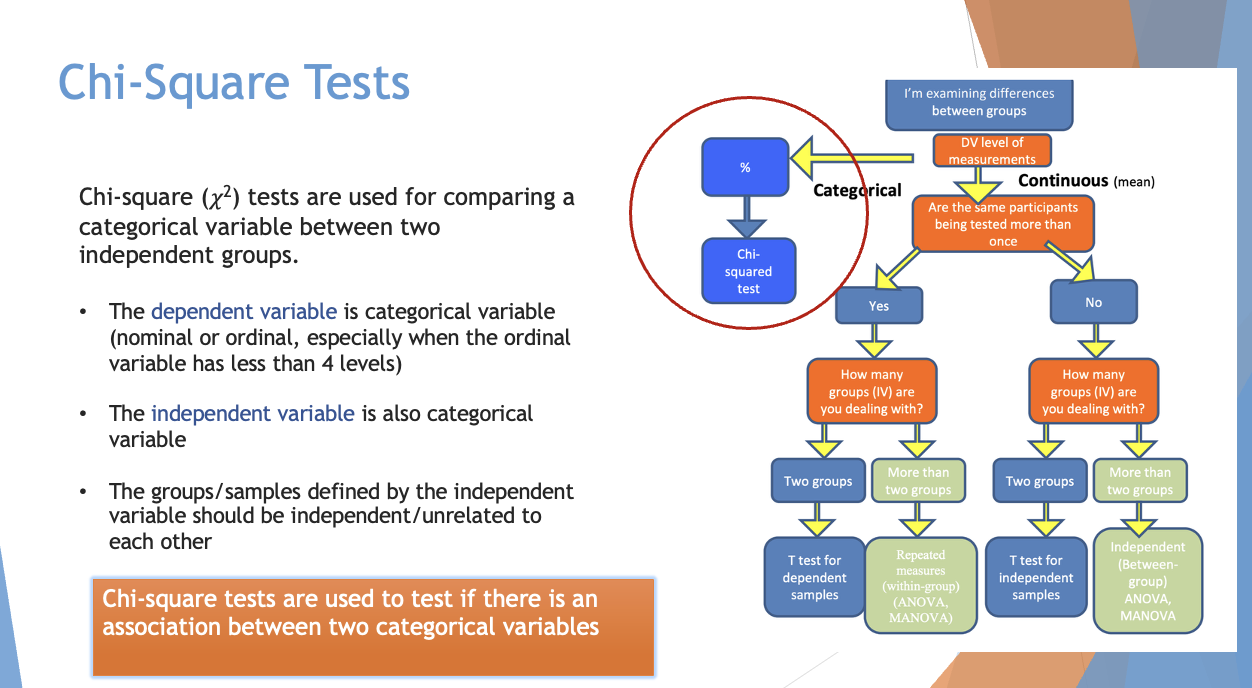
they’re used for comparing a categorical variable between two independent groups
the responding variable is categorical (nominal or ordinal)
Independant variable is also categorical
**•The groups/samples defined by the manipulated variable should be independent/unrelated to each other
What are the key characteristics of a chi-square test?
a non-parametric test ==> doesn’t rely on underlying assumptions like normality because it’s specifically designed for categorical data
where the data information contain counts or frequencies
Focused on frequency distributions: uThe chi-square test examines the distribution of observed frequencies in comparison to expected frequencies under a specific hypothesis.
What are the assumptions for a chi-square test:
independence of observations ==> a must
Mutually Exclusive Categories ===>Each observation belongs to only one category per variable.
categorical data for both manipulated and responding variable
Sufficiently Large Expected Frequencies
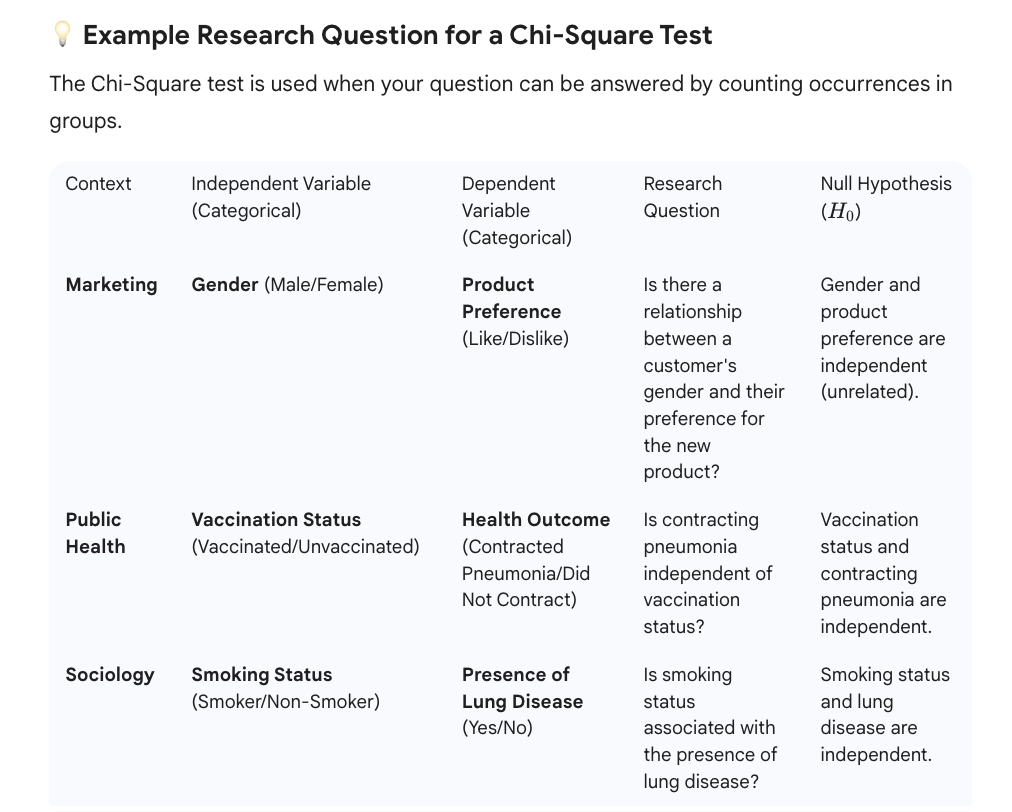
Chi-Square test is used when you have two or more categorical variables and you want to see if they are related (dependent) or independent (unrelated).
So the “experiment” revolves around things like:
In short, the Chi-Square test determines if the proportions of one category (e.g., the proportion of "Likes") are the same across the groups of the other category (e.g., Male vs. Female).
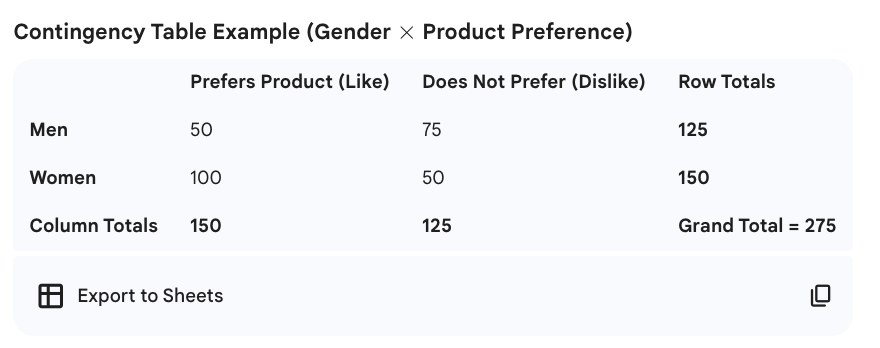
What is a contingency table:
A Contingency Table (also called a cross-tabulation or cross-tab) is a table that displays the frequencies (counts) of observations for every combination of your two categorical variables.
Observed vs. Expected frequencies:
observed ==> what we actually count
expected ==> what the count should be if the null hypothesis were true
Observed Frequencies ($O$): These are the actual counts you recorded in your study, representing the real-world data collected for each combination of categories (the numbers inside the contingency table cells).
Expected Frequencies ($E$): These are the counts you would theoretically expect to find in each cell if there were absolutely no relationship between the two variables (if the null hypothesis were true).
The Chi-Square test then compares $O$ and $E$;
the bigger the difference between what you observed and what you expected, the stronger the evidence that the two categorical variables are actually related.
What is the null hypothesis for a chi-square test?
Null (H0): There is no association between the two categorical variables (they are independent).
** SO WE ASSUME INDEPENDENCE BECAUSE WE’RE TRYING TO TEST IF THERE IS AN ASSOCIATION
for us to use a chi-square test, the expected frequency has to be:
greater or = 5, if it’s less we use fisher’s test
What is the statistic we calculate for chi-square test?
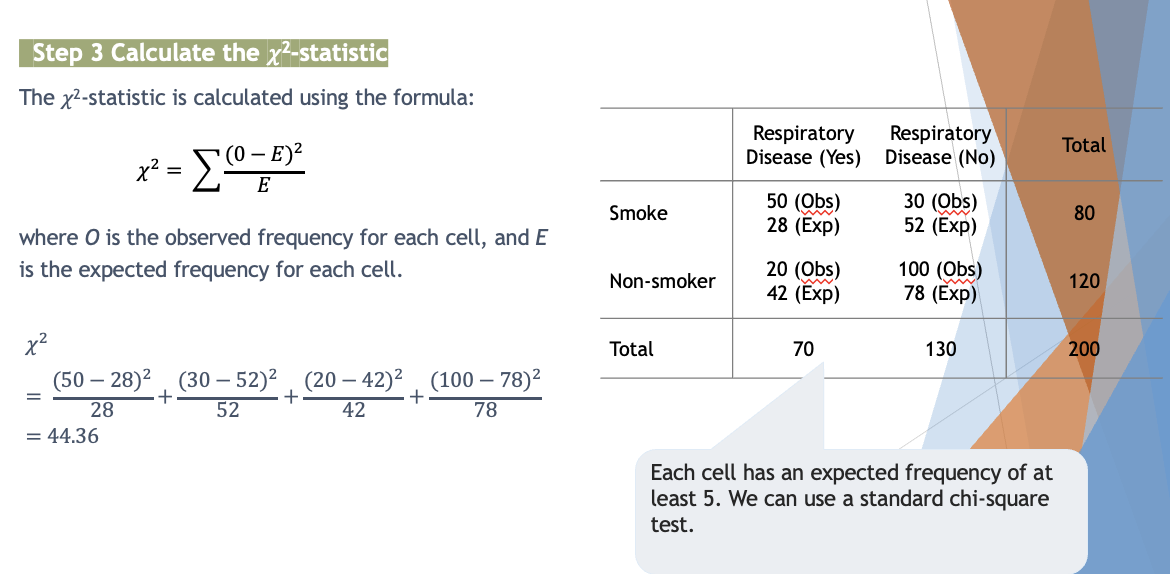
•𝜒2-statistic
How do we calculate expected frequency for per cell?
Respiratory Disease (Yes) | Respiratory Disease (No) | Total | |
Smoke | 50 (A) | 30 (B) | 80 (A+B) |
Non-smoker | 20 (C) | 100 (D) | 120 (C+D) |
Total | 70 (A+C) | 130 (B+D) | 200 (A+B+C+D) |
row x colum/total

How do we calculate 𝜒2-statistic?
Each cell has an expected frequency of at least 5. We can use a standard chi-square test.
Degrees of freedom for a chi-square test is:
Df = (r−1) * (c−1)
where r is the number of rows and c is the number of columns.
Rows are horizontal: ROW HO
columns are vertical
The calculated 𝜒2-statistic has to be > than the critical value (find via. a and df), we reject null
Then there is an association
What are the limitations of chi-square tests?
uHighly sensitive to sample size
uSensitive to small frequencies (<5)
uIt does not provide information about the strength and direction of the relationship.
The Chi-Square test determines if a statistical relationship exists between two categorical variables by comparing the counts you observed to what you expected under the assumption of no link.
However, its limitation is that a significant result only confirms the association and does not tell you the strength, direction, or where exactly the differences lie within the categories. ==> like if smoking cause pneumonia.
What is the fisher’s exact test?
used when any expected frequencies are less than 5