AP Statistics Chapter 3
1/22
There's no tags or description
Looks like no tags are added yet.
Name | Mastery | Learn | Test | Matching | Spaced |
|---|
No study sessions yet.
23 Terms
For what type of variables should we use a scatterplot?
What should we include when creating a scatterplot?
2 quantitative variables
Explanatory = x-axis
Response = y - axis
key points to cover when describing a scatterplot
FoCUSeD
Form: _________
Context: ______
Unusual: points that deviate from the pattern
Strength: ________
Direction: _______
linear, curved, scattered
explanatory + response variables
strong, moderate, weak
positive or negative
What is a succinct way of describing scatterplots?
There is a strength, direction, form relationship between explanatory and response, with unusual points.
Correlation measures the ___ and ___ of the ____ relationship btwn 2 quantitative variables
r is _____ if x and y are interchanged.
r is _____ if x and/or y are rescaled.
r units:
strength, direction, linear
umchanged
unchanged
none
What is that range of correlation, what values translate to a strong or weak correlation?
-1 to 1, |coefficient| —> .9 to 1 = A, .8-.9 = B, etc. (weaker as u get closer to 0)
How to calculate correlation coefficient (r) when given data points?
make table with __,__ ,__ ,__ , __ for each value
find mean and standard deviations of x values and y values
find _____ of each x and y value based on that, then the product
___ the products, divide by ____
x, y, zx, zy, product of zx * zy
z scores, product
add, n-1
Residuals: The error (vertical distance) between a linear model’s prediction and the observed data point.
Residual = ______
actual value - predicted value
y-ŷ
least squares regression line form
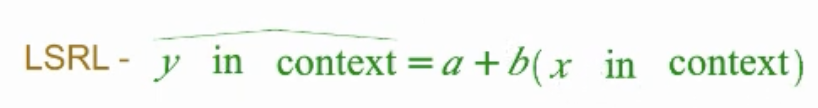
Interpret the slope in context.
As x increases by 1 unit, y is predicted to increase by b units
x and y shud be in context
Interpret the y-intercept in context. Use this sentence stem:
When x is zero units, y is predicted to be a units.
x and y shud be in context
the unique line that minimizes the sum of the squares of the vertical distances (residuals) between each data point and the line itself, predicts a value of y for a given value of x
least-squares regression line (LSRL)
Creating a LSRL
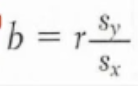
What formula do we use to find the slope?
What point does the LSRL always go through?
(x̄, ȳ)
Then fill in the equation ŷ=a+bx
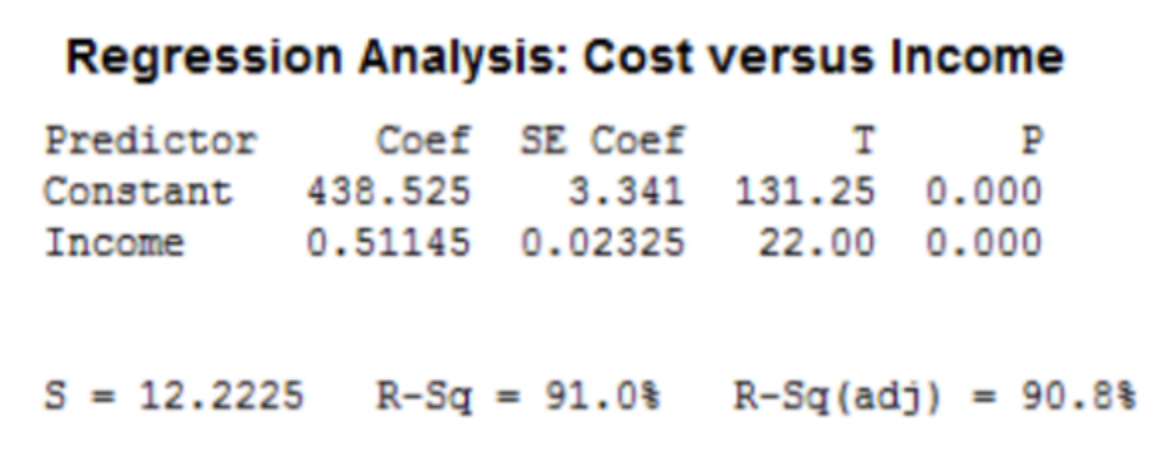
understanding regression outputs
slope =
y-int =
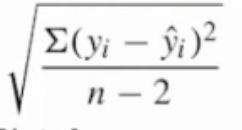
standard deviation of residuals =
r =
income
constant
s
√r²
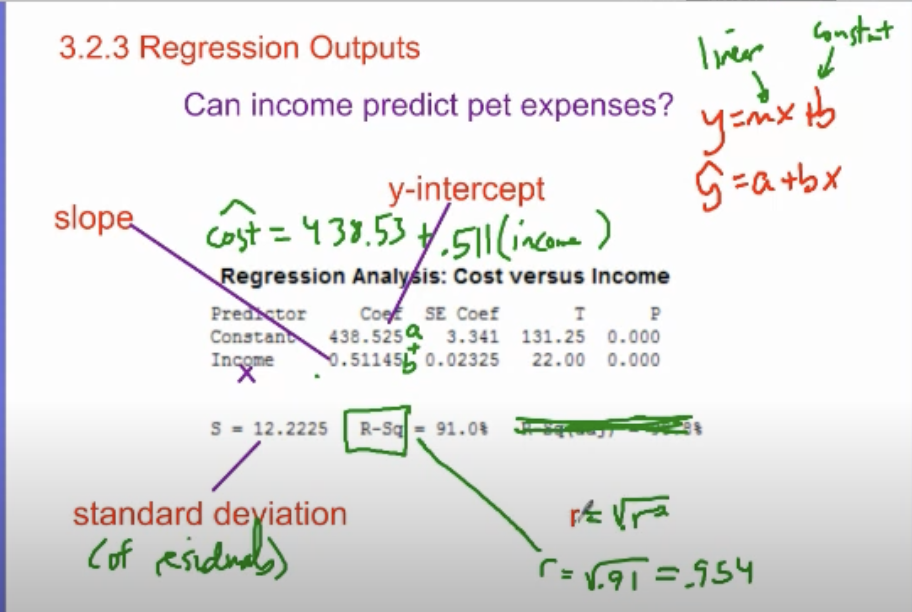
s = standard deviation of residuals
average distance from ŷ to actual y is s (units for y)
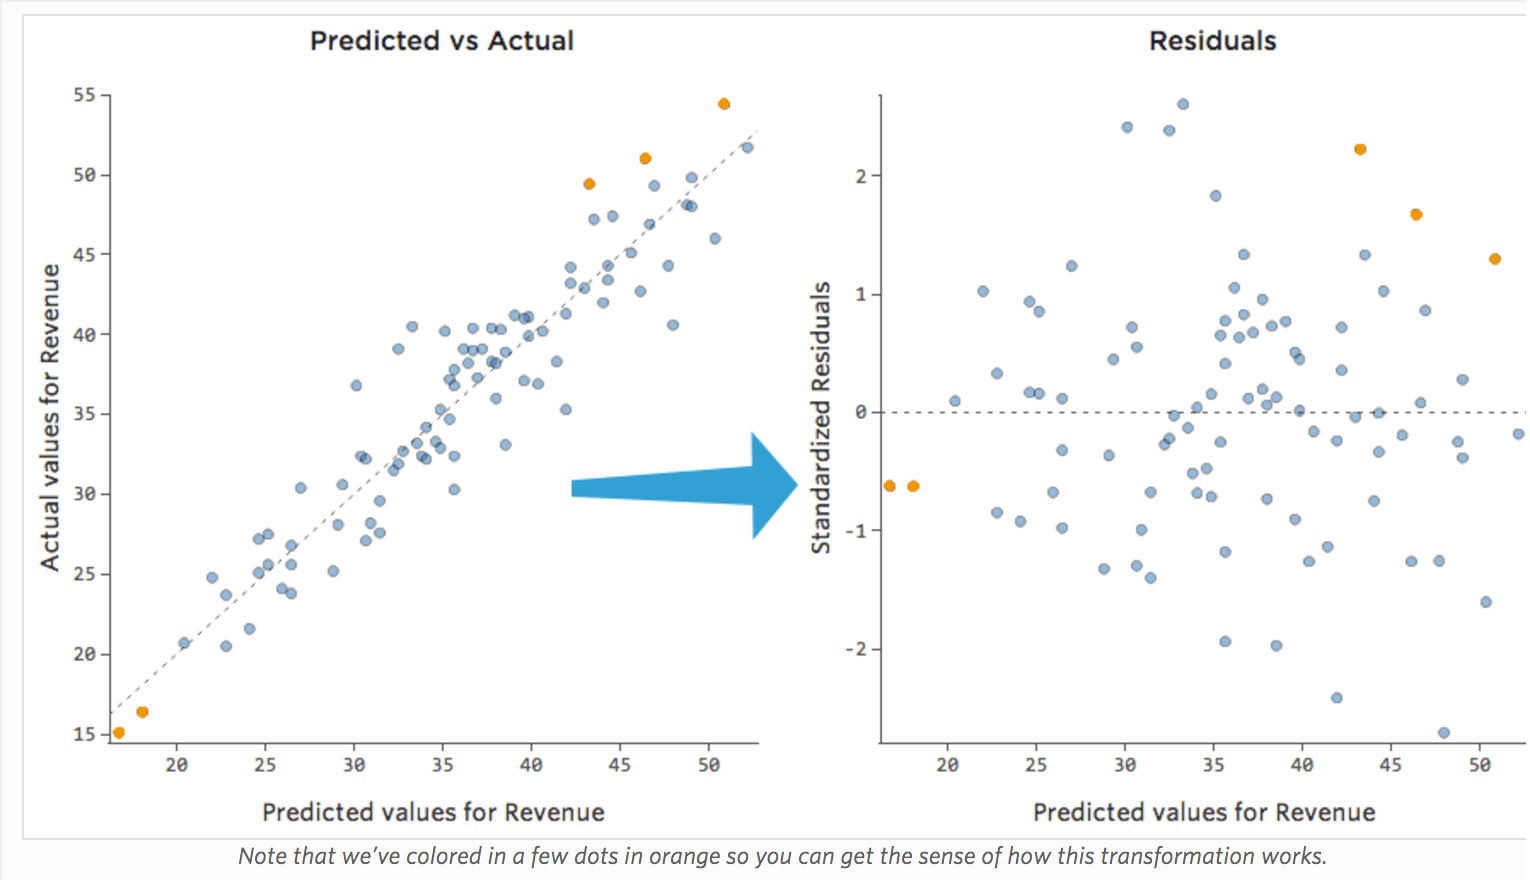
analyzing residual plot
Residual plot: The residual plot (is randomly scattered, has a pattern eg. spreading out, curved) indicating that a linear model (is, is not) appropriate.
What is your fill-in-the-blank sentence to interpret Coefficient of Determination: r²?
The % variability in [y in context] that’s accounted for by the linear model
Outliers in the y-direction (vertically far from the trend) usually:
Increase the ____ (since they are far from the line)
Have little effect on the ____ of the regression line if their x-value is typical
They mostly affect the _____ strength (make r ____, i.e., weaken the linear relationship)
So: large vertical outliers make the line fit worse but don’t strongly pull it.
residual error
slope
correlation, smaller
What effect do outliers in the x-direction tend to have? What are they called?
Outliers in the x-direction are called _____ points because:
They can strongly influence the ____ and position of the _____, sometimes pulling it toward themselves
Removing it would noticeably change the regression line.
influential, LSRL
Not among explanatory or response variables, and yet may influence the interpretation of relationships among those variables
lurking variable
Points with large residuals are called ____ (note: the converse is not true: outliers don’t necesarily have large residuals). Points which change the slope of the line and the correlation coefficient greatly when removed are called _____
outliers,
influential points
The mean of the residuals
should be 0, if it’s not 0 means that LSRL is not perfect fit
high leverage point
far out in the x-direction
coefficient of determination
r²