Density-Dependent single population dynamics
1/26
There's no tags or description
Looks like no tags are added yet.
Name | Mastery | Learn | Test | Matching | Spaced |
|---|
No study sessions yet.
27 Terms
Why is density important?
Exponential growth until limited by resource availability
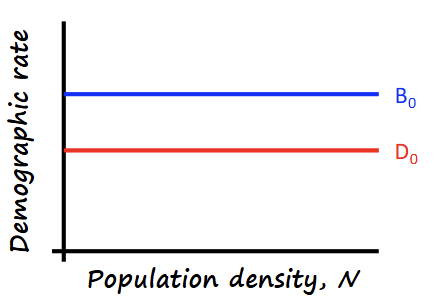
How do we model density independent per-capita birth & death rates?
B0,D0
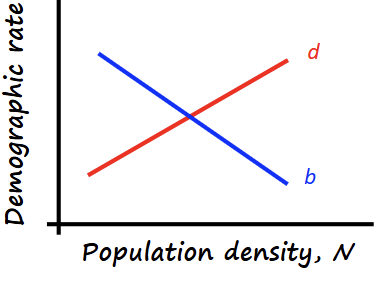
How doe we model density per-capita birth & death rates?
b,d
What does per-capita growth (pgr) mean?
Mean change in population size provided by each individual
Discrete Time Models for Exponential Growth
Nt+1=NtR
Discrete Time Models for Generic Growth Function
Nt+1=Ntf(Nt)
Discrete Time Models for Per-capita Growth Term (Exponential)
f(Nt)=R
Discrete Time Models for Negative Density Dependence
f(Nt)=er(1-Nt/K)
Continuous Time Models for Exponential Growth
dN/dt=Nr
Continuous Time Models for Generic Growth Function
dN/dt=Nf(N)
Continuous Time Models for Per-capita Growth Term
f(N)=r
Continuous Time Models for Negative Density Dependence
f(N)=r(1-N/K)
Density dependent feedback term
1-Nt/K or 1-N/K
What do state variable express & record?
The thing that is modelled
Mean field models
-State is one number
-Population density at time t
Parameters
Biological (& abiotic) elements we think affect the state variables of interest
What is stability and instability?
Stability=Population return to this point after disturbance
Instability=Cycles/Chaos
Solve dN/dt=Nr(1-N/K) for N*
-Change N→N*:
dN*/dt=N*r(1-N*/K)
-Then dN*/dt=0
0=N*r(1-N/K)
-Divide by N* by both sides
0=r(1-N*/K)
-Divide by r both sides
0=1-N*/k
-Add N*/K both sides
N*/K=1
-Times N* both sides
K=N* → N*=K
Solve Nt+1=Nter(1-Nt/K) for N*
-Change Nt→N*:
N*=N*er(1-N*/K)
-Divide N* both sides
N*/N*=er(1-N*/K) →1=er(1-N*/K)
-Log both sides
log(1)=r(1-N*/K)→0=r(1-N*/K)
-Divide r both sides
0=1-N*/K
-Add N*/K both sides
N*/K=1
-Times K both sides
N*=K
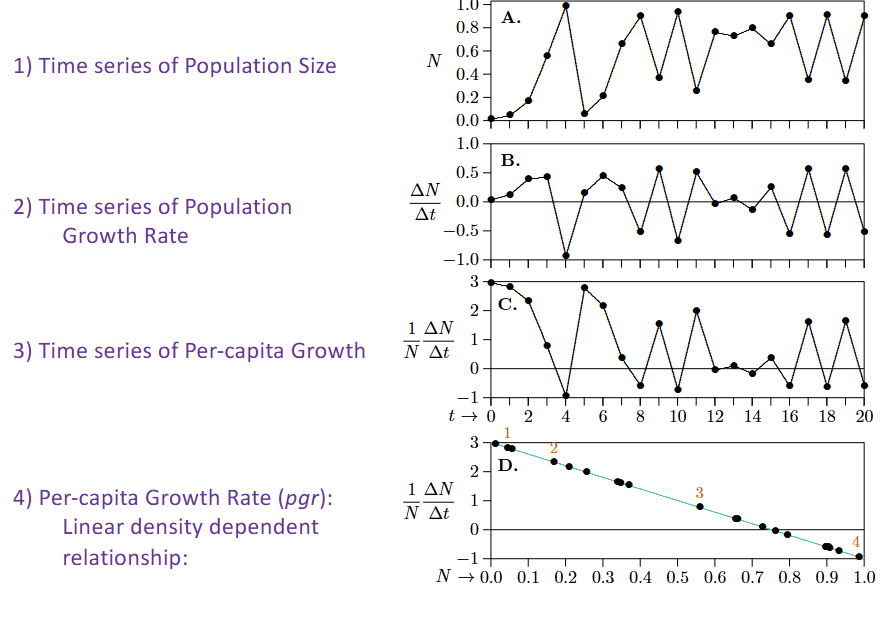
What are the ways to represent data?
-Time series of Population Size
-Time series of Population Growth Rate
-Time series of Per-capita Growth
-Per-capita Growth Rate (pgr)
Discrete time dynamics (vary carrying capacity K)
Gradual increase or decrease (N1>K)
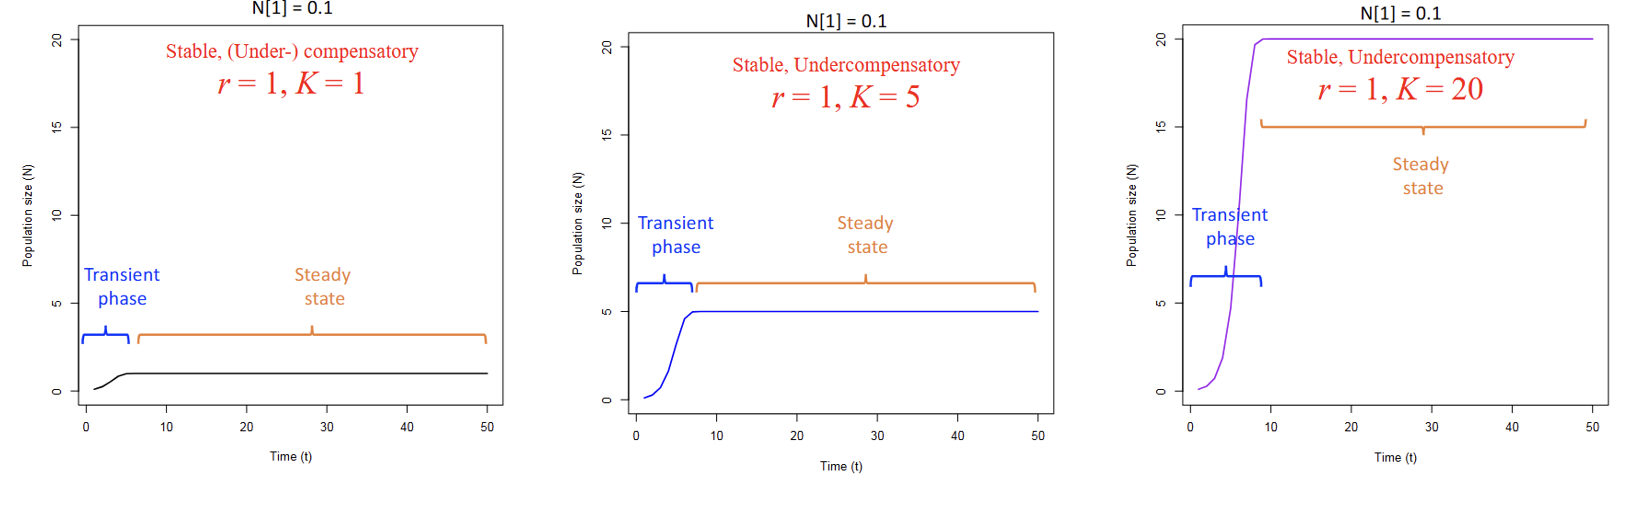
What would cause a gradual increase and a rapid decrease?
Increase=N1<K
Decrease=N1>K
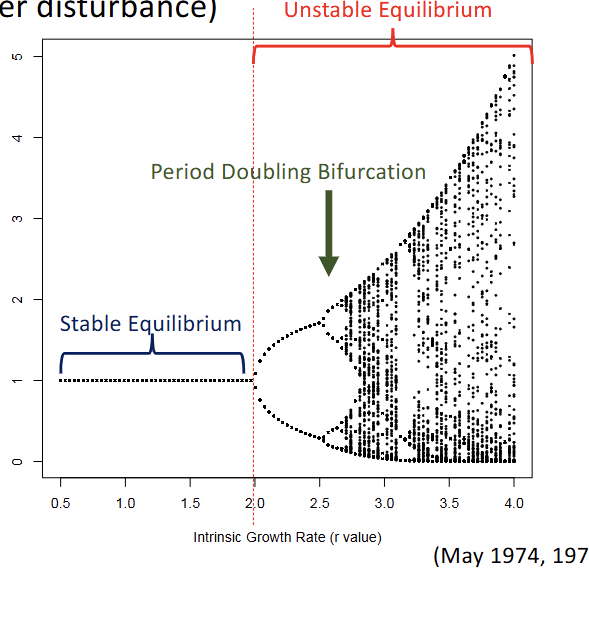
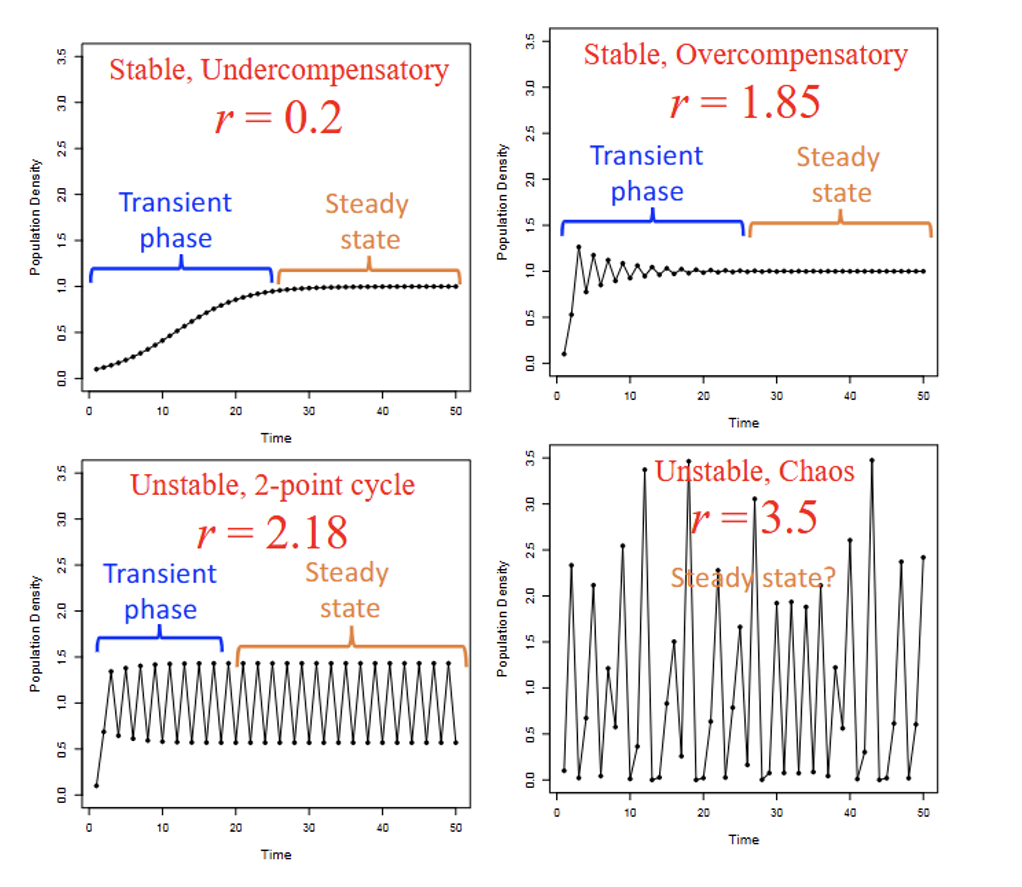
What happens if the r is increased(intrinsic growth rate)
-Approaches steady state faster
-Overshoots K
-Steady state dynamics change with r
>Stable/Cycle/Chaos
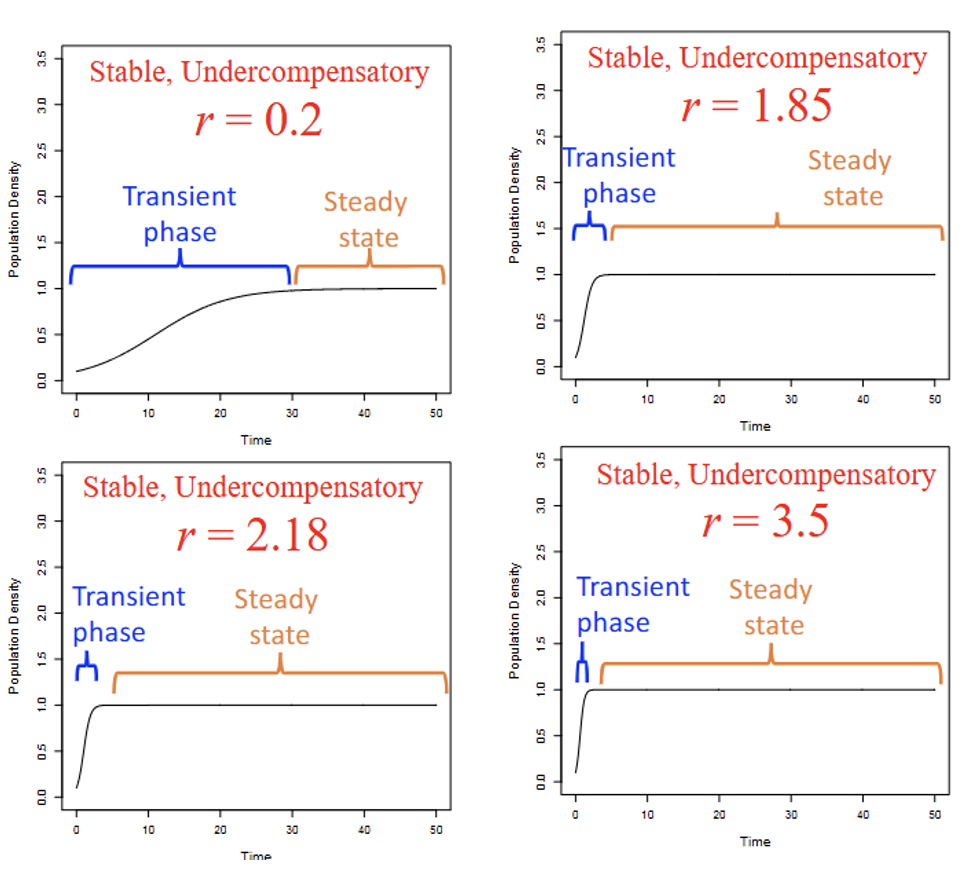
What happens if Continuous time Dynamics (dt→0) when r is increased
-Approaches steady state faster
-No change in steady state dynamics with r
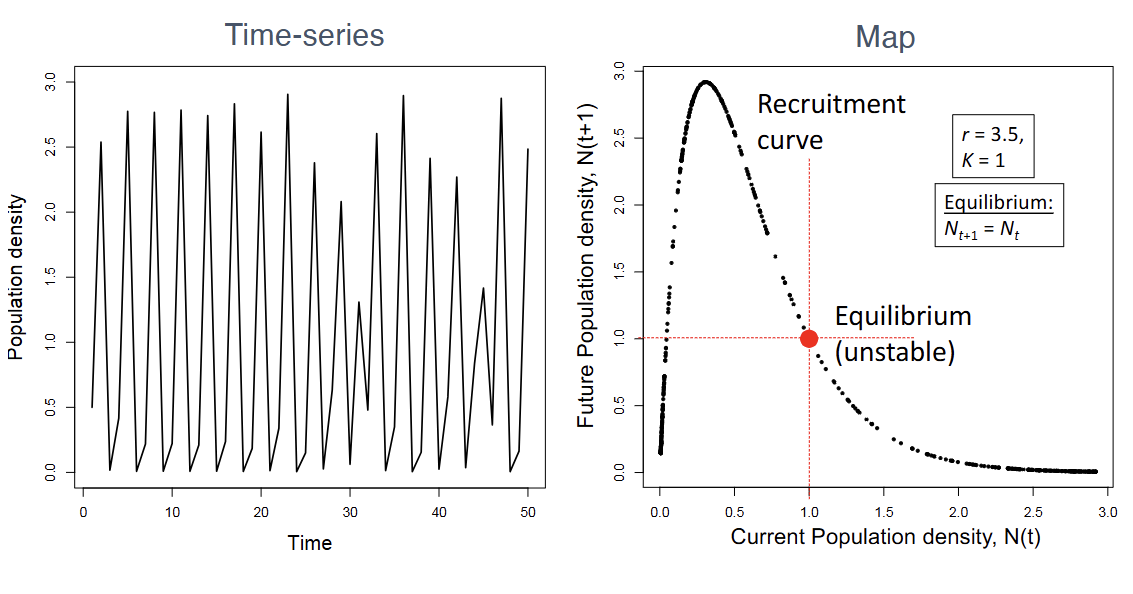
Time -Series vS Mapping Graphs
Types of bifurcation plots
-Period doubling
-Stable equilibrium to 2 points cycle
-Different point cycles
>2 to 4
>4 to 8
>8 to 16
Types of survivorship curves
k strategists
-Live to old age
-Few offspring, long parental care
Both r and K
-Constant survivorship curves
-many offspring, some parental care
R strategists
-Low early and high late survival
-Many more offspring, little or no parental care