PINNACLE - Financial Accounting
1/287
Earn XP
Description and Tags
Combined set
Name | Mastery | Learn | Test | Matching | Spaced |
|---|
No study sessions yet.
288 Terms
Scarcity
The fundamental economic problem; the fact that human wants cannot be fully satisfied with available resources.
Economics
The social science that studies the choices people, businesses, governments, and societies make as they cope with scarcity.
Microeconomics
The economics of individual action. The study of choices that individuals and businesses make, the way these choices interact, and the influences that governments exert on these choices.
Macroeconomics
The economics of the entire nation. The study of the effects on the national economy and the global economy of the choices that individuals, businesses, and governments make.
Demand
The relationship between the price of a good and the quantity demanded; the schedule of quantities of a good that people are willing to buy at different prices.
Quantity Demanded
The amount that consumers plan to buy during a period at a particular price.
Law of Demand
‘ceteris paribus, the higher the price of a good, the smaller the quantity demanded’
Substitution Effect
A higher relative price raises opportunity cost of buying a good, as a result, people buy less of the goods as there could be other available goods with a lower price.
Income Effect
A higher relative price reduces the amount of goods people can afford to buy.
Substitute goods
Goods that can be used in place of another because they perform the same function.
Complementary products
Products that go hand in hand.
Elasticity of Demand (ED)
Measures the sensitivity of demand to changes in price. Greater for a product when there are more substitutes for the good, a larger proportion of income is spent on the good, and a longer period of time is considered.
Elasticity of Demand > 1
Demand is elastic or sensitive to price changes.
Elasticity of Demand = 1
Demand is unit-elastic/unitary or insensitive to price changes.
Elasticity of Demand < 1
Demand is inelastic or not that sensitive to price changes.
Law of Diminishing Marginal Utility
An individual demands a particular good because of the utility (satisfaction) received from consuming it. The more goods an individual consumes, the more utility the individual receives. However, the marginal (additional) utility from consuming each additional unit decreases.
Personal disposable income
The amount of income consumers have after paying taxes to the government. When it goes up, consumers buy more.
Marginal Propensity to Consume (MPC)
Describes how much of each additional peso in personal disposable income that the consumer will spend.
Marginal Propensity to Save (MPS)
The percentage of additional income that is saved.
Supply
The relationship between the price of a good and the quantity supplied; the schedule of quantities of a good that people are willing to sell at different prices.
Quantity Supplied
The amount of a good that producers plan to sell at a particular price during a given time period.
Law of Supply
“ceteris paribus, the higher the price of a good, the greater is the quantity supplied.”
Equilibrium
A state wherein the demand and supply are in balance.
A market clearing situation where neither surpluses nor shortages exist.
Shortage
Quantity demanded exceeds quantity supplied and the price will rise. Below the equilibrium price
Surplus
Quantity supplied exceeds quantity demanded and the price will fall. Above the equilibrium price
Price ceiling
A maximum price that seller may charge for a good. If set below equilibrium price, it results in shortages.
Price floor
A minimum price. If set above equilibrium price, it results in surpluses.
Externalities
Damage to the environment caused by production. (e.g. pollution)
Gross Domestic Product (GDP)
The market value of all the final goods and services produced within a country, whether these are produced by the citizens of that country of by foreigners.
Final Good
An item that is bought by its final user.
Nominal GDP
Value of final goods and services produced by a domestic economy for a year at current market prices.
Real GDP
Value of final goods and services produced in a given year when valued at constant prices. Price level adjustment eliminates the effect of inflation on the measure.
Potential GDP
When all the economy’s resources are fully employed, the value of production is called
Economic Growth
An increase in real GDP.
Recession
A period of negative GDP growth.
Inflation
Exists when there is a sustained increase in the price level.
Price level
The average level of prices.
Demand-Pull Inflation
Happens when there is excess or too much demand for certain goods and services that are not met by a corresponding increase in the supply of those goods and services (i.e., excess demand propels prices to go up, which results to inflation).
Cost-Push Inflation
Happens when there is a general increase in the cost of production that may be due to higher wages (wage-push theory) or increase in the cost of raw materials and other inputs (supply-shock theory).
Philips Curve
Shows a relationship between the inflation rate and the unemployment rate.
Frictional Unemployment
Occurs because individuals are forced or voluntarily change jobss; new entrants into the workforce also fall into this category.
Structural Unemployment
Occurs due to changes in demand for products or technological advances causing not as many individuals with a particular skill to be needed; this can be reduced by retraining programs.
Cyclical Unemployment
Occurs as a result of the business cycle; increases during recession and decreases during expansion.
Full employment
Occurs when there is no cyclical unemployment.
Fiscal Policy
Government actions, such as taxes, subsidies, and government spending, designed to achieve economic goals.
Fiscal Expansion
An increase in deficit either due to an increase in government spending or to a decrease in taxes.
Fiscal Contraction
An increase in taxes to reduce a deficit.
M1
Most liquid (e.g., currency demand deposits, current accounts and traveler’s checks).
M2
M1 money plus savings account, certificates of deposits, money market mutual funds, money market deposit accounts, small-denomination time deposits.
M3
M2 money plus other less liquid form of money (e.g., large denomination time deposits).
Divisions of Economics
Microeconomics and Macroeconomics
Price of Substitute goods
Direct effect on demand. Example: if the price of pork increases, the demand for beef may increase.
Inverse effect on demand. If other products can be produced with greater returns, producers will produce those goods
Price of Complementary goods
Inverse effect on demand. Example: if the price of gasoline increases, the demand for cars tends to decrease.
Direct effect on demand. A rise in the price of a complement in production increases supply and shifts the supply curve rightward.
Expected future prices
Direct effect on demand. If the price of the goods is expected to increase in the future, there will be an increase in demand.
Direct effect on supply. If it is expected that prices will be higher for the good in the future, production of the good will increase.
Consumer wealth/income
Direct effect on demand for Nominal goods. As consumer income goes up, the demand for many products (normal goods) increases.
Inverse effect on demand for Inferior goods. Demand for inferior goods (e.g., instant noodle, sardines) increases as consumer income decreases since consumers buy more inferior goods when they are short of money.
Population growth
Direct effect on demand. An increase in population increases number of potential buyers
Size of market
Direct effect on demand. As market size expands, demand for the product also increases
Consumer tastes/preferences
Indeterminate effect on demand. The effect depends on whether the shift in taste or preference is favorable or unfavorable to the demand for the product.
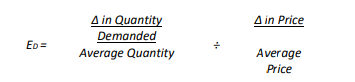
Elasticity of Demand (ED) formula
(Change in Quantity Demanded/Average Quantity) ÷ (Change in price/Average price)
Higher price decreases the quantity demanded for two reasons:
Substitution effect and Income effect
Marginal Propensity to Consume (MPC)
describes how much of each additional peso in personal disposable income that the consumer will spend.
Supply curve
Shows the positive relationship between the quantity supplied and price, ceteris paribus. Are positively sloped.
Production costs
Inverse effect on supply. As production costs go up, fewer products will be supplied at a given price. If costs go down, more products will be produced.
Number of producers
Direct effect on supply. An increase in the number of producers will cause an increase in the amount of goods supplied at a certain level of price.
Technology
Direct effect on supply. Technological advancement increases supply and thus shifts the supply curve rightward.
Government subsidies
Direct effect on supply. Subsidies reduce the production cost of goods and, therefore, increase the goods supplied at a given price.
Government tax and tariffs
Inverse effect on supply. Increase in taxes would raise production costs, thereby decreasing supply
Elasticity of Supply (ES)
Measures the percentage change in quantity supplied of a product resulting from a change in product price
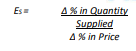
Elasticity of Supply (ES) formula
Percentage Change in quantity supplied / Percentage change in price
Elasticity of Supply (ES) > 1
Supply is said to be elastic (sensitive to price changes)
Elasticity of Supply (ES) = 1
Supply is said to be unit-elastic/unitary (insensitive to price changes)
Elasticity of Supply (ES) < 1
Supply is said to be inelastic (not that sensitive to price changes)
Elastic supply
Means that a percentage increase in price will create a larger percentage increase in supply.
Government intervention may change market equilibrium through taxes and subsidies
A subsidy paid to farmers will reduce cost of producing farm goods; equilibrium price will be lower.
Import taxes increase cost of imported products causing the equilibrium price to be higher.
Market
Any institution, mechanism, or situation which brings together the buyers and sellers of a particular product. It is a place where sellers and buyers meet (e.g., grocery, internet).
Competition
Denotes rivalry between among producers, each of which seeks to deliver, a better deal to buyers when quality, price and product information are all considered.
Pure competition
The firm’s demand curve is perfectly elastic (horizontal). The firm can sell many goods it can produce at the equilibrium price (i.e., very low sales at a higher price).
Monopolistic competition
Consumers go for a certain product based on differentiation.
Pure monopoly
The firm has no or very little market incentive to innovate or control costs; hence, pure monopolies are usually subject to government regulation.
Oligopoly
A competition among few; if left unregulated, oligopolists tend to establish cartel that engage in price fixing through collusion.
Monopsony
a market where only one buyer exists for all sellers.
Black market
An illegal market wherein people conduct transactions at price (usually high) forbidden by the government.
The four basic Market models are
Pure Competition
Monopolistic Competition
Oligopoly
Pure Monopoly
Total product
The total quantity of the output produced in a given period.
Marginal product
The change made in total product from a change in a variable input (e.g., labor).
Marginal
In economics, the term “____” is often used to mean “additional”.
Average product
The total product per unit of input (e.g., labor). It is total product divided by the quantity of labor employed. Another term for average product is productivity.
Increasing marginal returns
Occur when the marginal product of an additional worker exceeds the marginal product of the previous worker. In most productions, increasing marginal returns occurs initially but decreasing marginal returns will occur eventually.
Economies of Scale
Arise because of labor and management specialization, efficient capital, and factors such as spreading advertising cost over an increasing level of output.
Two principal methods of calculating GDP
Expenditure Approach
Income Approach
Expenditure Approach
Adds up all expenditures to purchase final goods and services by household (consumers), business and the government.
Gross Domestic Product (GDP) formula
C+I+G+X
Where:
C = Consumption expenditures (total household spending on consumption of goods and services).
I = Investment (firm’s purchase of plants, equipment, buildings, and addition to inventories).
G = Government purchases (government spending on goods and services).
X = Net exports (exports minus imports = ‘foreign’ sales – ‘foreign’ purchases).
GDP is measured either in
Nominal GDP
Real GDP
Gross National Product (GNP)
The total and final output of land, labor, capital, and entrepreneurial ability produced by the country’s citizens, produced whether inside the country or elsewhere abroad.
Primary causes of inflation
Demand-Pull Inflation and Cost-Push Inflation
There is an inverse relationship between inflation and unemployment
When unemployment rate is low, inflation tends to increase.
When unemployment rate is high, inflation tends to decrease.
People are unemployed because of
Frictional, structural or cyclical causes
Examples of Fiscal policy
A reduction of taxes increases personal disposable income, which will stimulate economic activity.
Economy may also be stimulated through increased government spending.
Money
a liquid asset because it exchanges easily for other assets
Income Approach
Adds the compensation of employees, not interest, rental income, corporate profits and proprietors’ income.