tutorial questions 3,Significance Tests – Part 2: t-tests & F test
1/7
There's no tags or description
Looks like no tags are added yet.
Name | Mastery | Learn | Test | Matching | Spaced | Call with Kai |
|---|
No analytics yet
Send a link to your students to track their progress
8 Terms
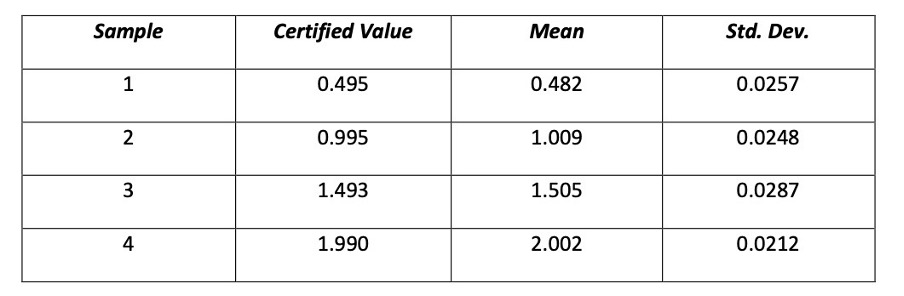
1. In order to evaluate a spectrophotometric method for the determination of titanium, the method was applied to alloy samples containing different certified amounts of titanium. The results (%Ti) are shown below:
For each alloy 8 replicate determinations were obtained.
For each alloy, test whether the mean value differs significantly from the certified value.
Solution
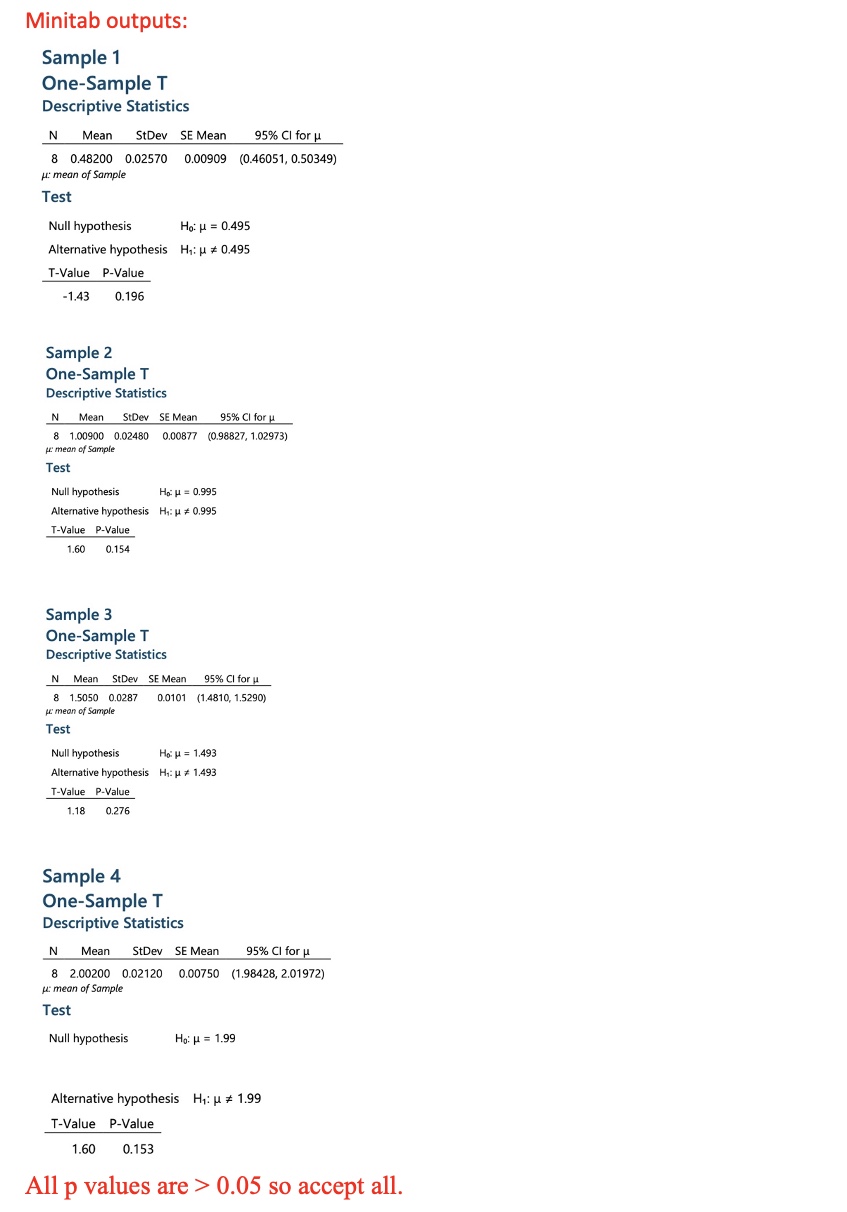
Sample 1: t= (0.482 – 0.495)
Sample 2: t = 1.597
Sample 3: t= 1.18
Sample 4: t =1.60
tcrit= 2.36 therefore in all cases there is no significant difference between the certified value and the mean in each case.
For each alloy, test whether the mean value differs significantly from the certified value.
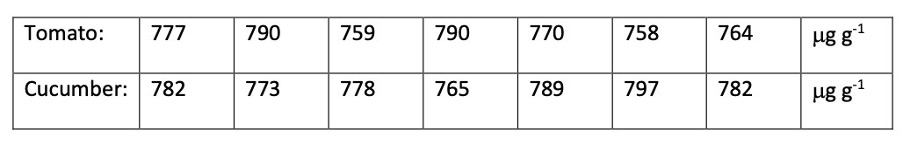
2. The following data give the recovery of bromide from spiked samples of vegetable matter, measured by using gas-liquid chromatographic method. The same amount of bromide was added to each specimen.
(a) Test whether the recoveries from the two vegetables have variances which differ significantly.
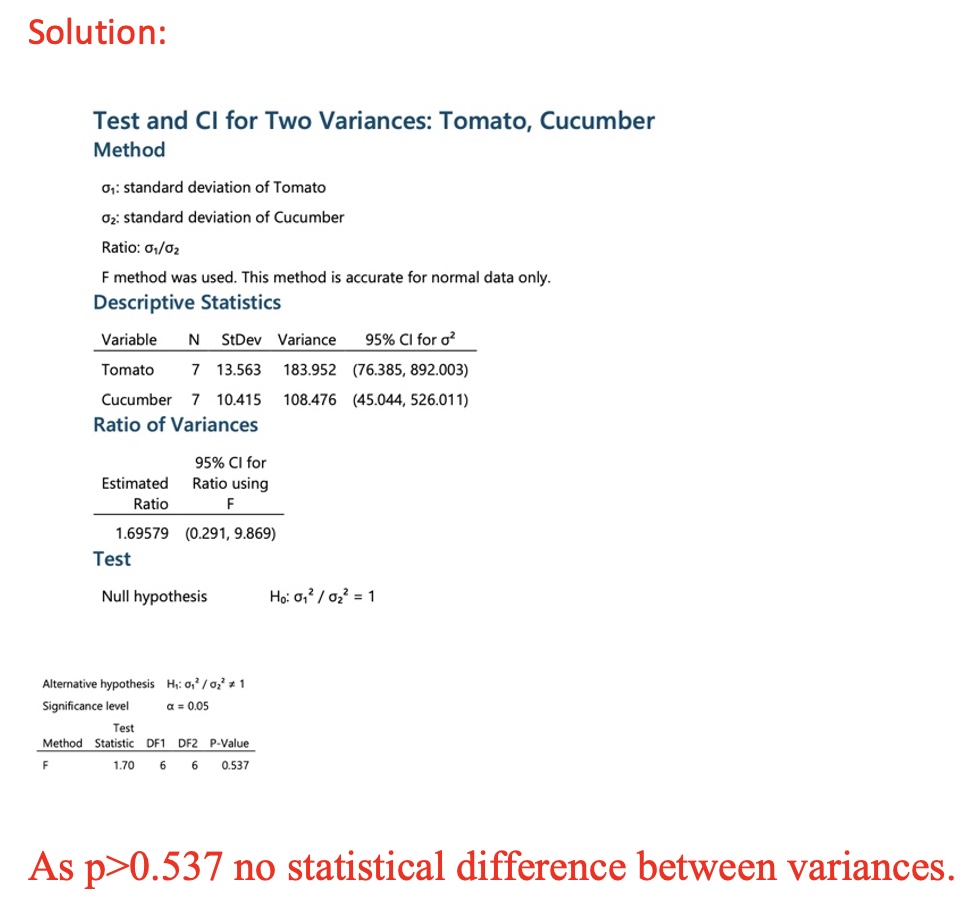
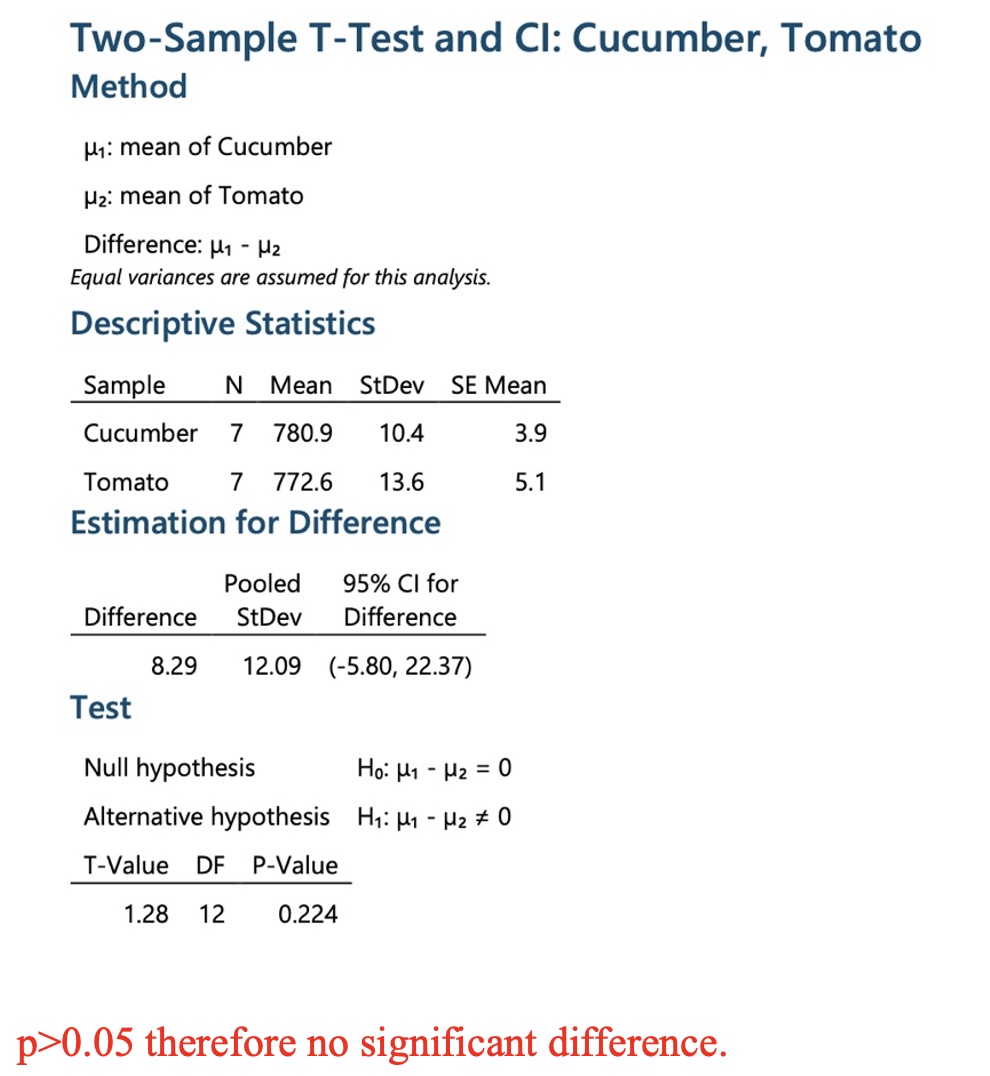
(a) Test whether the mean recovery rates differ significantly.
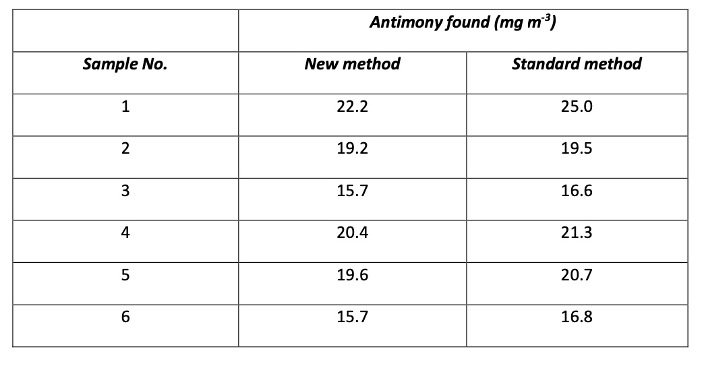
3. A new flame atomic-absorption spectroscopy method of determining antimony in the atmosphere was compared with the recommended calorimetric method. For samples from an urban atmosphere the following results were obtained:
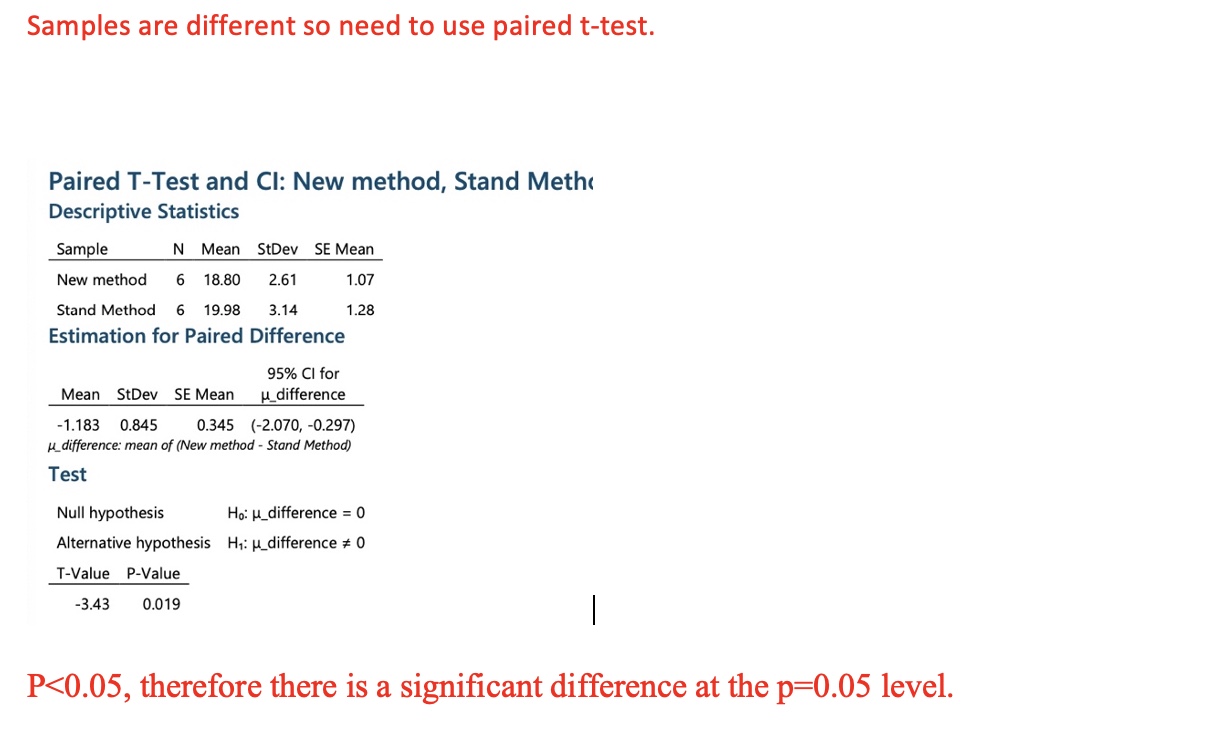
Do the results obtained by the two methods differ significantly?
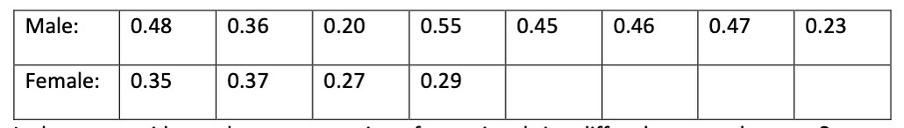
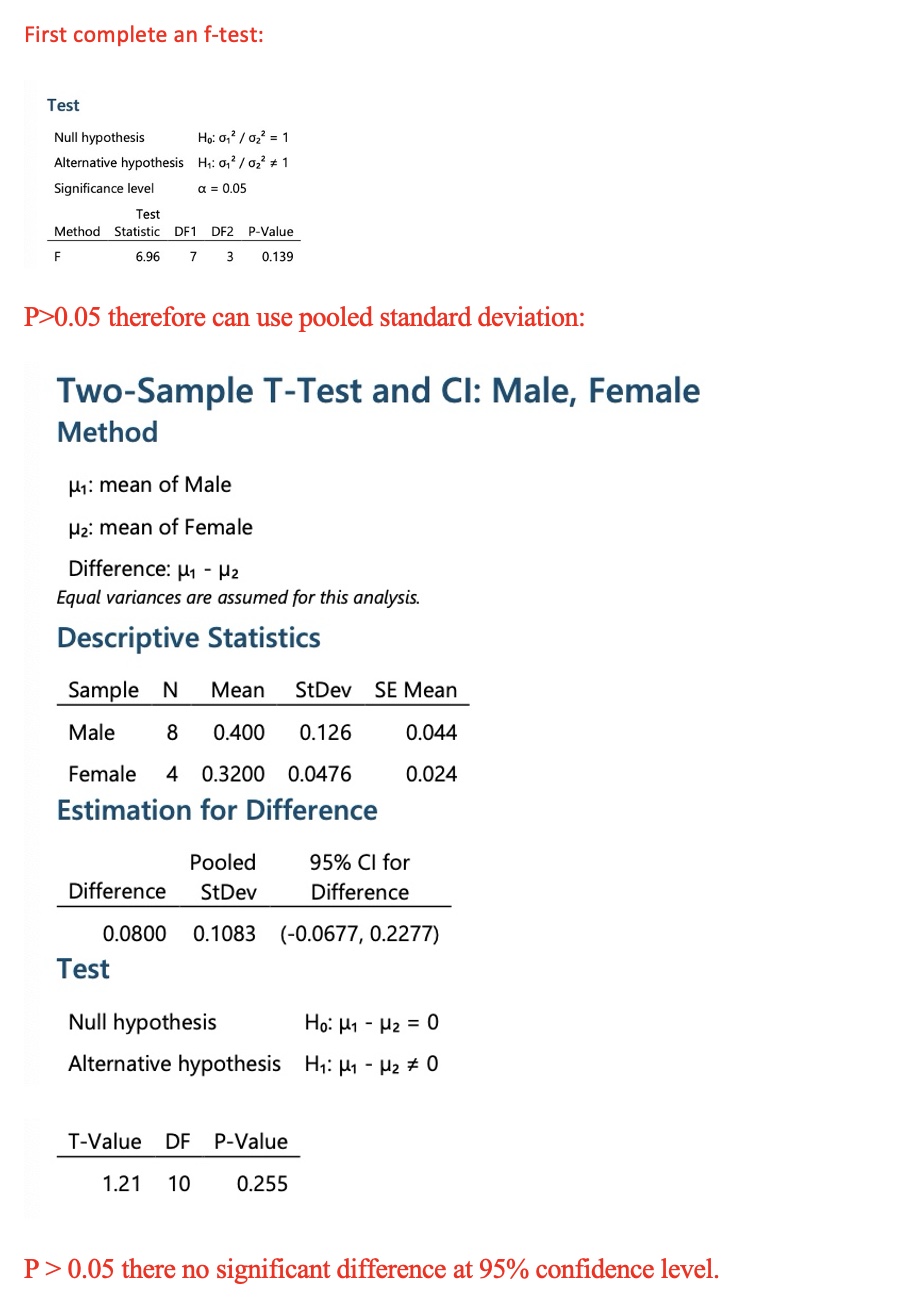
4. The following table gives the concentration of norepinephrine (μmol per gram creatine) in the urine of healthy volunteers in their early twenties:Is there any evidence that concentration of norepinephrine differs between the sexes?
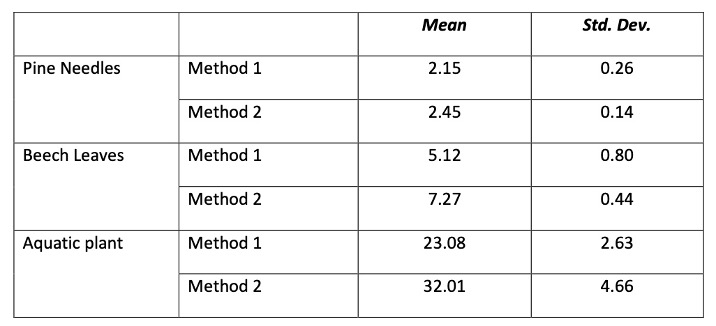
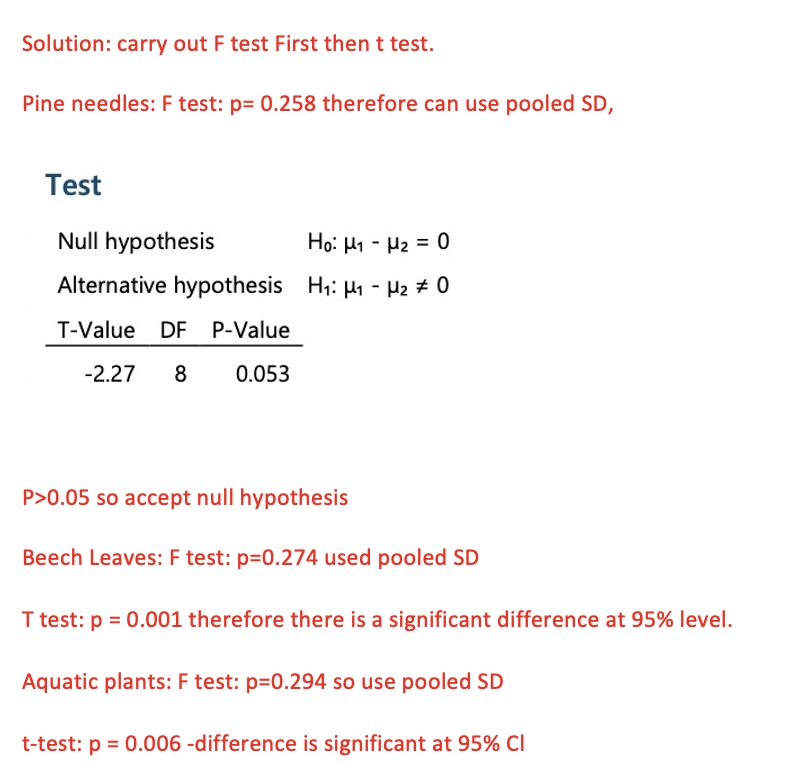
5. The following table gives the results of the determination of chromium in organic materials were compared for two different methods.
In each case the mean is the average of 5 results.
For each material test whether the mean results obtained by the two methods differ significantly.
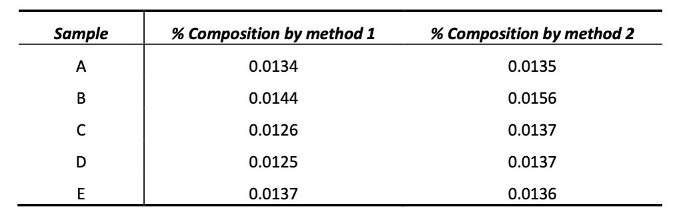
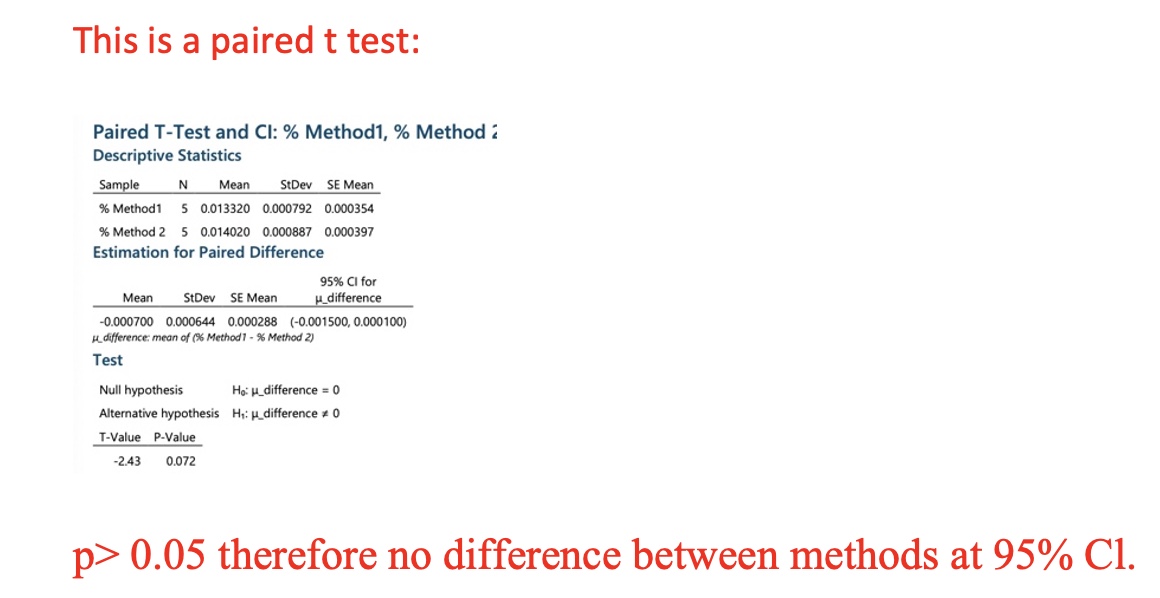
6. The Ti content (wt%) of five different ore samples (each with a different Ti content) was measured by each of two methods.
Do the analytical techniques give results that are significantly different at the 95% confidence level?
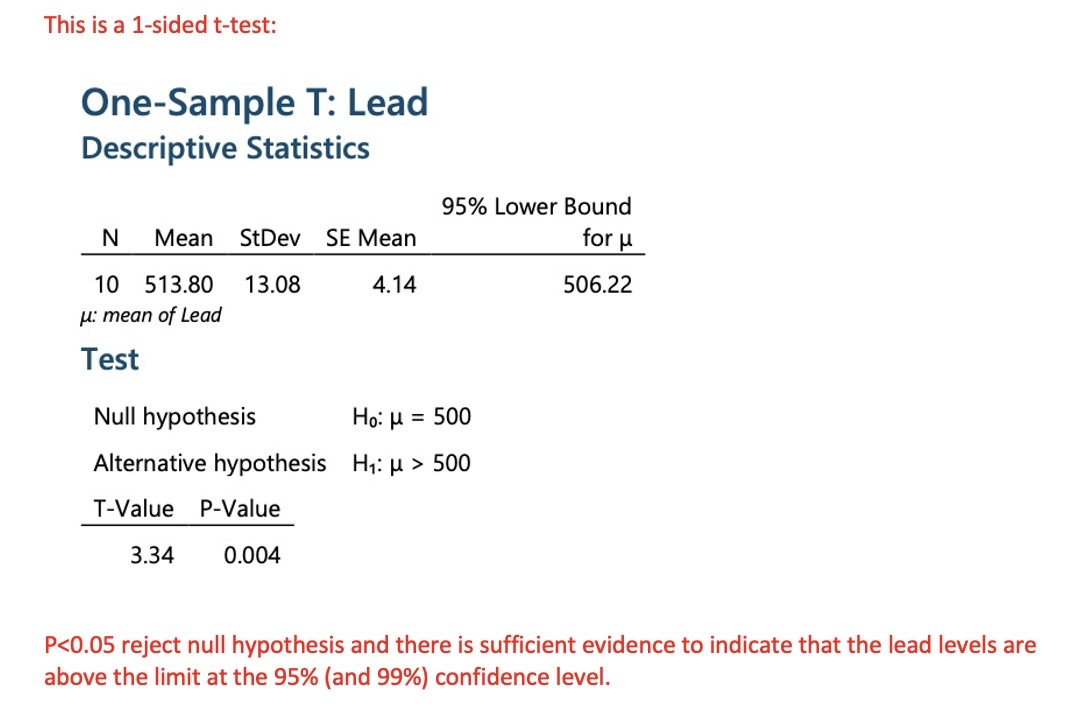
7. An area of land is being investigated to determine the concentration of lead present in the soil. Ten samples of soil are submitted to the laboratory for analysis. The results are:
Lead (mg kg-1): 521; 531; 508; 503; 512; 528; 516; 503; 526; 490
The concentration of lead in the soil must not exceed 500 mg kg-1. Based on the results obtained, is there any evidence to suggest that the concentration of lead in the soil exceeds this limit? (Assume a significance level of P=0.05)