Rating manual and Rating making data and Exposure
1/24
There's no tags or description
Looks like no tags are added yet.
Name | Mastery | Learn | Test | Matching | Spaced | Call with Kai |
|---|
No analytics yet
Send a link to your students to track their progress
25 Terms
Rating Manual
Rules: Contain definitions, particularly how to classify a risk
Rates pages: contain base rates, rating tables, etc.
Rating Algorithm: describes how to combine the components to determine the premium for a specific insured
Underwriting guidelines: a set of company-specific criteria that can affect decisions made prior to calculating a rate.
Deciding whether to accept or reject a risk, or to refer it to a more senior underwriter.
Company placement (deciding in which of several companies in the group to place the insured)
Tier placement (decide in which of several underwriting tiers to place the insured)
Schedule rating credits/debits
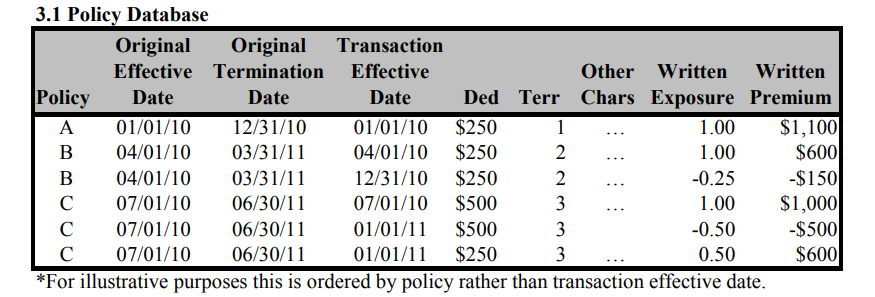
Policy Database
Policy Identifier
Risk identifier(s)
Relevant dates
Premium
Exposure
Characteristics: rating variables, underwriting variable, etc
Claim Database
Policy Identifiers
The risk identifier(s)
Claim identifier
Claimant identifier
Relevant loss dates: the date of loss, the report date, and the transaction date
Claim status: open, closed, or reopened
Reopened date
Claim count
Paid loss
Event Identifier: for example a catastrophe
Case reserve
Allocated loss adjustment expense
Salvage/subrogation
Characteristic
Accounting Information
Underwriting expenses
Unallocated loss adjustment expenses (ULAE)
Data Aggregation
Calendar year (earned premium from this year; losses paid in this year (losses from years ago))
The advantage of calendar year aggregation is that data is available quickly once the calendar year ends. This information is typically collected for other financial reporting so it represents no additional expense to aggregate the data this way for ratemaking purposes.
The main disadvantage of calendar year aggregation is the mismatch in timing between premium and losses. Premium earned during the calendar year come from policies in force during the year (written either in the previous calendar year or the current calendar year). Losses, however, may include payments and reserve changes on claims from policies issued years ago.
Calendar year aggregation for ratemaking analysis may be most appropriate for lines of business or individual coverages in which losses are reported and settled relatively quickly, such as homeowners
Accident year (earned premium from this year; loss associated with accident year (losses from accident year, but may not close at the end of the year. need to estimated ultimate loss by using LDT))
Accident year aggregation represents a better match of premium and losses than calendar year aggregation.
Losses on accidents occurring during the year are compared to premium earned on policies during the same year. Since accident year is not closed (fixed) at the end of the year, however, future development on those known losses needs to be estimated.
Selecting a valuation date several months after the end of the year allows the emergence of some development in the data and therefore may improve estimation of ultimate losses.
Policy year (earned premium from this year, loss from policy year)
Policy year aggregation represents the best match between losses and premium. Losses on policies written during the year are compared with premium earned on those same policies.
Given that policy year exposures are not fully earned until after the end of the year (e.g., policy year exposures for a product with an annual policy term are not fully earned until 24 months after the start of the policy year), data takes longer to develop than both calendar year and accident year.
Report year
NCCI
Annual Financial Call Data : Aggregate premium and loss data (experience by state) primarily used to calculate overall loss cost and rate level changes
Workers Compensation Statistical Plan (WCSP) Data: Individual policy loss and exposure (payroll) information collected with detail by classification, primarily used to calculate classification relativities and experience rating modifications.
Desirable Properties of an Exposure Base
Proportional to expected loss
Practical
Historical Precedence
Proportional to expected loss
exposure base implies a uniform and continuous multiplicative relationship between the variable and the expected losses
the exposure base should be responsive to any change in exposure to risk
the exposure base is not a rating variable, although the dividing line between the two is somewhat arbitrary at times
Practical
objective and well defined
relatively easy and inexpensive to obtain
relatively easy and inexpensive to verify
consistently measured
Not subject to manipulation by insureds, agents, or underwriters.
Historical precedence
exposure bases are rarely changed once they have been established
one would only change an exposure base if one thought the new base was significantly better
Personal Automobile Exposure base
Earned Car year
Amount of Insurance Coverage
Worker Compensation Exposure Base
Payroll
Worker Compensation Exposure base: Hour worked vs, Payroll
In early 1980, limitation on payroll was removed.
in 1984 - 1985, the perceived inequity resulting from the workers compensation exposure base (payroll) became a matter of national debate of the varying wage scales that appeared as a result of deregulation in many industries.
Based on these differences. the insureds proposed both hours worked and mixed hours-worked/payroll as exposure bases, while the NCCI preferred to retain unlimited payroll. because it is easy to verify and it reduces the size of the annual rate revisions needed
NCCI’s analysis of the Oregon data found no bias against either union or high wage paying employers among the small employers, but it did show that high wage paying and union employers in the medium sized group developed lower loss costs per premium dollar.
Payroll won out in the exposure base arena, but concessions were made on the classification side
Commercial General Liability Exposure base
Sales Revenue
Payroll
Square Footage
Number of Units
General Liability: Area vs. Receipts
Mercantile (Retail Stores)
Previous Exposure Base: Area (square footage)
Retail stores were traditionally rated based on their physical size, assuming larger spaces attract more customers and pose greater liability risks.
Change to Receipts:
ISO recognized that gross receipts (revenue) more accurately reflect the level of business activity and customer interaction, which are stronger indicators of liability risk.
Example: A small, high-end jewelry store with $10 million in sales poses more risk than a large thrift store with minimal sales, even if the latter has greater square footage.
Rationale for the Shift:
Receipts capture customer volume and transactions, which directly correlate with potential liability claims.
1. Manufacturing and Mercantile: Sales (Receipts)Why Sales (Receipts)?
Sales Reflect Customer Interaction and Product Output:
Mercantile: The volume of sales is a proxy for the number of customers and transactions, which directly impact liability risks (e.g., slip-and-fall accidents in a retail store).
Manufacturing: Sales are tied to the number of products made and distributed, which directly impacts the likelihood of product liability claims.
Examples:
Mercantile: A high-end jewelry store with $1 million in annual sales has higher liability exposure (more customers visiting) than a larger thrift store with $50,000 in sales.
Manufacturing: A small plant producing $5 million in goods has more exposure to product liability risks than a larger plant producing $1 million.
Key Reasons for Using Sales:
Direct Correlation with Risk:
Higher sales typically indicate higher activity levels, more products in circulation, and more customer interactions.
Scalable Metric:
Sales fluctuate with business activity, allowing premiums to align with operational scale year-over-year.
Physical Size Doesn’t Always Reflect Risk:
A large but low-activity retail space or manufacturing plant may have less exposure than a smaller, high-output operation.
Contracting: Payroll
Why Payroll?
Payroll Reflects the Workforce's Exposure to Risk:
Contracting work involves manual labor, physical activity, and on-site operations, where the number of workers and their tasks are the primary sources of liability.
Payroll is a good proxy for the scale of operations since larger payrolls often indicate more workers or higher wages for skilled labor.
Examples:
A construction company with a $1 million payroll for 10 workers has a higher liability risk (e.g., injuries, accidents) than one with a $500,000 payroll for 5 workers.
Key Reasons for Using Payroll:
Labor-Intensive Nature:
Liability risks in contracting (e.g., injuries, third-party property damage) are closely tied to the number of workers and their activities.
Project Complexity:
Higher payrolls often indicate larger or more complex projects, which increase exposure to risks.
Not Tied to Revenue:
Revenue doesn’t always correlate with risk in contracting. A contractor might work on high-value projects but involve minimal physical exposure (e.g., consulting vs. on-site work).
Commercial Business Property Exposure base
Amount of Insurance coverage
Physician’s Professional Liability Exposure base
Number of Physician Years
Professional Liability Exposure base
Number of Professionals (e.g., Lawyers or Accountants)
Personal Articles Floater
Value of Item
Property Coverage
Rating Variables
Construction
Occupancy
Location (territory)
External Hazards
Internal Protection (Sprinklers, smoke alarms)
External Protection (Local fire department and police)
Amount of Insurance
Automobile liability
Rating Factors
driver’s age
gender
marital status
driving record
school record
business or pleasure use
mileage or distance to work
radius of operation
location (territory of principal garaging)
truck weight
insurance limit
number of vehicles
claims experience (safe driving credit (personal) or experience modification (commercial)).
Automobile physical damage Rating Factors
car make
model and year for private passenger auto, or vehicle age
original cost new for commercial autos
number of vehicles; territory
deductible
claims experience.
Workers compensation Rating Factors
location (territory)
occupation
claims experience (experience modification)
payroll.
General liability Rating Factors
classification
territory
insurance limit
type of coverage (claims-made or occurrence)
claims experience
square footage or acreage
payroll or receipts
new/discontinued businesses
Indicated rate improvement
adjust premium to the current rate level. We need to take into account any rate changes have been made over the historical periods.
Determine a premium trend. trend the premiums for each CY to policy effective period. The premiums are affected by shifts in the mix of business and inflation acting on the exposure base
determine a loss trend. trend the losses and ALAE for each AY to policy effective period. Losses and ALAE are affected by inflation and there may be changes in frequency.
trend fixed expense since it’s affected by inflation.
Develop the loss and ALAE to ultimate. We need to estimate the total cost of providing coverage. Report losses develop as they mature, due to unreported claims, reopened claims and difference between reported and ultimate paid
Include a provision for ULAE. we need to included all losses.
take weighted average of loss ratio rather than a straight average. One could weight years by their premium volume, in order to take into account that different volumes of data by year. It may also make sense to weight more recent years more heavily, since they are more similar to policy effective date.