Spectroscopy
1/157
There's no tags or description
Looks like no tags are added yet.
Name | Mastery | Learn | Test | Matching | Spaced | Call with Kai |
|---|
No analytics yet
Send a link to your students to track their progress
158 Terms
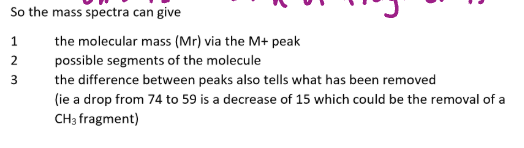
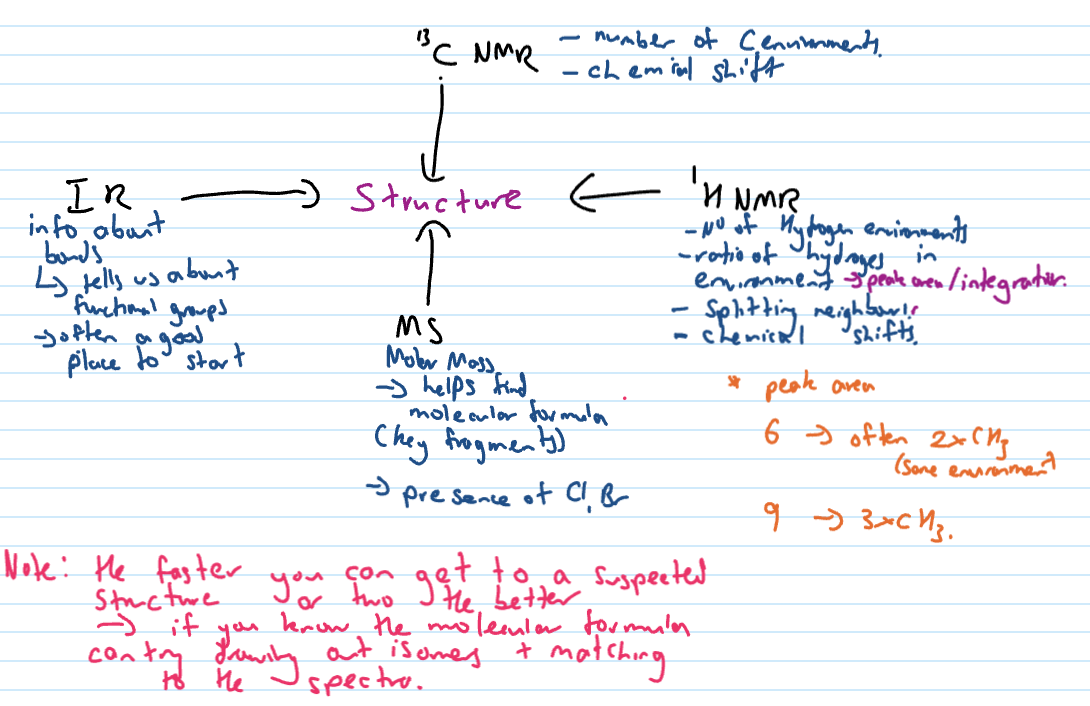
Mass spectro tells you
the molar mass of the molecule
via parent ion/molecular ion peak
Likely groups within a molecule
via the mass of the fragments within the molecule OR the mass difference between the peaks
How mass spectro works
ionisation step removes an electron (it also can fragment the molecule and remove more than one e)
becomes positively charged - mass spec can only detect positively charged substances (artificially generated ion)
Mass/charge signal (m/z) of COOH
45
CH3 m/z
15
OH m/z
17
What mass spectra looks like
base peak
fragment with the highest percentage abundance
Mass spectra: common mistakes
forgetting positive on fragment
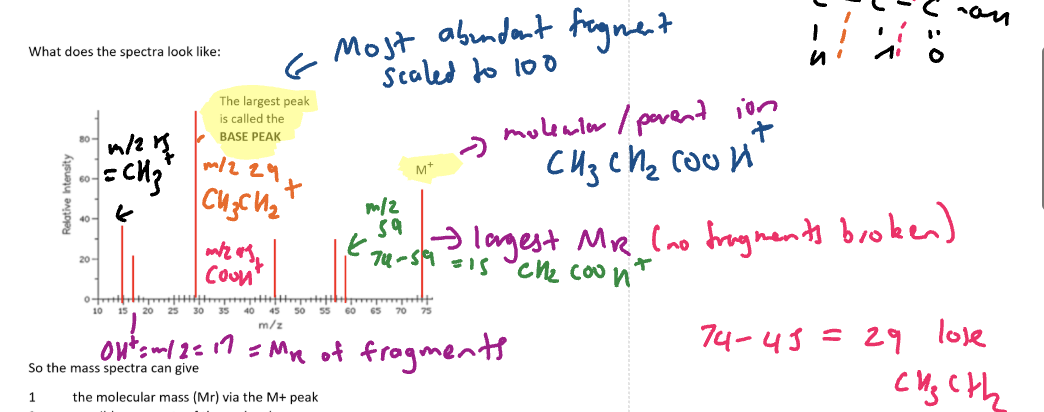
Mass spectro isotopes effect
mass spec separates and detects m/z, different isotopes will impact on the position of peaks
When small tiny peak next to the molecular ion peak…
could be C-13 isotope - which is one unit apart from C-12 (longer peak)
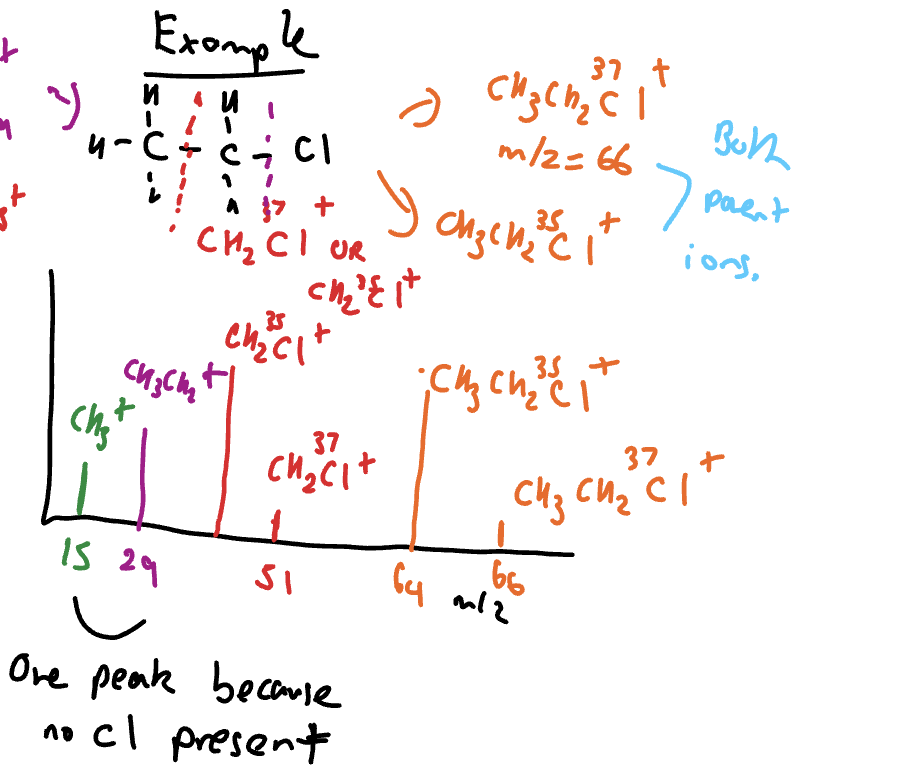
35-Cl and 37-Cl
with relative ratio of 35-Cl: 37-Cl being 3:1 and two units apart
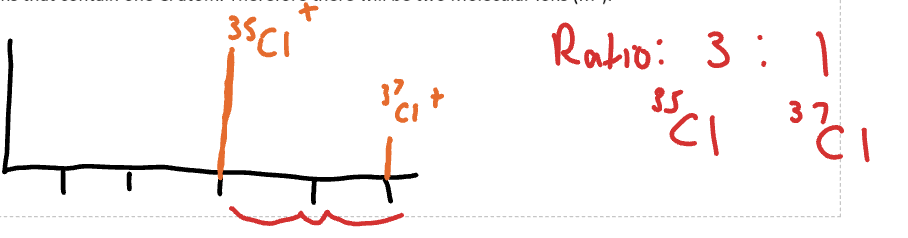
How mass spectra with Cl isotopes can look
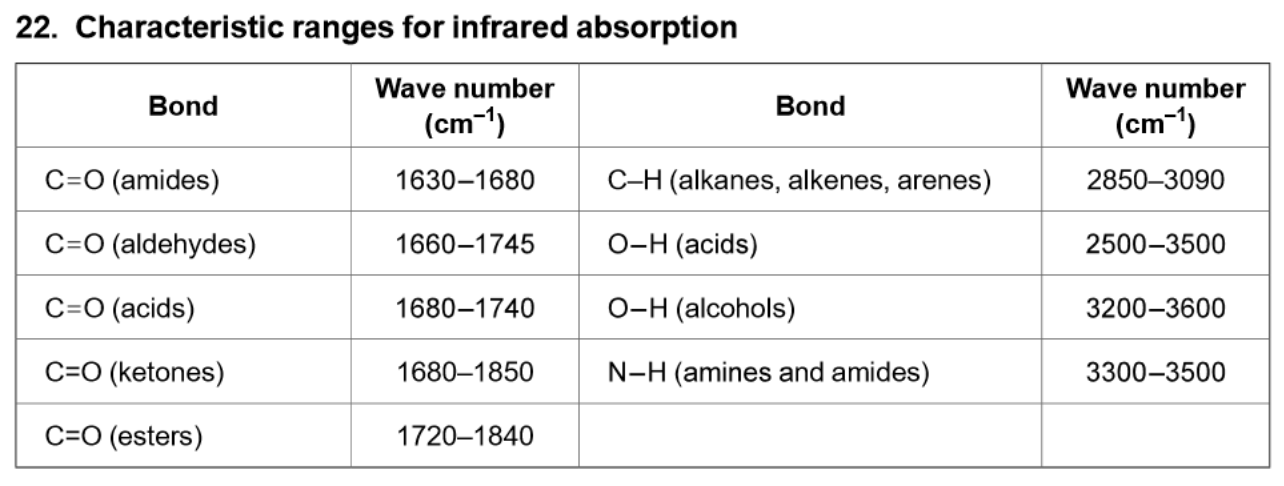
IR absorptions - where to find
Data book only has wave numbers
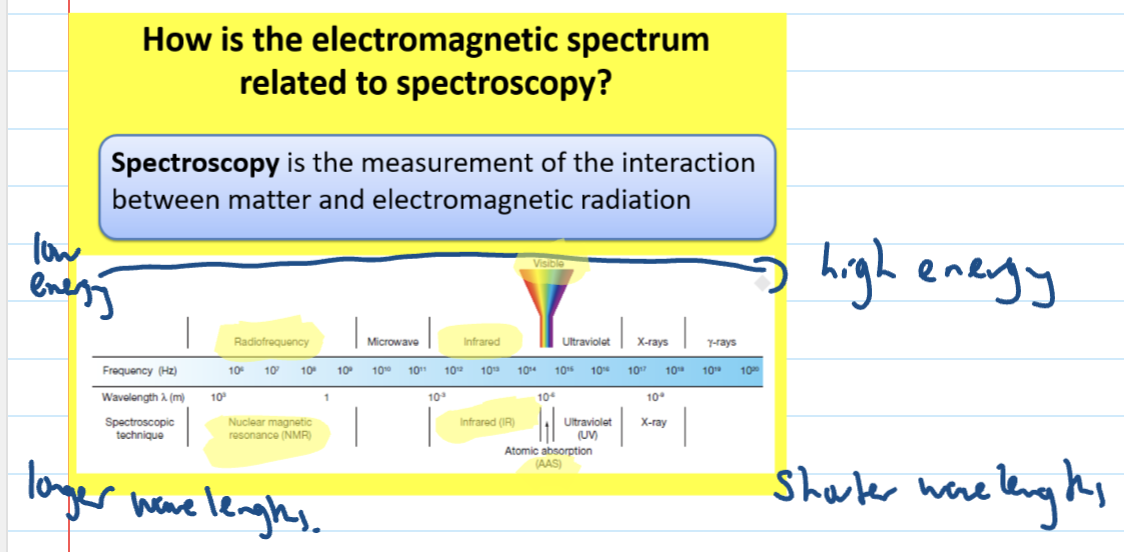
How is the electromagnetic spectrum related to spectroscopy?
IR Radiation
Causes vibrations in covalent bonds and makes the bonds bend and stretch
It is used to detect bonds that are part of functional groups in organic molecules
Ground state
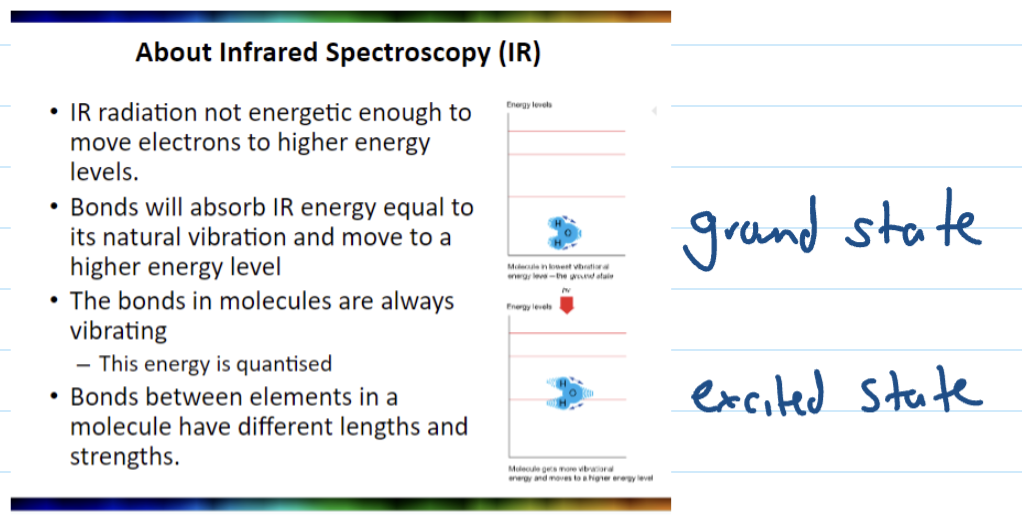
Bond vibrations
Different bonds absorb different wavelengths of IR light, which causes it to stretch, bend or twitch like a spring
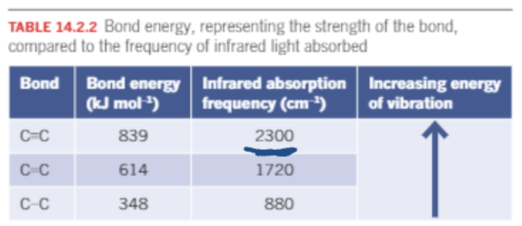
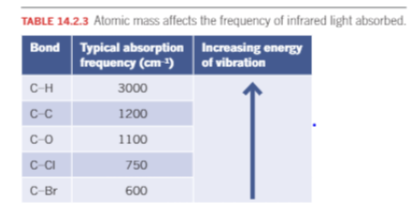
IR: Strength of bonds
Stronger bonds require more energy to vibrate
IR: mass of atoms
Heavier masses vibrate at lower frequencies
Interpreting IR spectrum
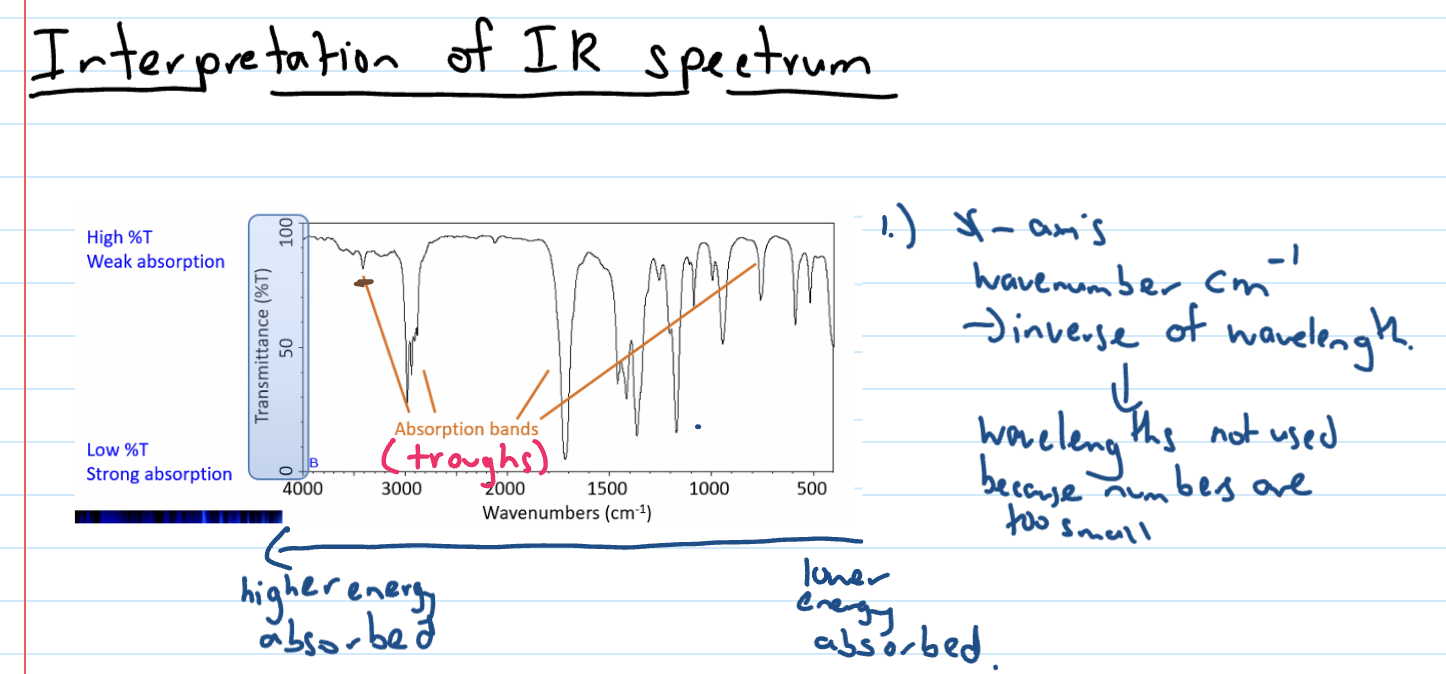
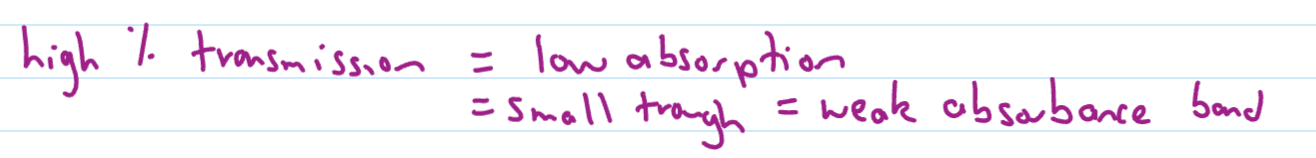
High % transmission
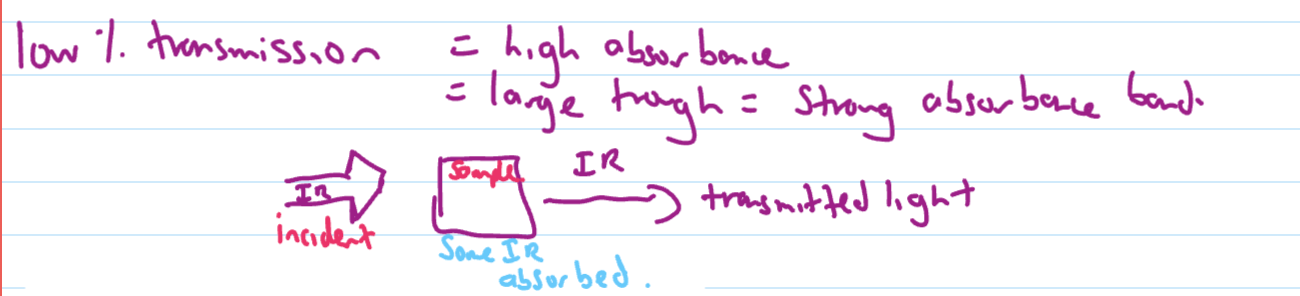
Low % transmission
Describing absorption bands
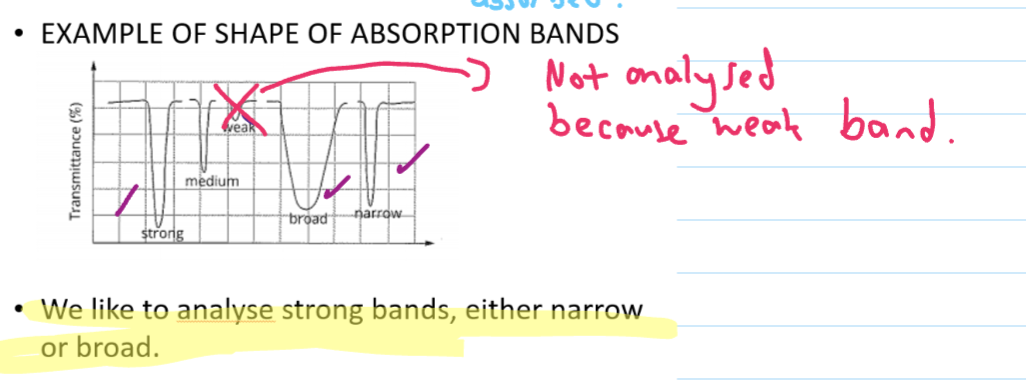
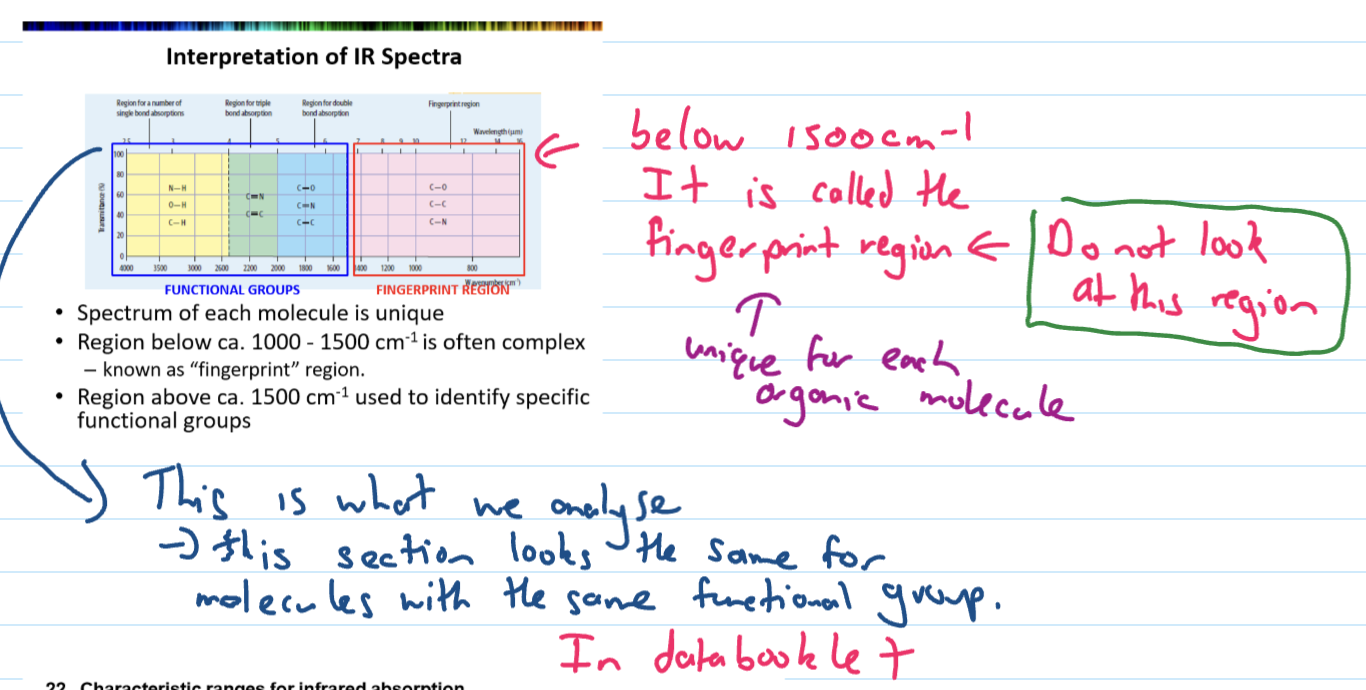
Below 1500cm-1
fingerprint region - we don’t look at this
unique for each organic molecule
Interpretation of IR - functional group region
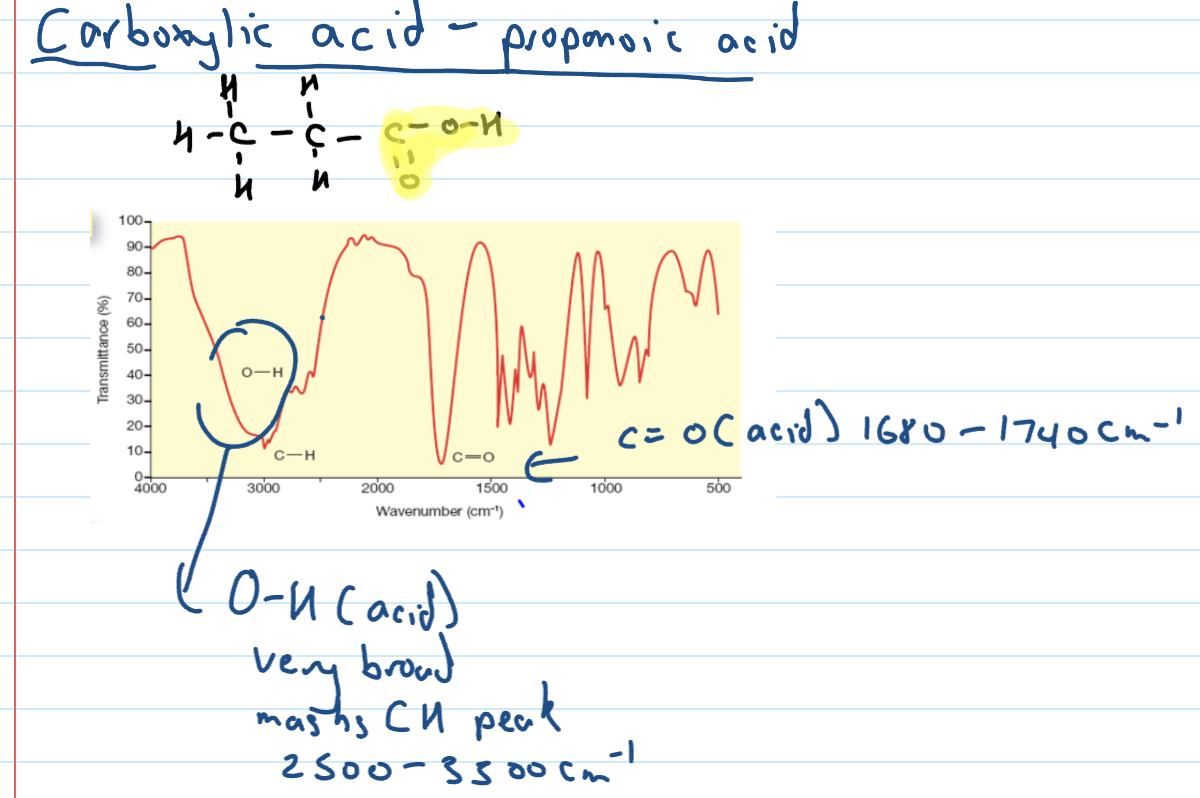
OH acids absorbance band
Stronger absorbance and very broad band that masks the CH peak
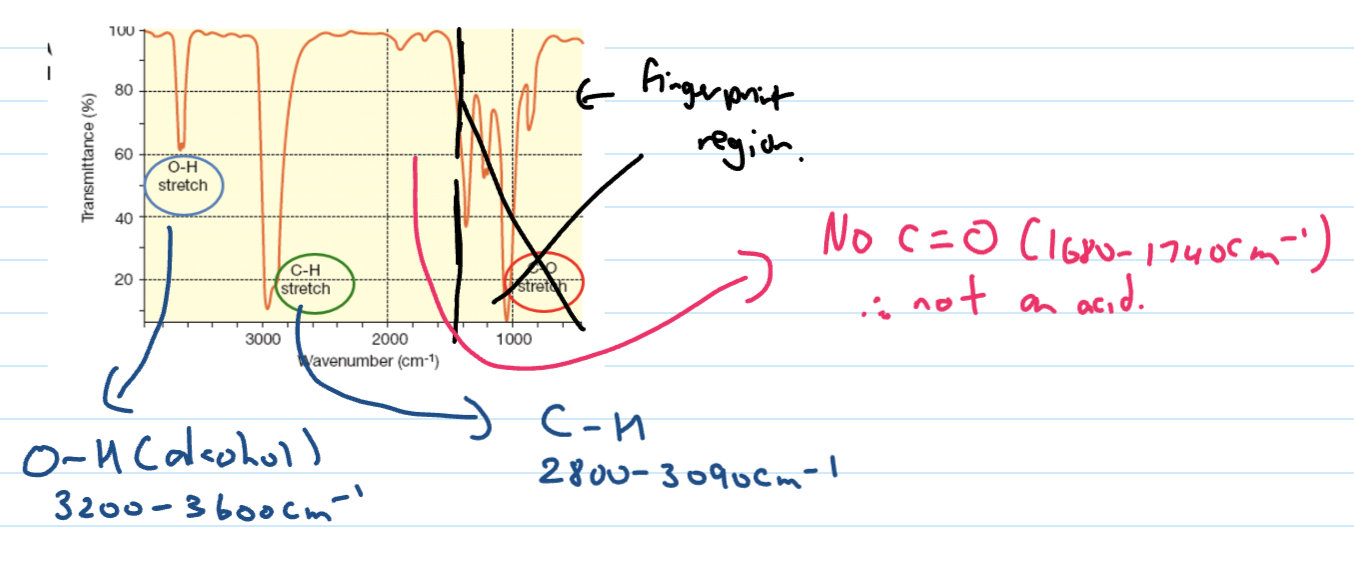
Alcohol IR spectra
Carboxylic acid IR spectra
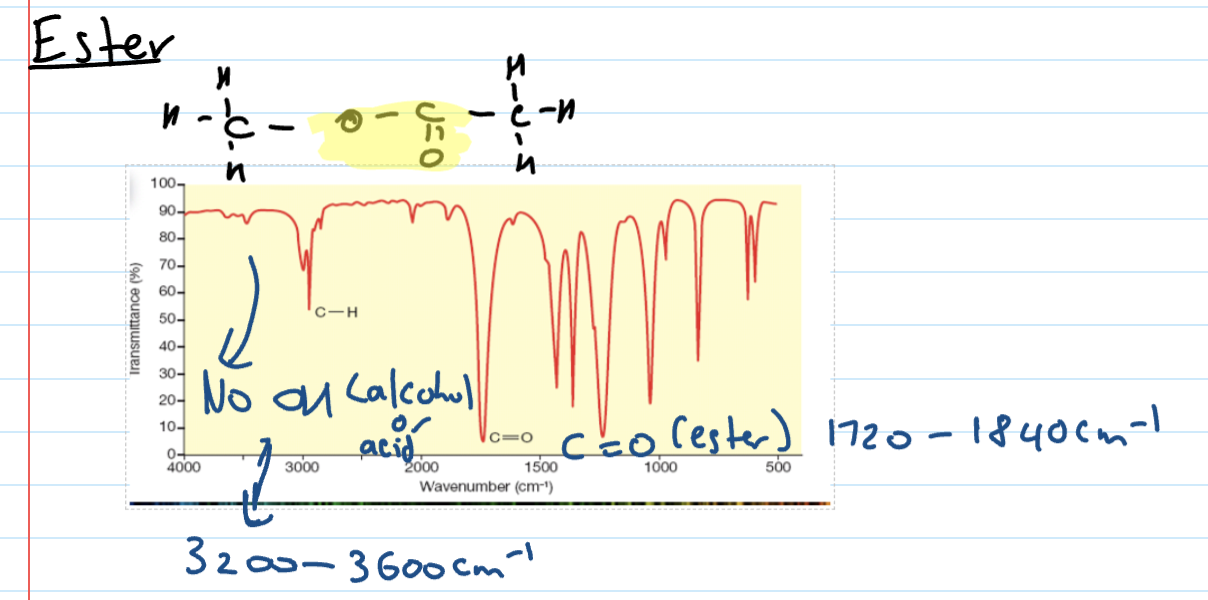
Ester IR spectra
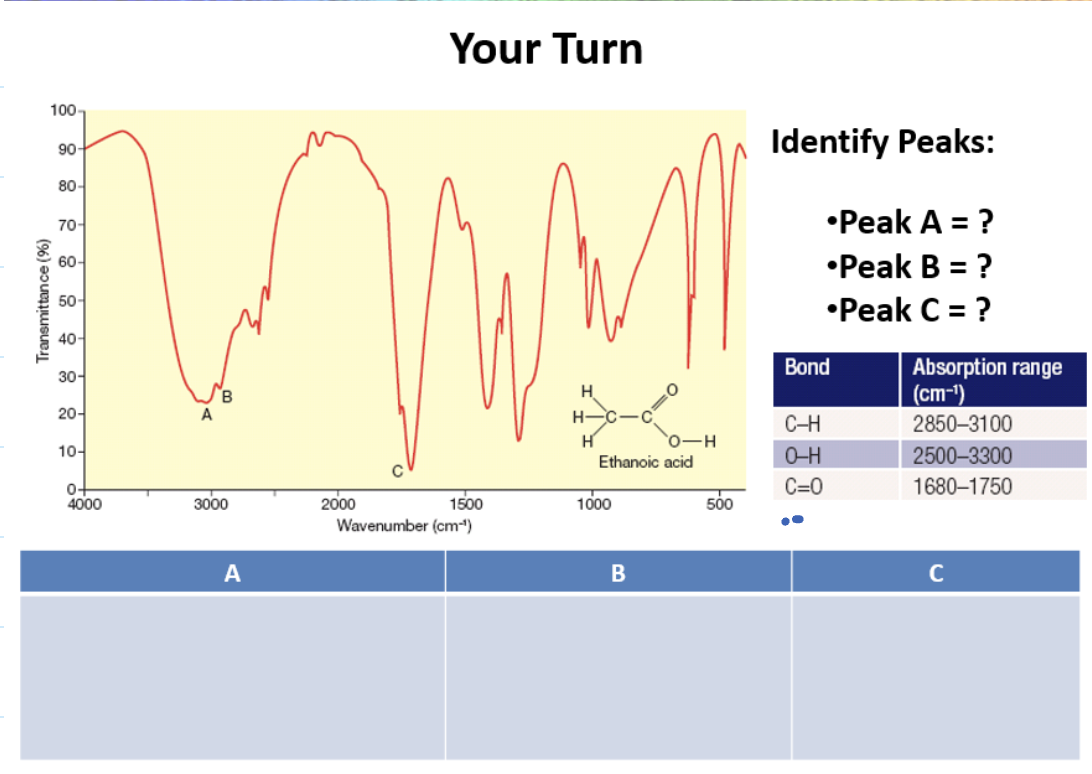
Peak A: OH (acid)
Peak B: CH
Peak C: C double bond 0
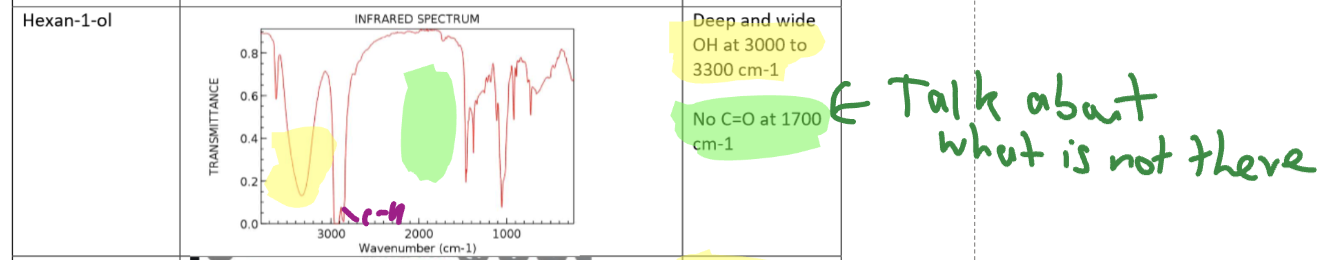
Alcohol (Hexan-1-ol) IR
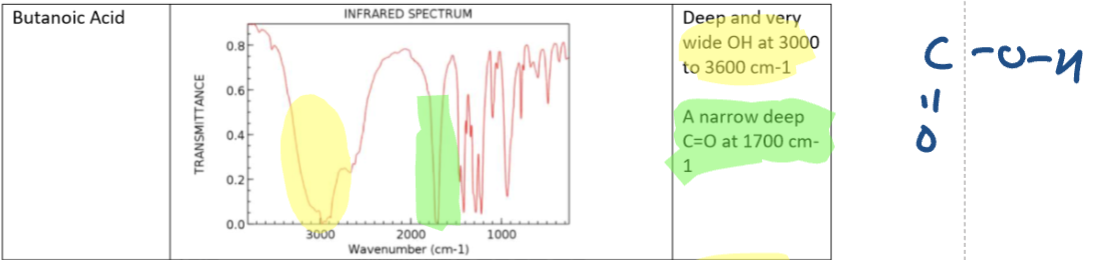
Carboxylic Acid (Butanoic Acid) IR
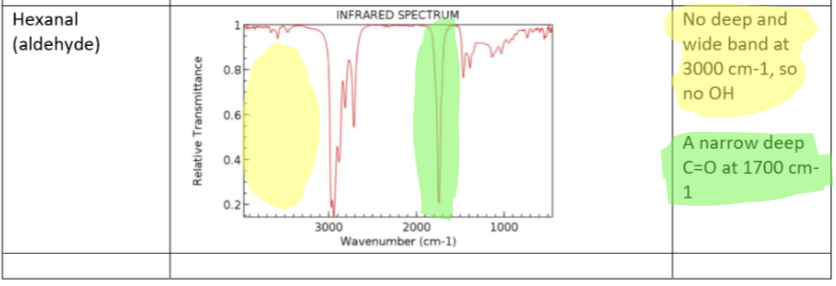
Aldehyde (Hexanal) IR
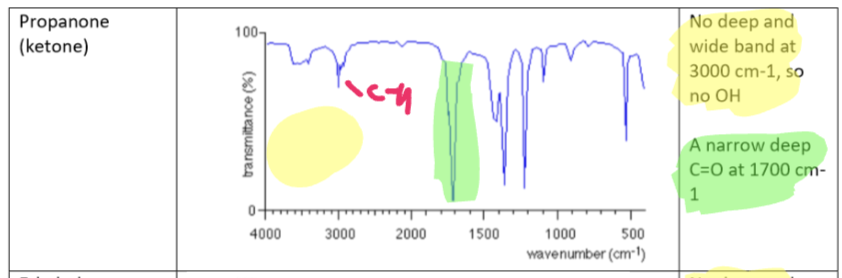
Ketone (Propanone) IR
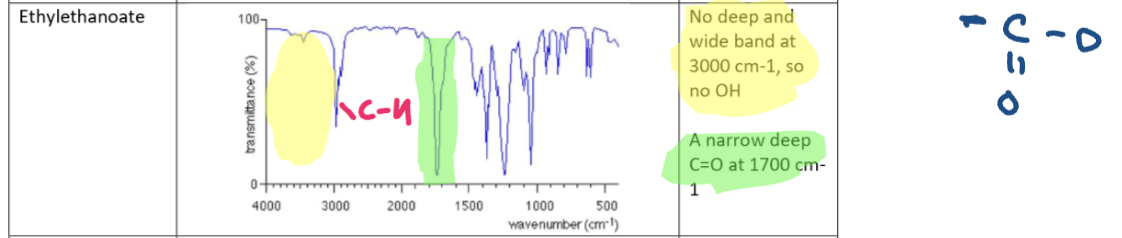
Ester (Ethyl Ethanoate) IR
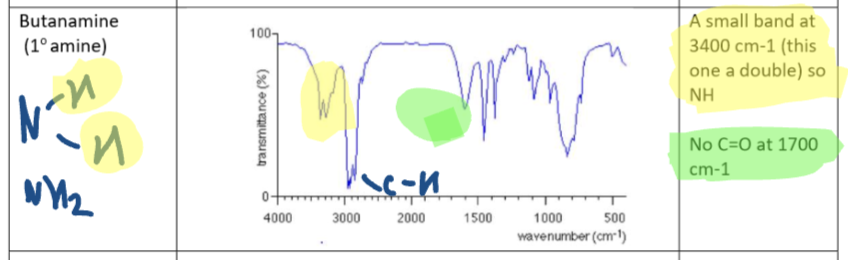
Amine (butanamine) IR
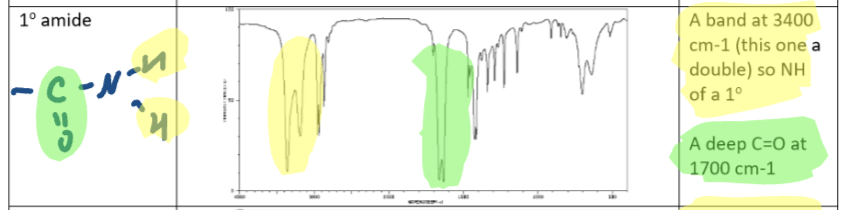
Primary Amide IR
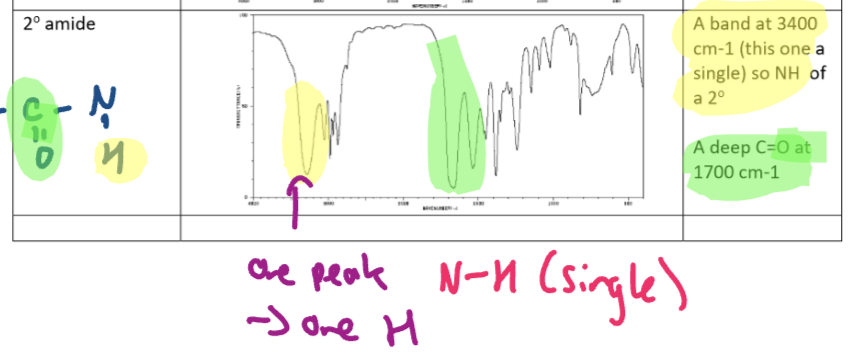
Secondary amide
NMR (nuclear magnetic resonance)
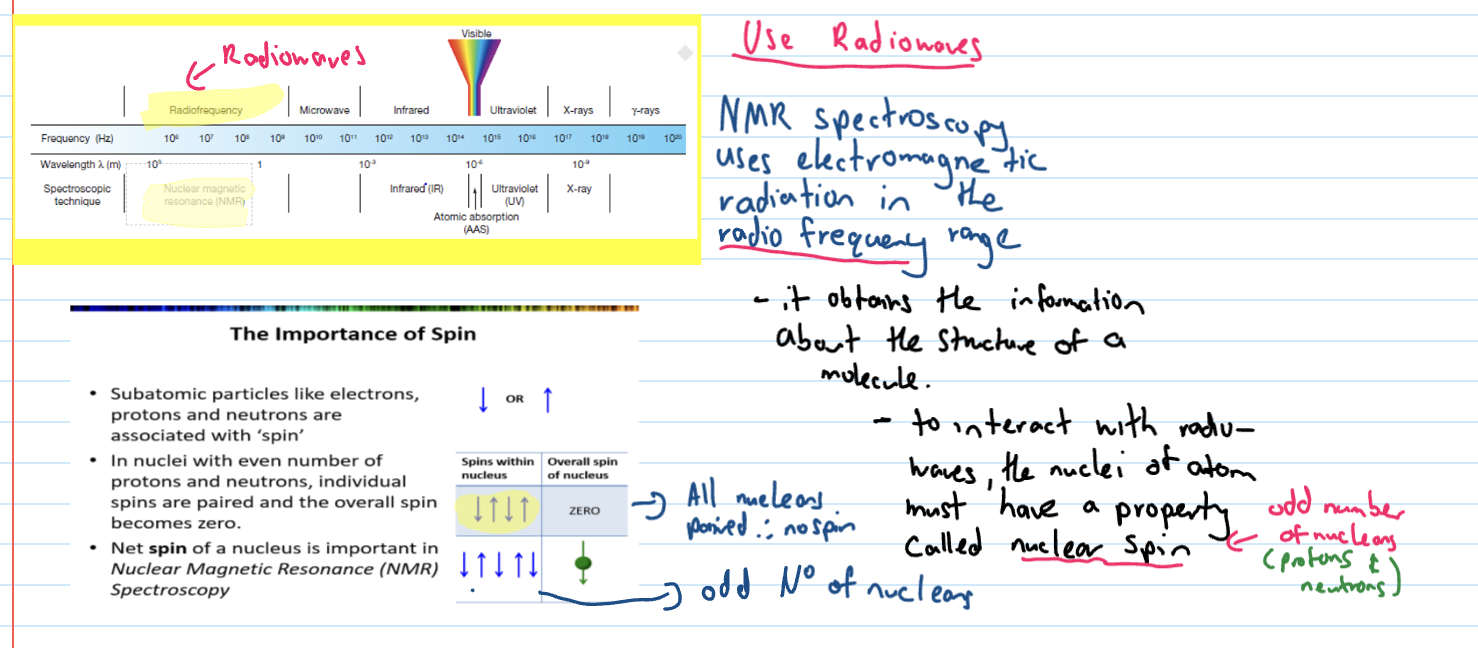
Which nuclei are NMR active?
must have odd number of nucleons and spin is what is registered
the orientation of spin
Carbon 13 NMR - why active
is active because there is an odd number of nucleons
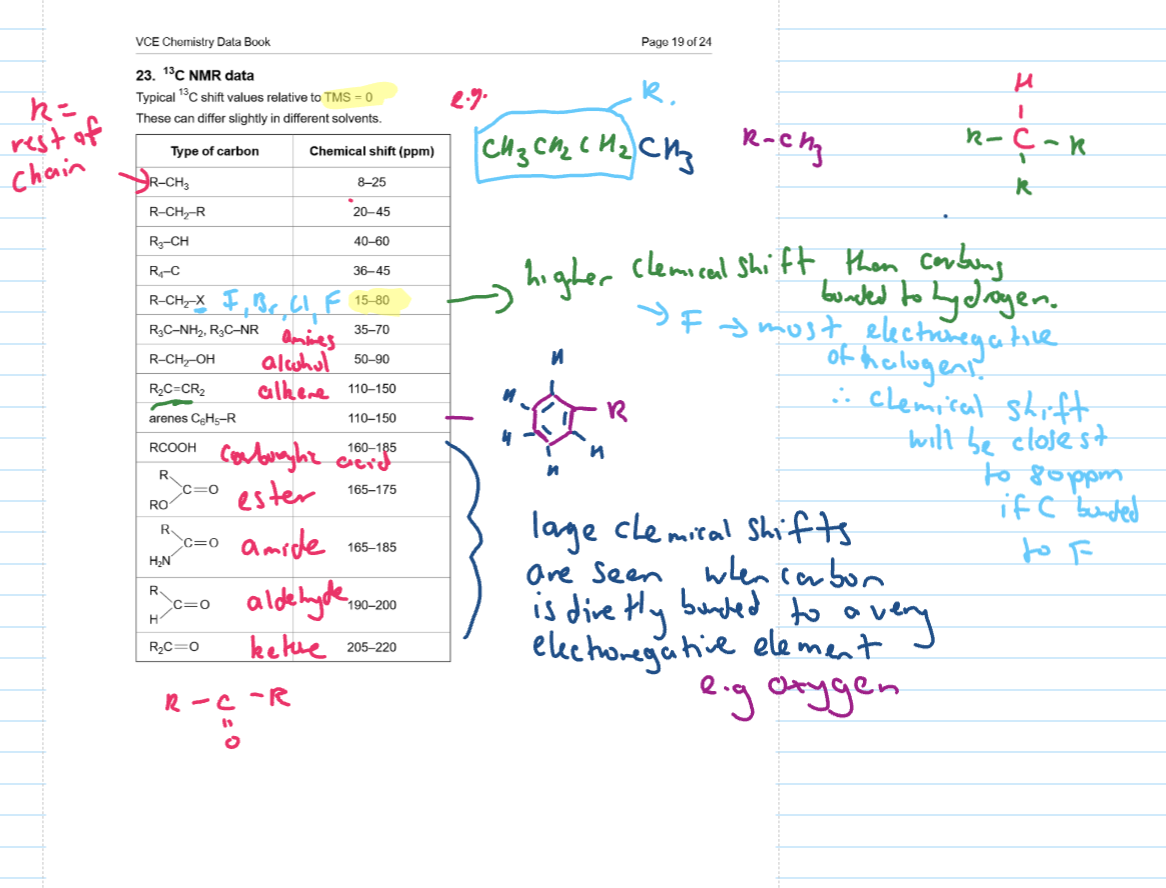
TMS (Tetramethylsilone)
reference peak
has a chemical shift of zero ppm
all other chemical shifts are compared relative to TMS
this is because same chemical shifts are the same no matter what NMR you use (consistency)
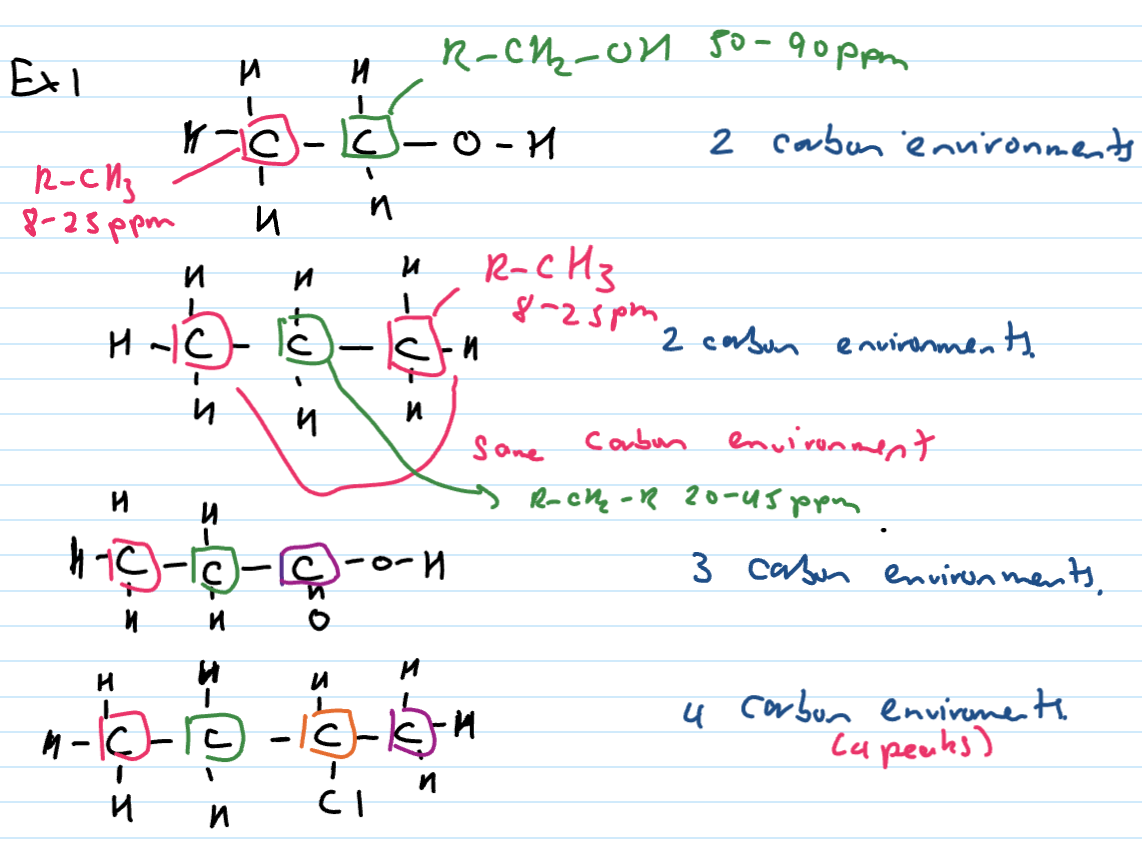
What does number of peaks represent (C-NMR)
represents the number of carbon environments
2 peaks = 2 C environments
Chemical shift (ppm)
identifies the type of carbons and it’s surrounding atoms
found in DB
Carbon environment
To be in the same carbon environment
carbons must be attached to the same number and type of atoms
neighbouring groups must be the same - look for symmetry
Trends in chemical shifts as per DB
Low Res H-NMR Number of peaks
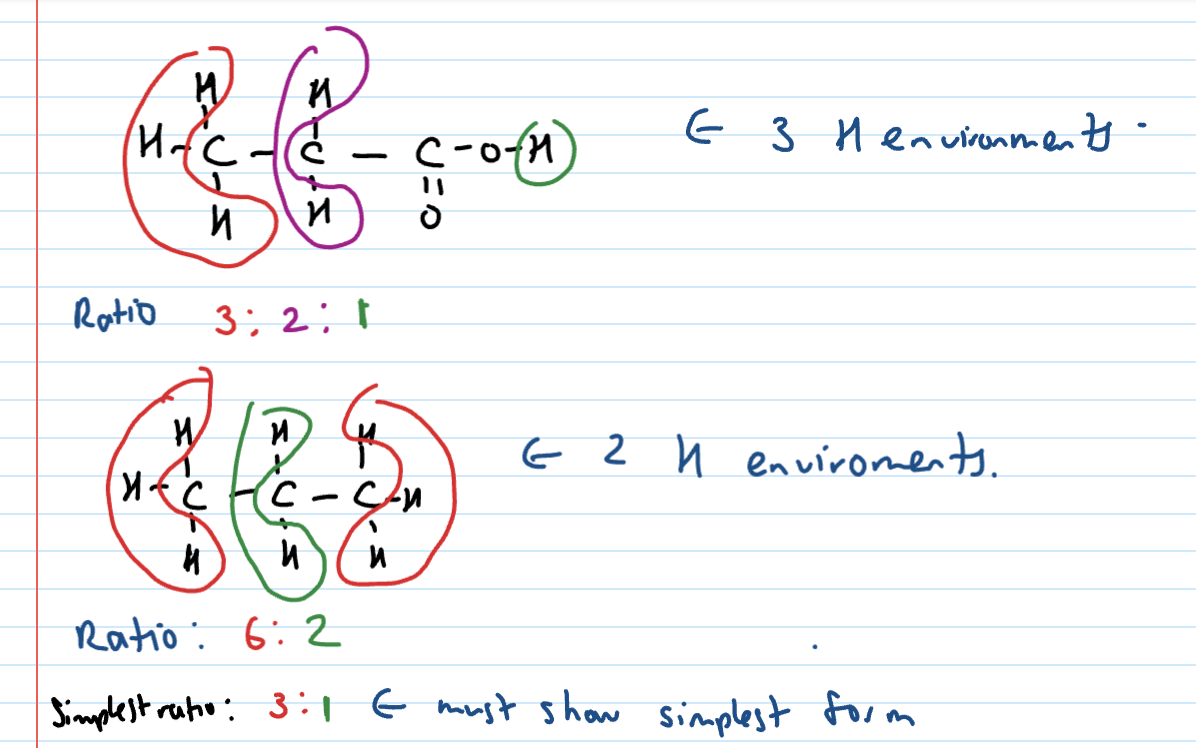
represents the number of hydrogen environments
3 peaks = 3 H environments
Area of peak/Integration
Represents the ratio of hydrogens in the environment
eg. 3:2:3
Chemical shift H-NMR
identifies the type of hydrogens and surrounding atoms (chemical environment)
It also tells you about shielding
in DB
Hydrogen environments
To be in same hydrogen environment…
Must contain the same number of hydrogens
The H’s must be attached to the same type of atom
The neighbouring groups must be the same - look for symmetry
Shielding
The nucleus does not feel the full effect of the radio frequency
Electrons spin and produce very small magnetic field
Nucleus is partly shielded by the spinning electrons around it
Elements with high electroneg have a greater share of e- in covalent bond
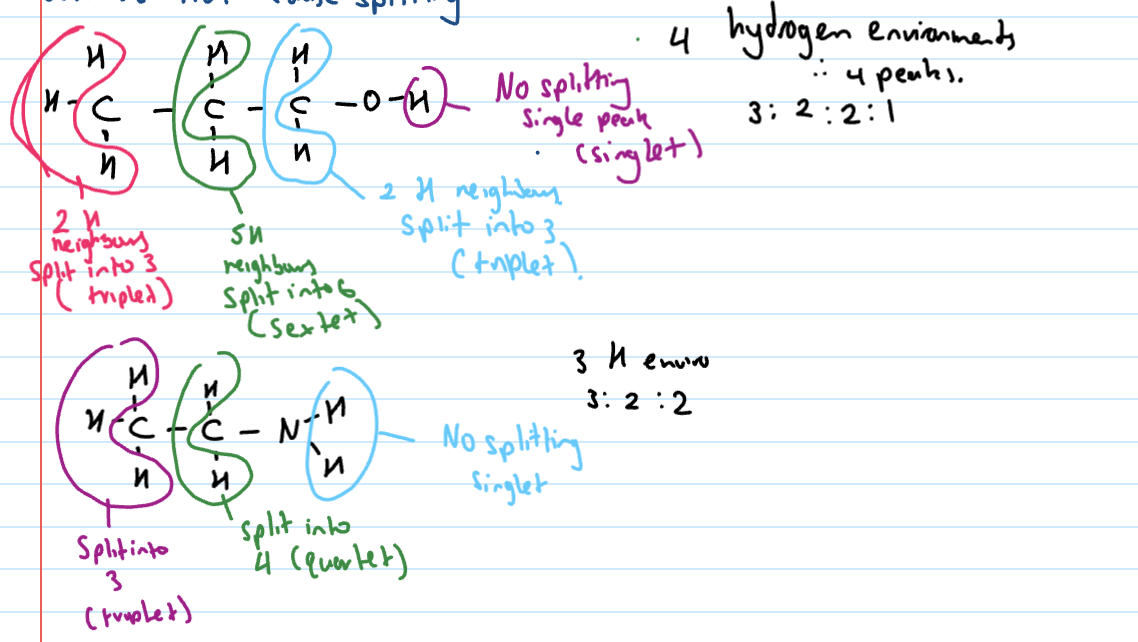
High Res H-NMR
chemical shift, peak area and number of signals still give same info as low res BUT splitting signals in high res also tells us about the number of protons on neighbouring carbons
Difference bw high res and low res H-NMR
low res = no splitting
high res = splitting
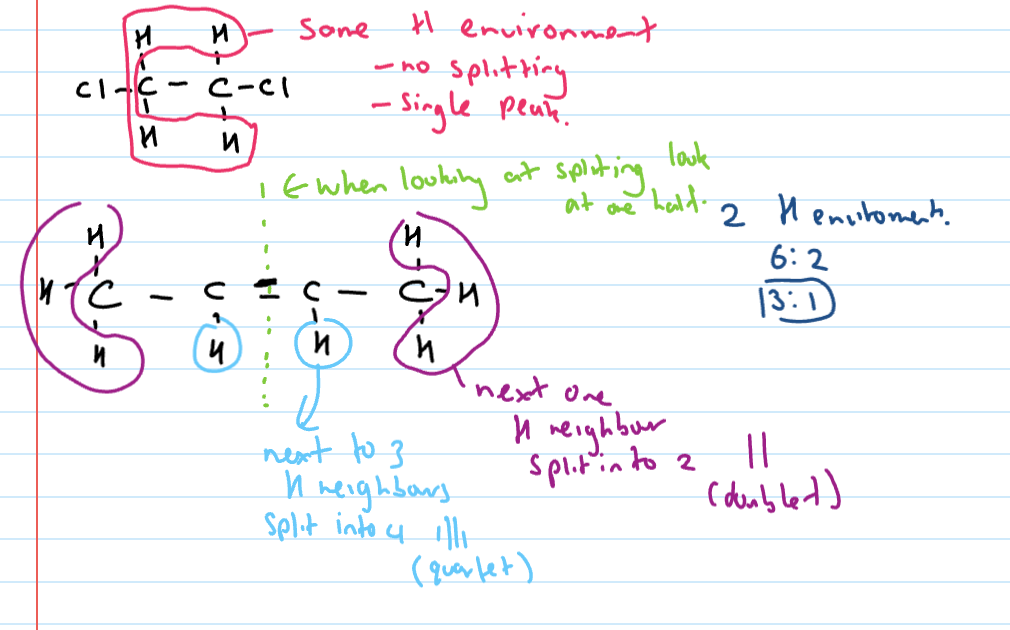
Splitting
H environment has hydrogen neighbours that are attached to a carbon
n + 1 rule used to determine how many bands it’s split into
Tricky points with H-NMR splitting
Hydrogens bonded to anything but carbon do not split and do not cause splitting
Hydrogens in same environment and next to each other are not split (i.e only one H-envir present = 1 peak only)
Example of Hydrogens not bonded to carbon
Combined spectra - what you can get out of each technique
Analytical technique
separating mixtures (organic substances) into components
Qualitative analytical technique purpose
get an idea of components in a mixture by comparison to pure sample
Quantitative analytical technique
tells you how much of a substance is present
Components of HPLC
form of column chromotography, involves…
liquid mobile phase (solvent)
solid/viscous liquid stationary phase
Mobile phase
moves through the stationary phase and carries the components of the mixture
in HPLC, pumped under high pressure bc stationary phase has large surface area which causes resistance to flow of mobile phase
stationary phase
stays still
solid (or viscous liquid) attached to tiny beads
substances in a mixture will have different affinity for stationary phase
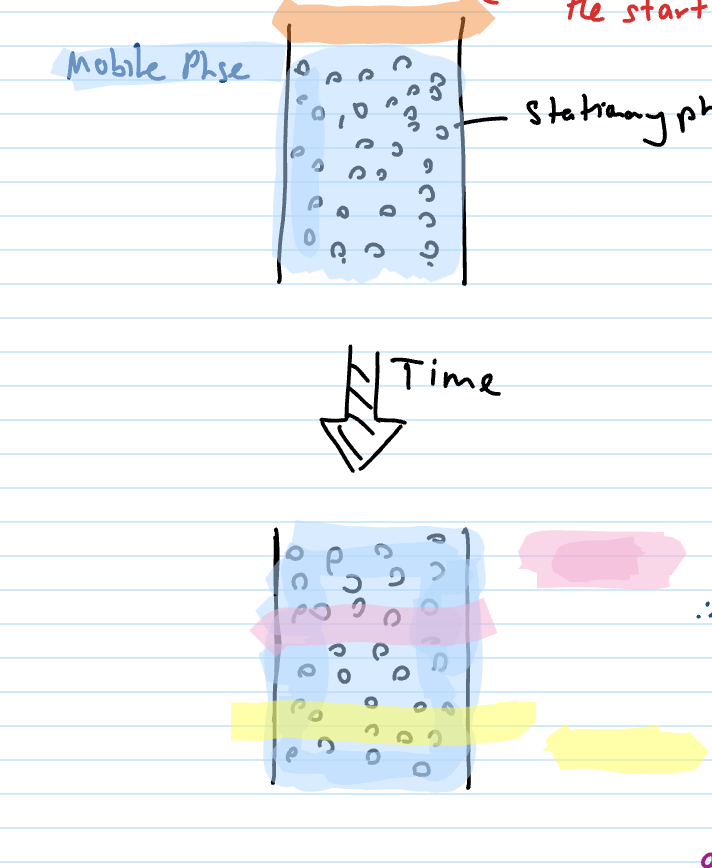
In the column (process) + explain pink and yellow affinities
samples loaded at start of column (stationary phase is beads in pic)
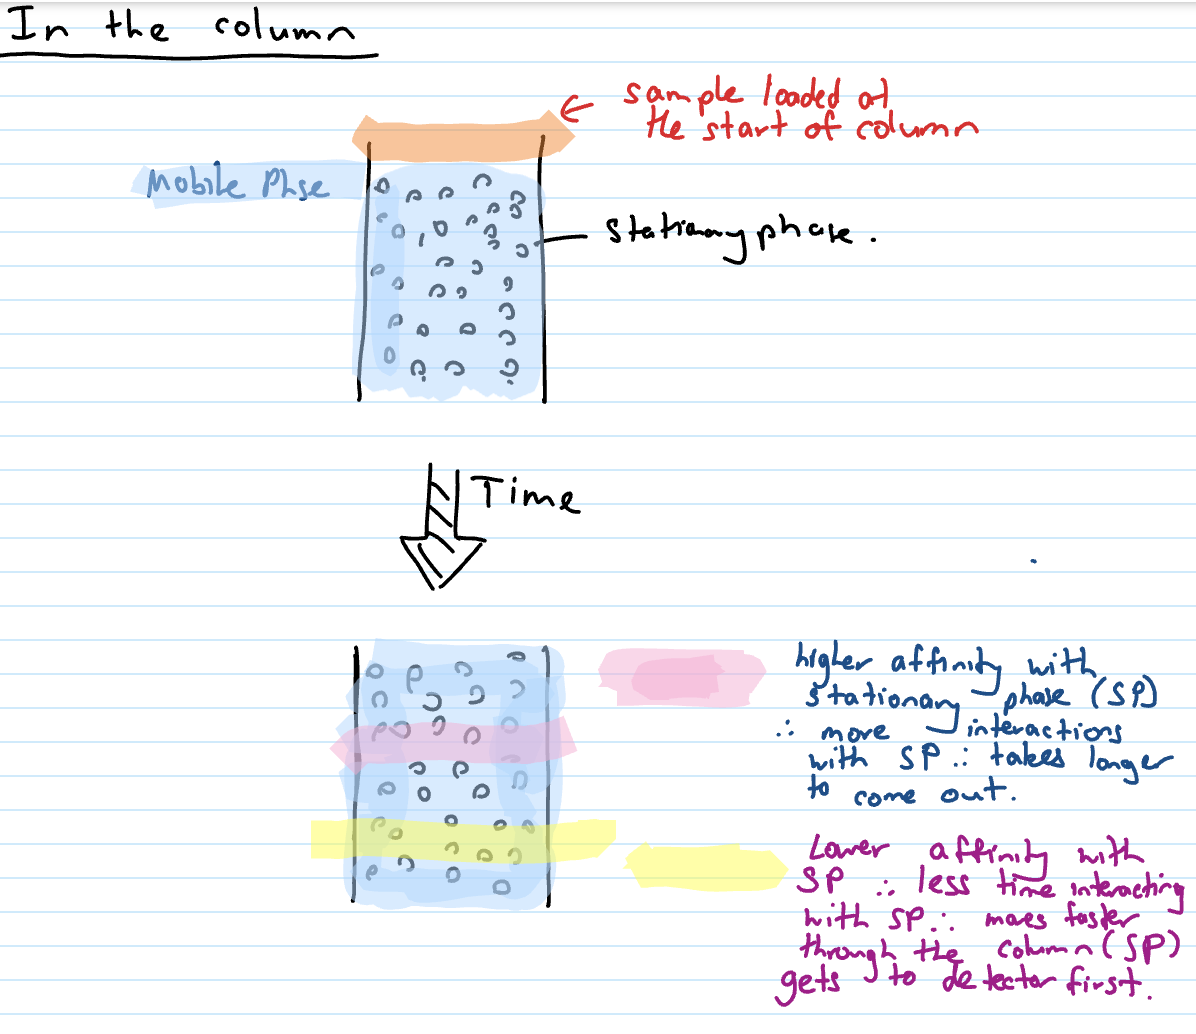
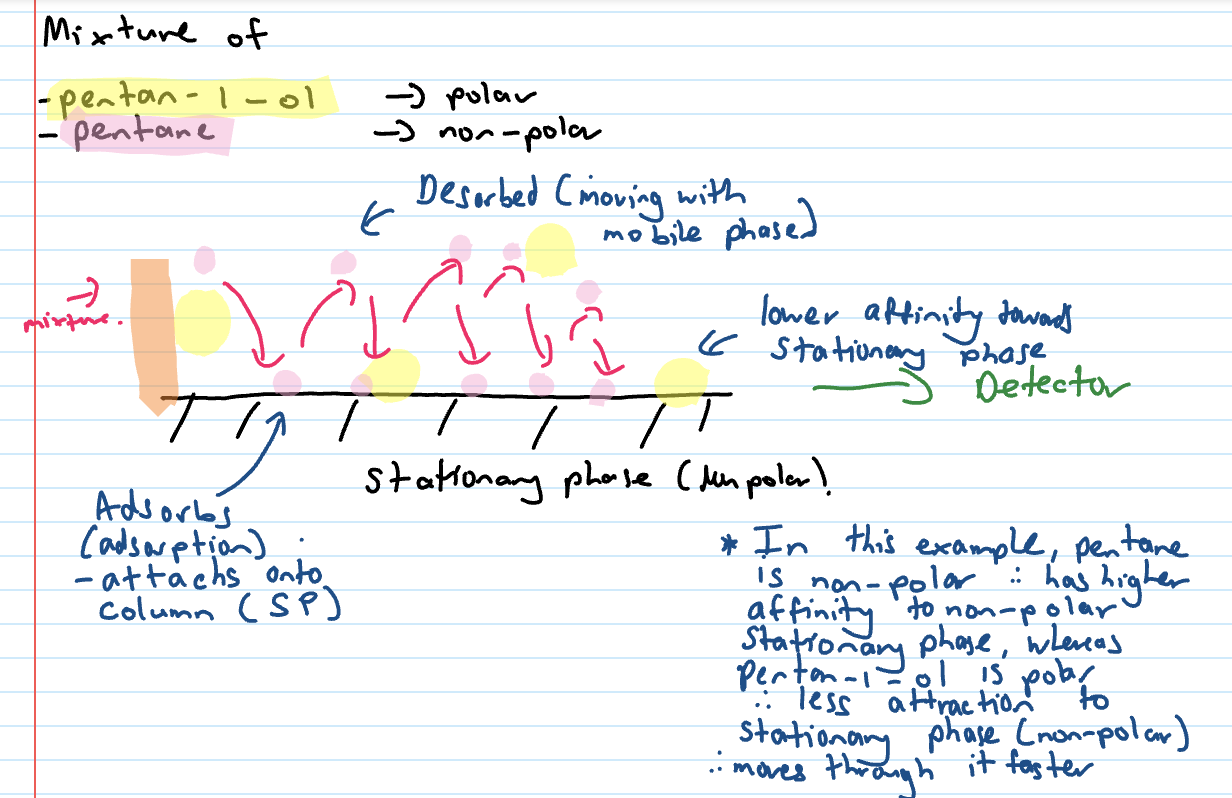
Adsorbs
attaches onto column (SP)
Desorbed
moving WITH mobile phase (lower affinity to stationary phase)
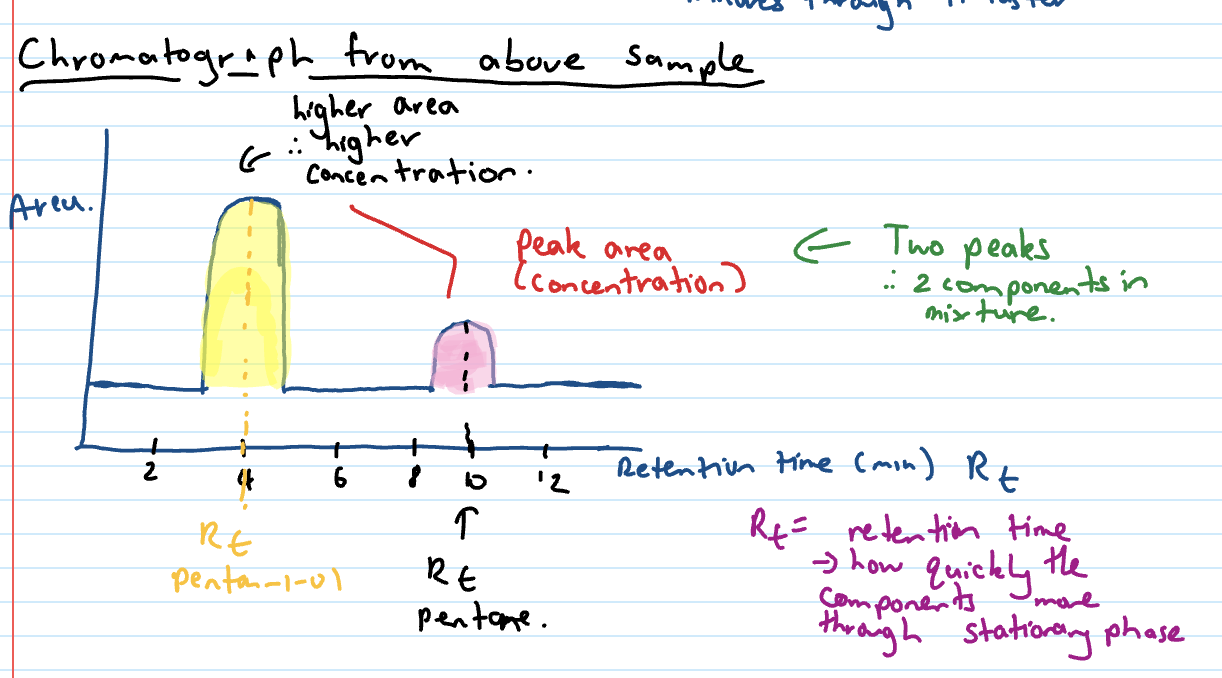
Pentane vs pentan-1-ol example in non polar SP
Chromatograph x and y axes
x axis = retention time (mins)
y axis = area
retention time
how quickly the components move through the stationary phase
Area under curve on chromatograph
the concentration - higher area = higher conc
If not told polarity of SP or all molecules have similar polarity…(CG)
eg. all alcohols
larger molecules will have a higher affinity towards the stationary phase (higher Rt) since dispersion forces will be larger SINCE GREATER NO. OF E-
Chromatograph from pentan-1-ol and pentane
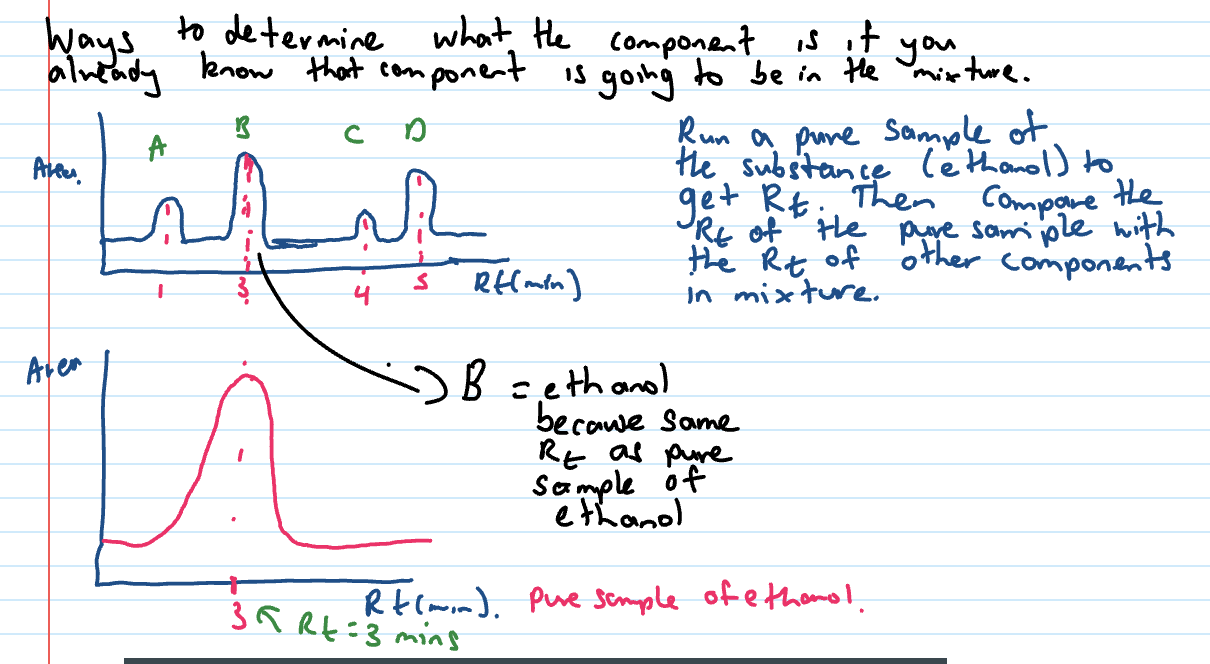
HPLC qualitative analysis
analysis that tells you what your molecule is
retention time is used
if same conditions used (same SP, MP, temp, pressure that MP pumped through) the Rt will always be the same
run the sample through + compare Rt times with DB times
ethanol qualitative analysis
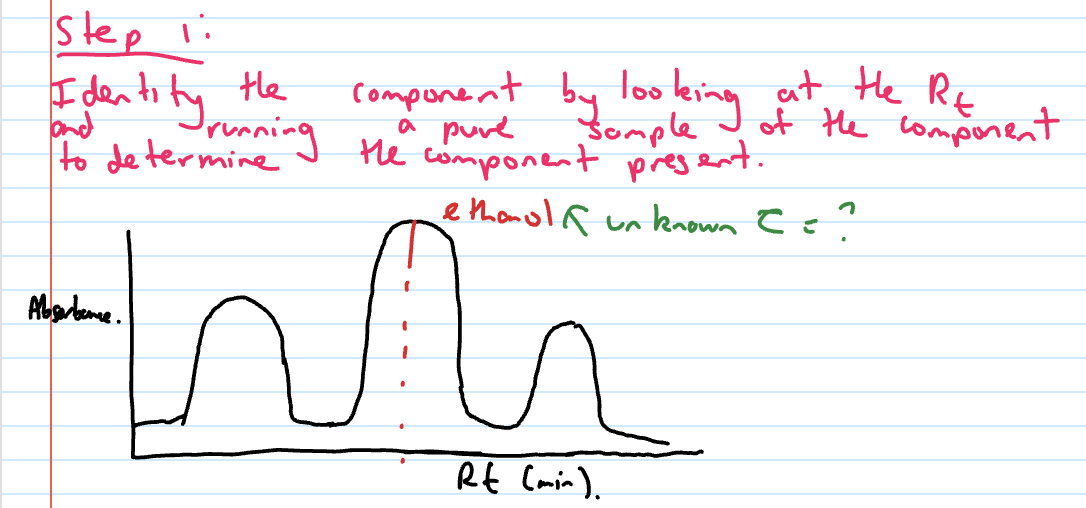
HPLC Quantitative Analysis
Enables you to determine how MUCH of the component is present in the mixture
HPLC Quantitative analysis step 1
Identify the component by looking at the Rt and running a pure sample of the component to determine the component present
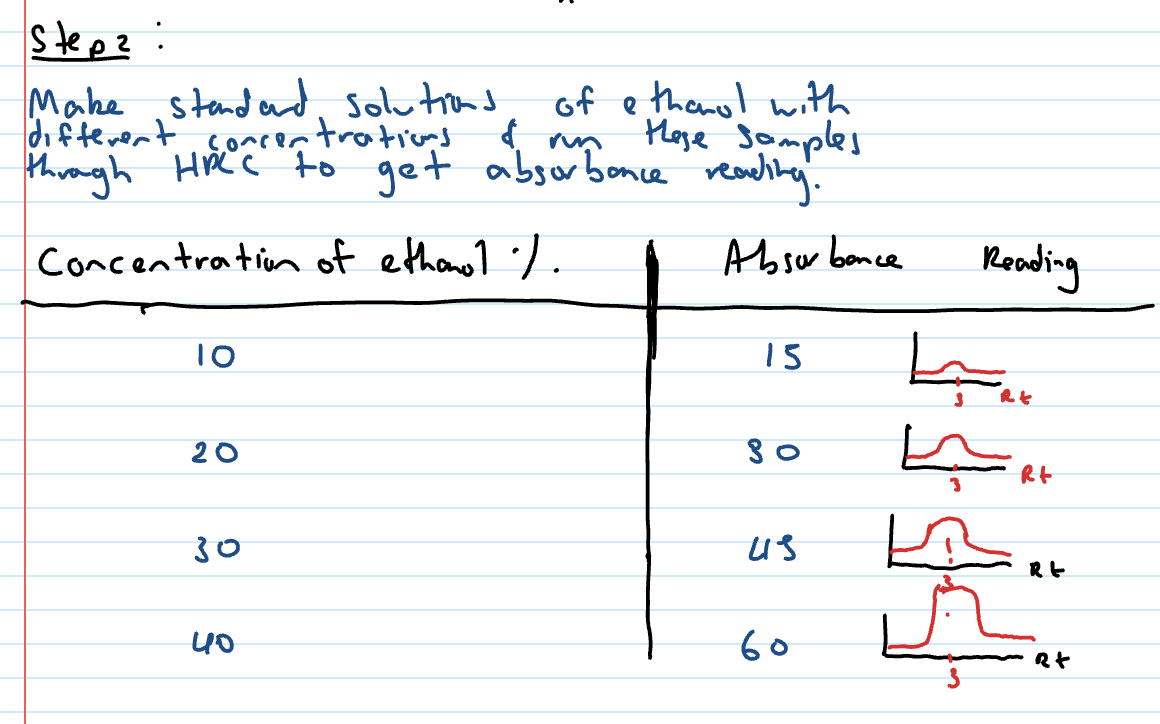
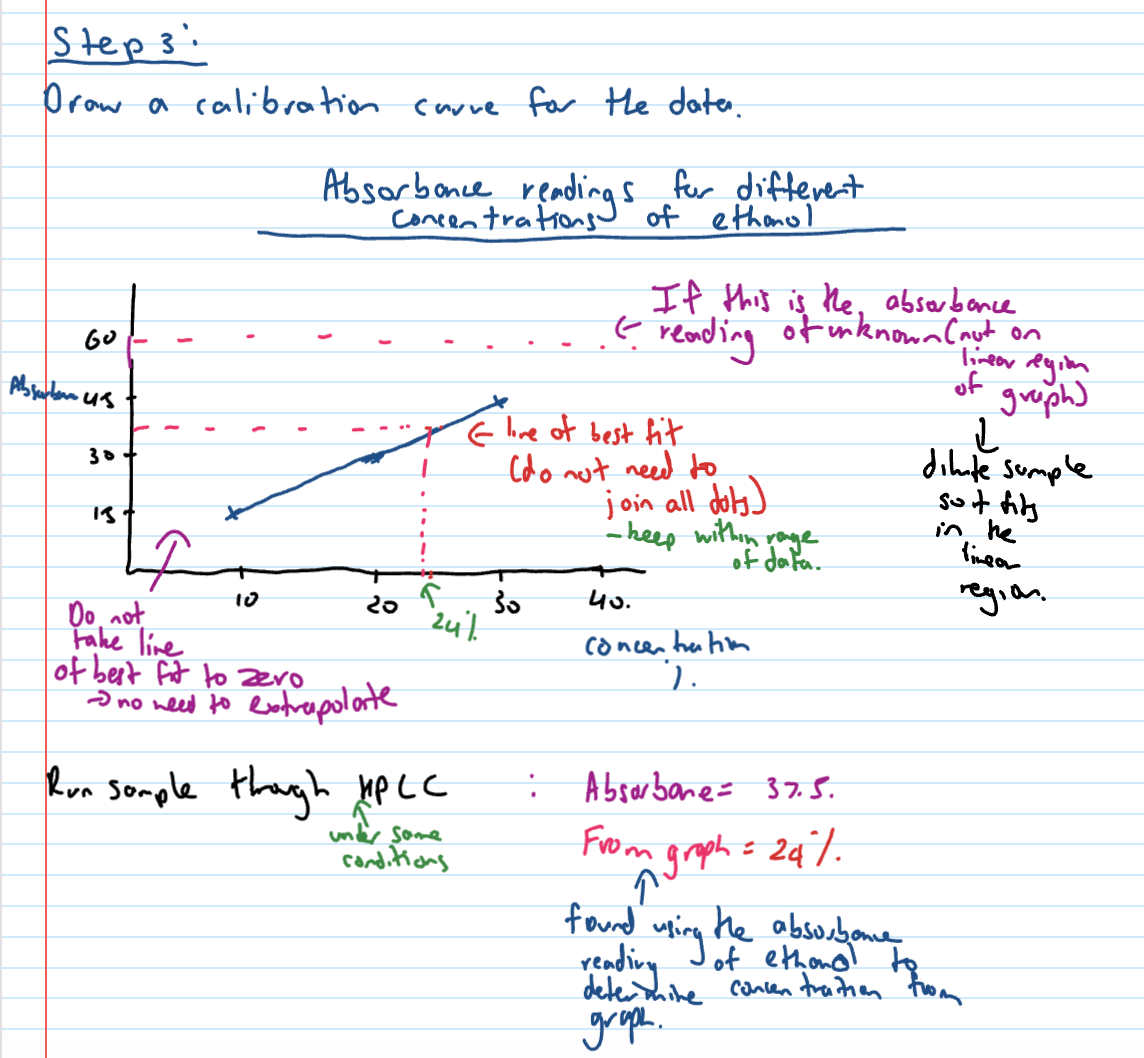
Make standard solutions of ethanol with different concentrations and run the samples through HPLC to get absorbance reading
HPLC Quantitative analysis step 2
HPLC Quantitative analysis step 3
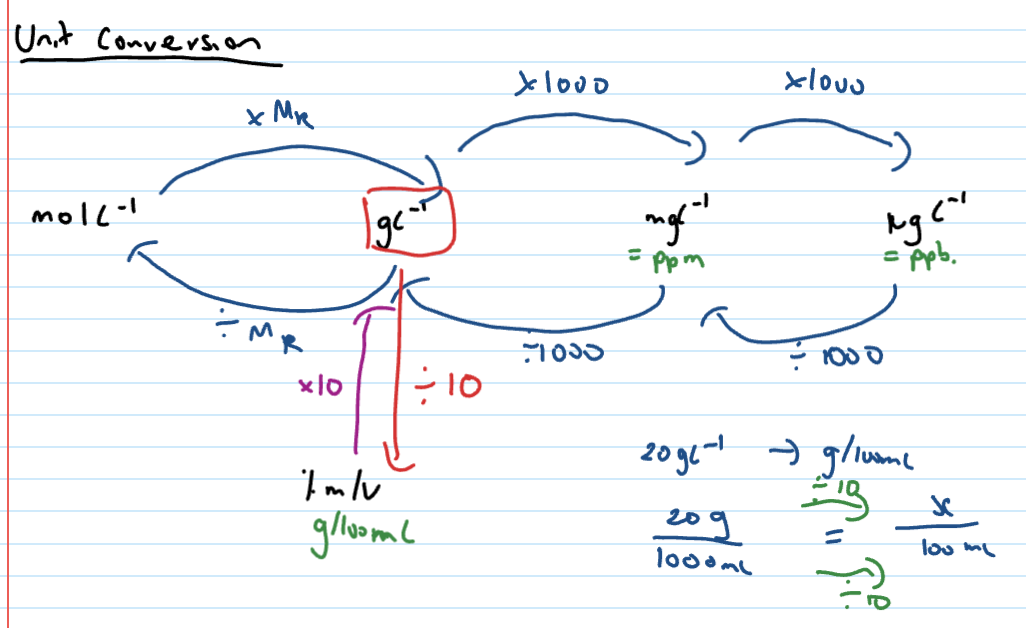
unit conversions
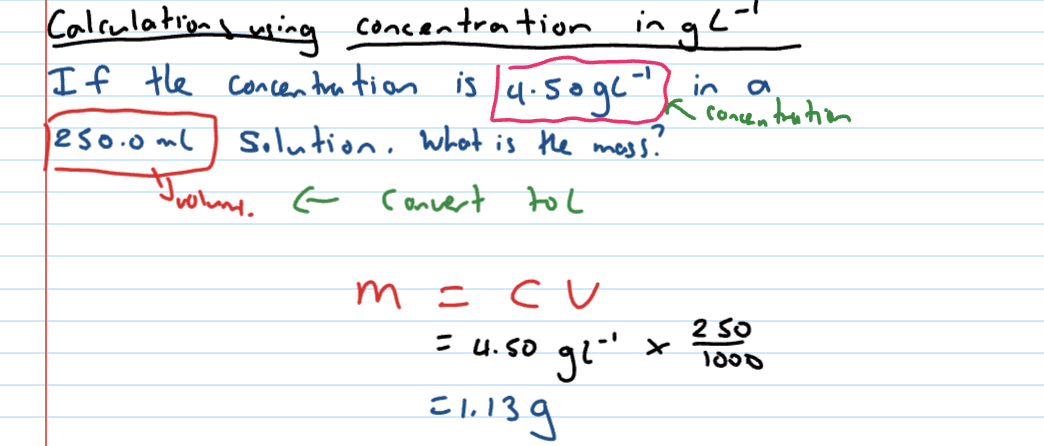
Calculating concentration in gL-1
Dilutions formula
C1V1 = C2V2
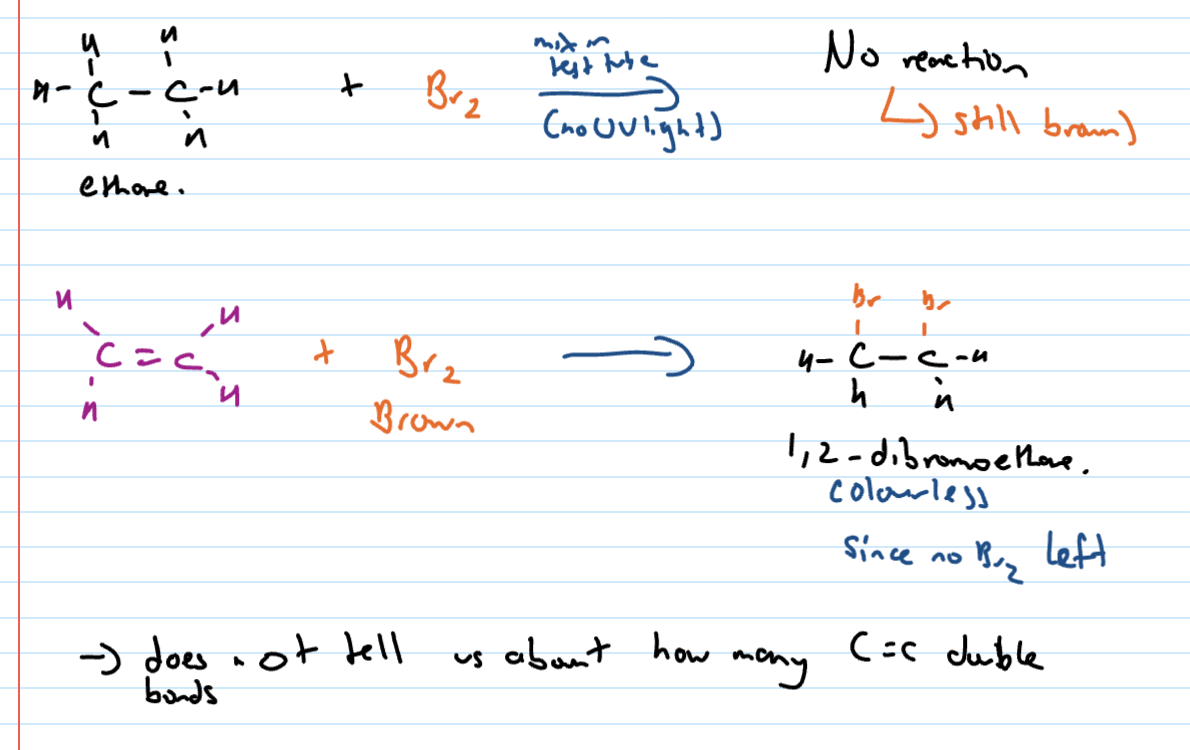
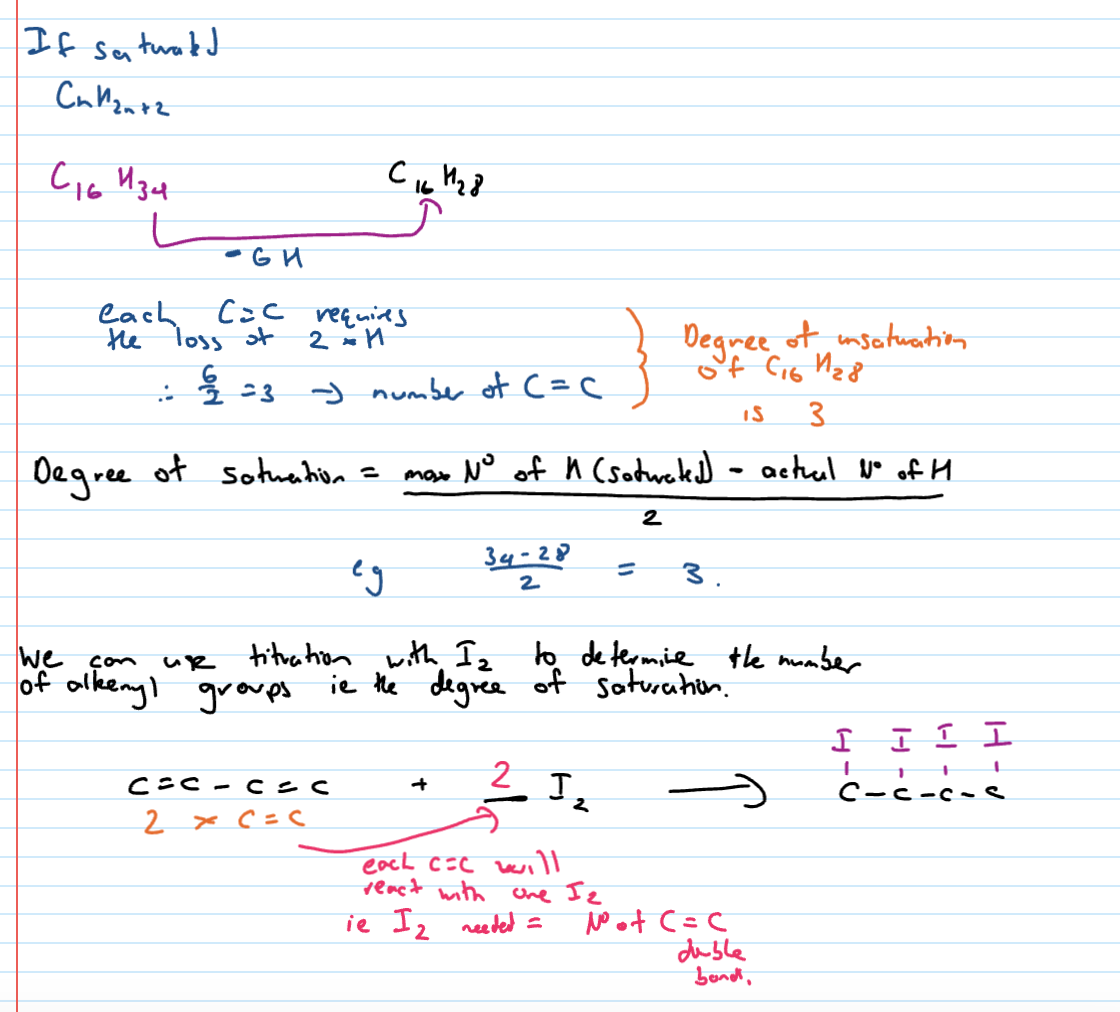
Testing for presence of C=C (alkenyl)
bromine test : brown → colourless (DB)
iodine test : brown → colourless (DB)
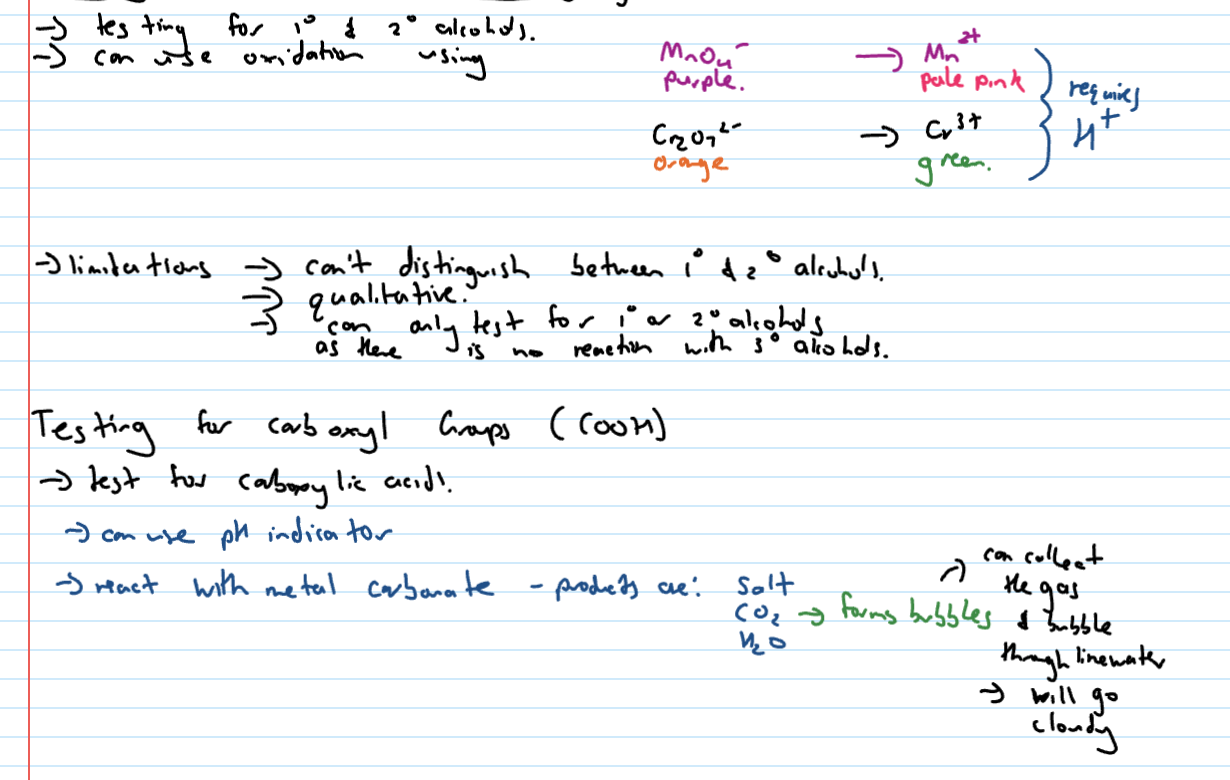
Testing for presence of OH (primary of secondary)
MNO4- : purple to very pale pink
Cr2O72- : orange to green
Detecting presence of alkenyl (C=C)
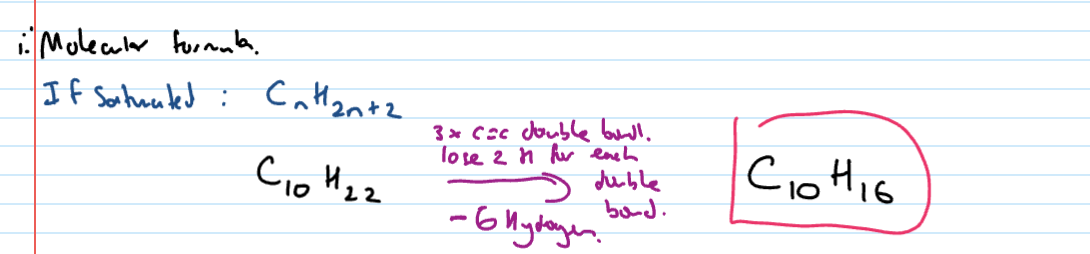
Degree of unsaturation
tells us the number of C=C in a molecule
How many C=C in C16H28
Molecular formula and degree of unsat
Testing for presence of OH
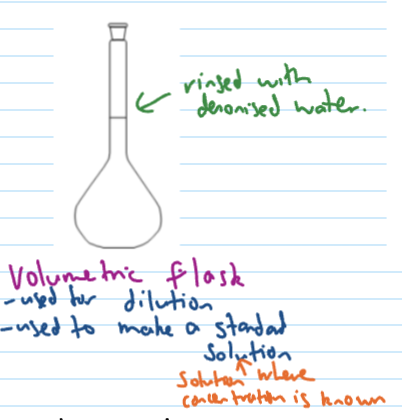
precision glassware for titration
pipette, burette, volumetric flask
same volume every time as long as used correctly
Volumetric flask (rinsing + use)
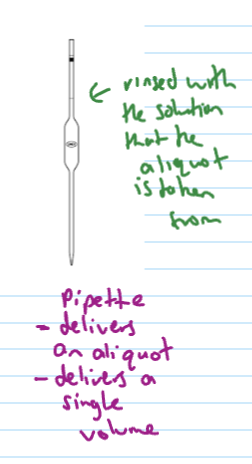
pipette (rinsing + use)
burette (rinsing + use)
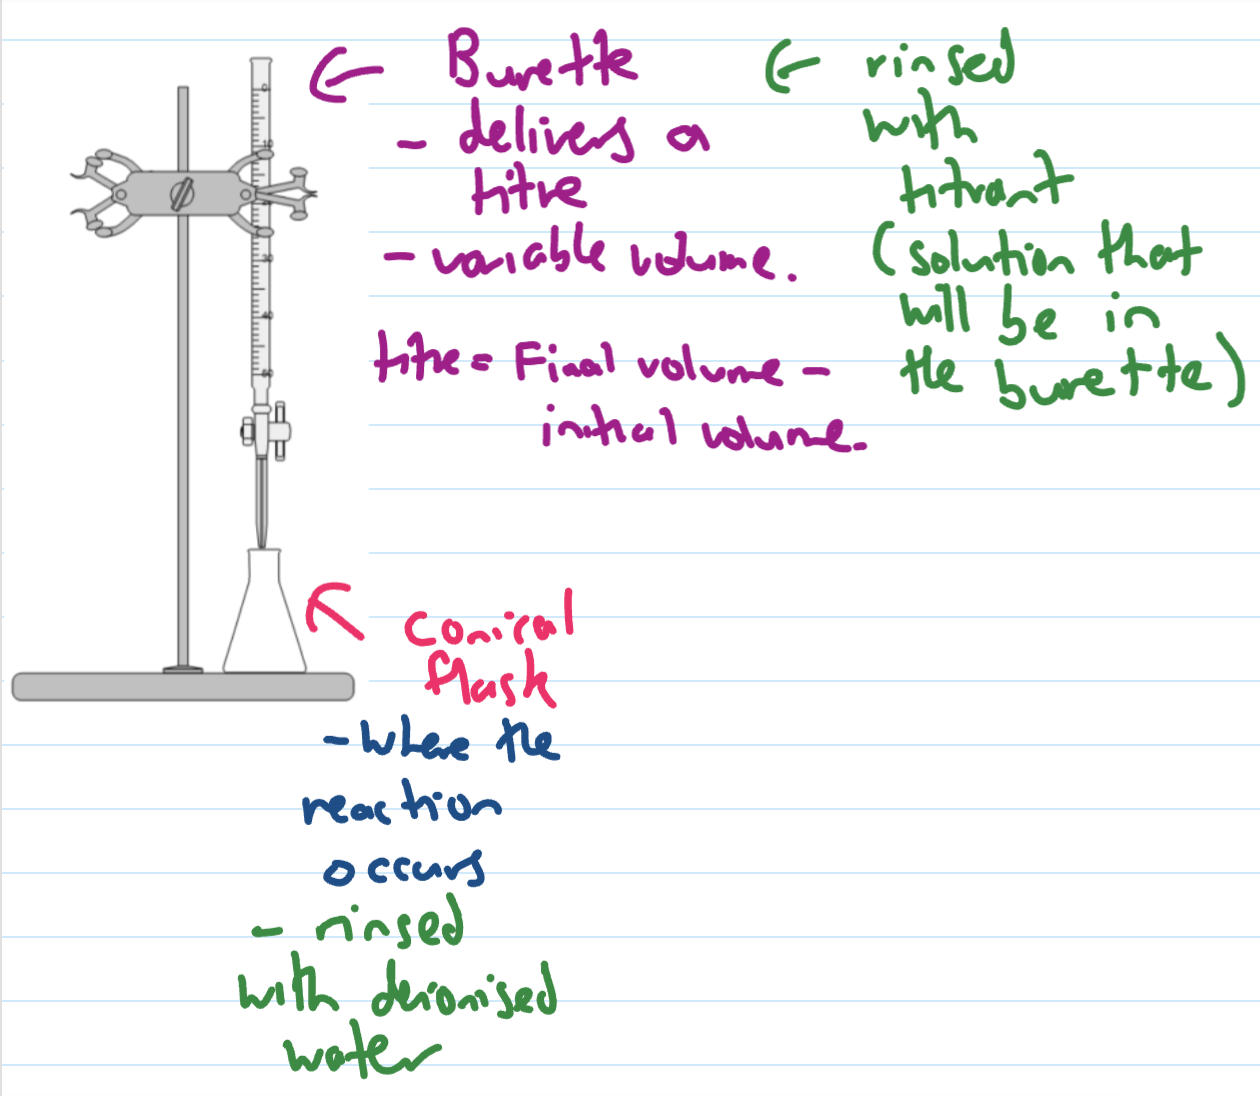
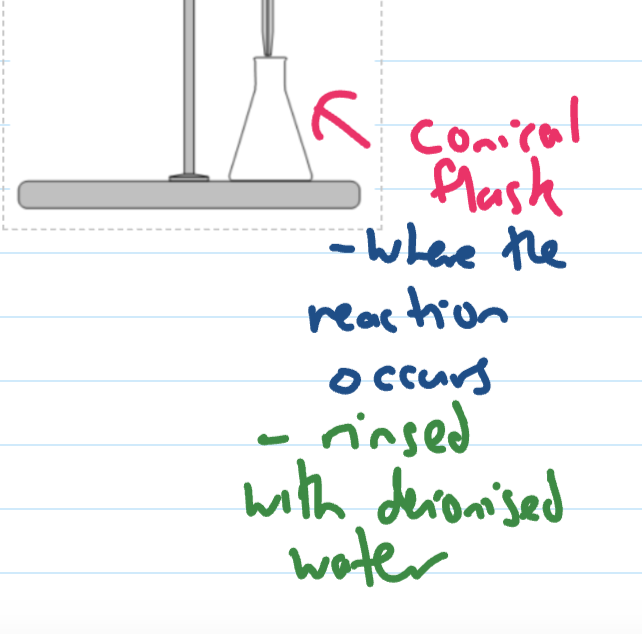
conical flask (rinsing and use)
simple titration steps
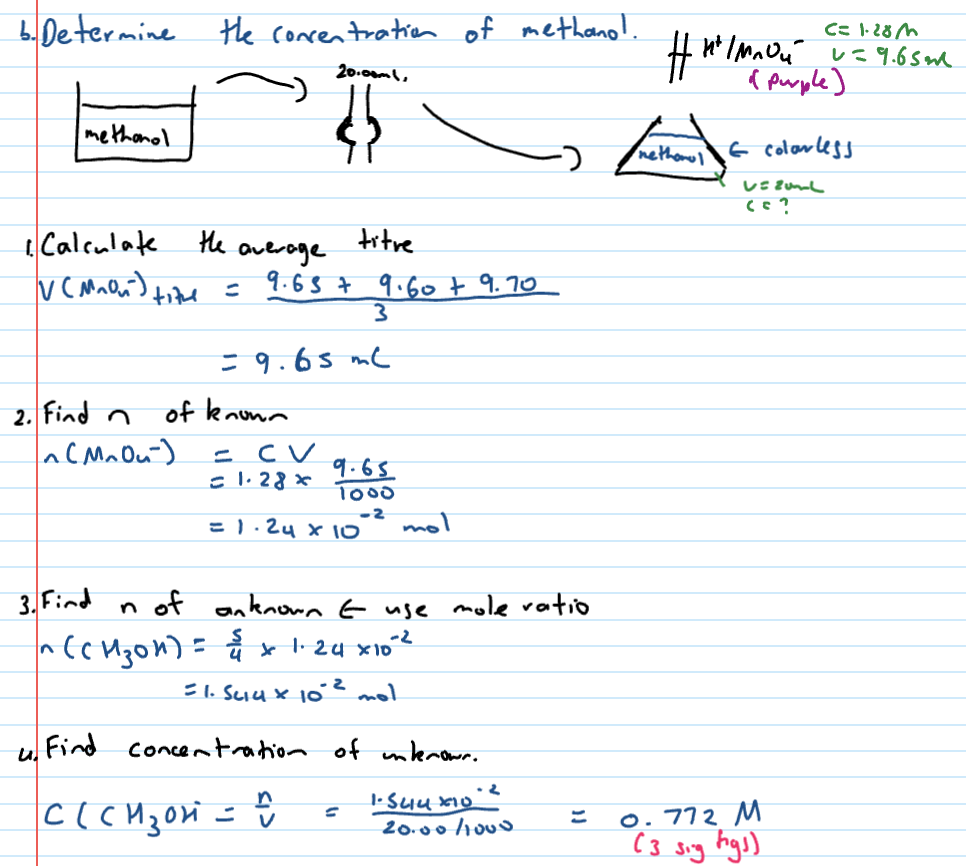
the solution of unknown conc goes into the pipette and then into the conical flask
concordant results
titrations have to be repeated until concordant results are obtained. This increases PRECISION. Concordant results in titrations need to be 0.1mL apart from each other - all results must be within in 0.1mL range
Titres
the actual mL from burette used (final - initial)
Colour changes
redox reaction colour changes depends on reactants and products - look at DB
aliquot goes in…
conical flask
Steps with question like - “20mL aliquot of methanol is reacted with 1.28M MnO4-/H+ with 9.65mL, 9.60mL and 9.70mL - determine concentration of methanol”
Equivalence point
The point during a titration when the reactants in solution are present in stoichiometric proportions
i.e. in the mole ratio shown by the reaction equation.