10.1 - The nature of ecosystems
1/34
There's no tags or description
Looks like no tags are added yet.
Name | Mastery | Learn | Test | Matching | Spaced | Call with Kai |
|---|
No analytics yet
Send a link to your students to track their progress
35 Terms
What is the definition of an ecosystem?
A reasonably, self-contained area together with all its biotic & abiotic organisms, which ranges in size (e.g. garden pond to oak forest)
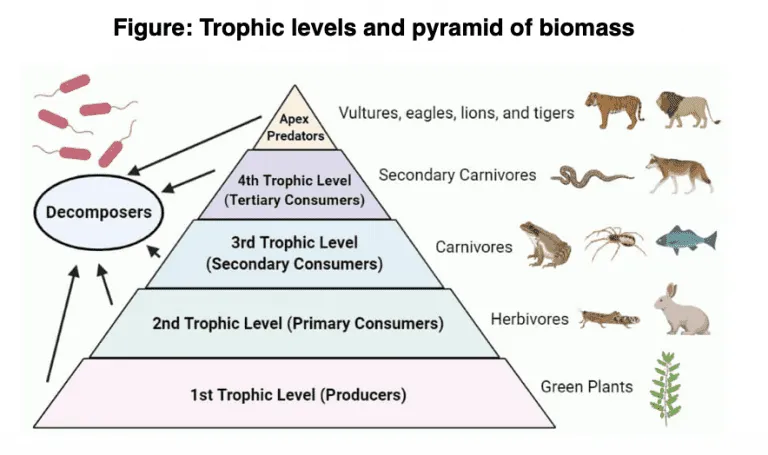
What is the definition of trophic levels?
An organism’s feeding relationships with other organisms (its position in a food chain)
What is the order of trophic levels?
Apex predator
Tertiary consumer
Secondary consumer
Primary consumer
Producer
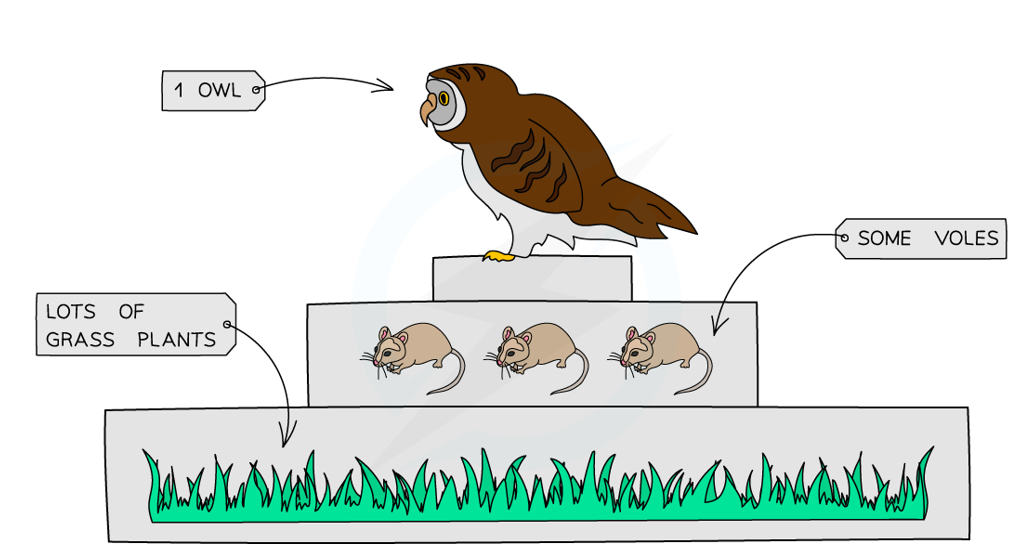
What are pyramids of number?
Show the numbers of organisms at each trophic level in a food chain:
generally, as you go up a food chain, the size of the individuals increases, whereas the number of individuals decreases
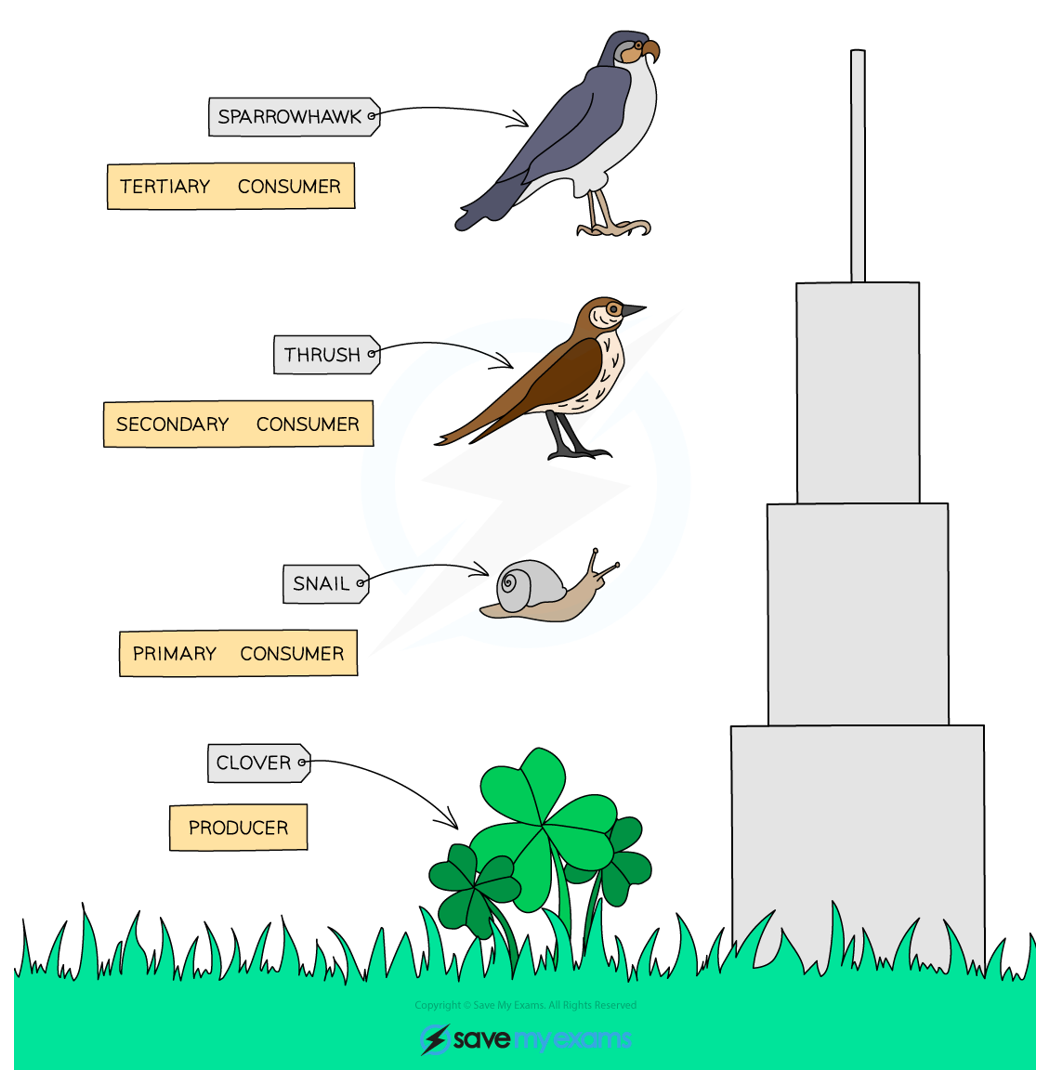
What are pyramids of biomass?
Considers the total mass of living organisms at each trophic level:
biomass should be dry mass, since water stores no energy
What percentage of biomass in each level is typically passed onto the next level?
10% - mass is lost at each trophic level of a food chain because:
some of the biomass absorbed by a consumer is used in respiration & converted to carbon dioxide & water (which are excreted)
some of the biomass is simply not eaten by the consumers in the next trophic level or is excreted without being absorbed
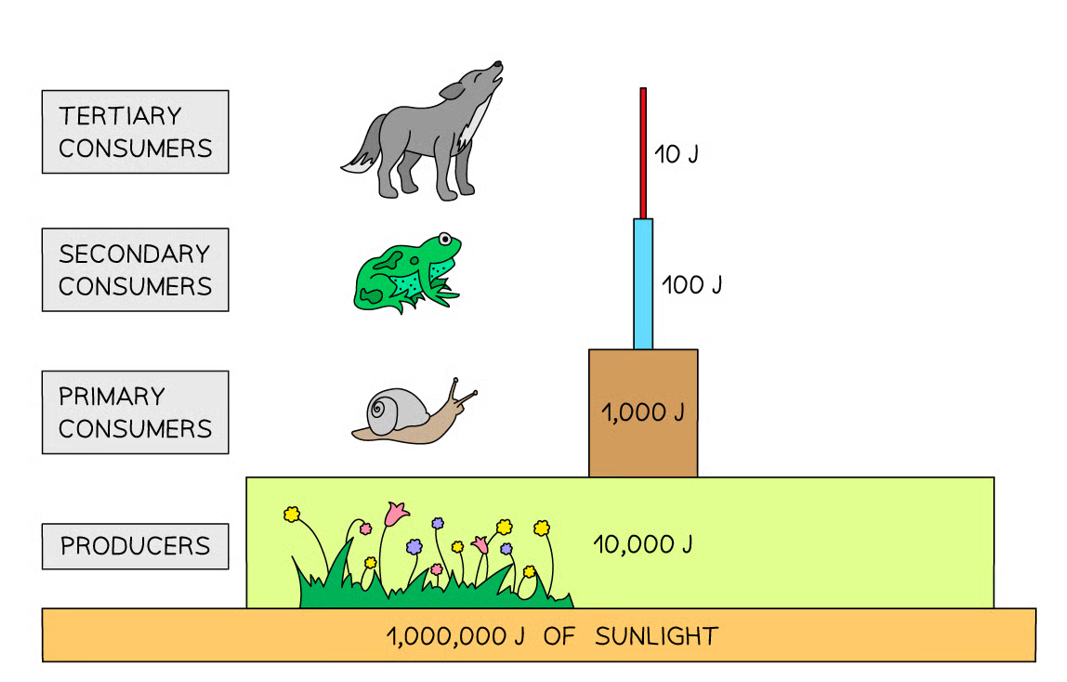
What are pyramids of energy?
Represent the flow of energy into each trophic level, so describe a period of time (usually a year):
always pyramidal & very shallow (transfer of energy from one trophic level to the next is very inefficient)
typically, less than 10% of the energy in each level is passed onto the next level
What is matter lost as in food chains?
Carbon dioxide (due to respiration)
Uneaten parts (e.g. skin, bones, teeth, shells, etc)
Waste (e.g. faeces, urine, etc)
What is energy lost as in food chains?
Chemical energy in the uneaten parts
Movement energy of consumers
Heat energy
What are the advantages & disadvantages of the 3 ecological pyramids?
Pyramids of number:
advantage = easiest to measure
disadvantage = can be distorted by large organisms
Pyramids of biomass:
advantage = more accurate than pyramids of number
disadvantage = dry mass has to be used
Pyramids of energy:
advantage = most accurate
disadvantage = hardest to measure
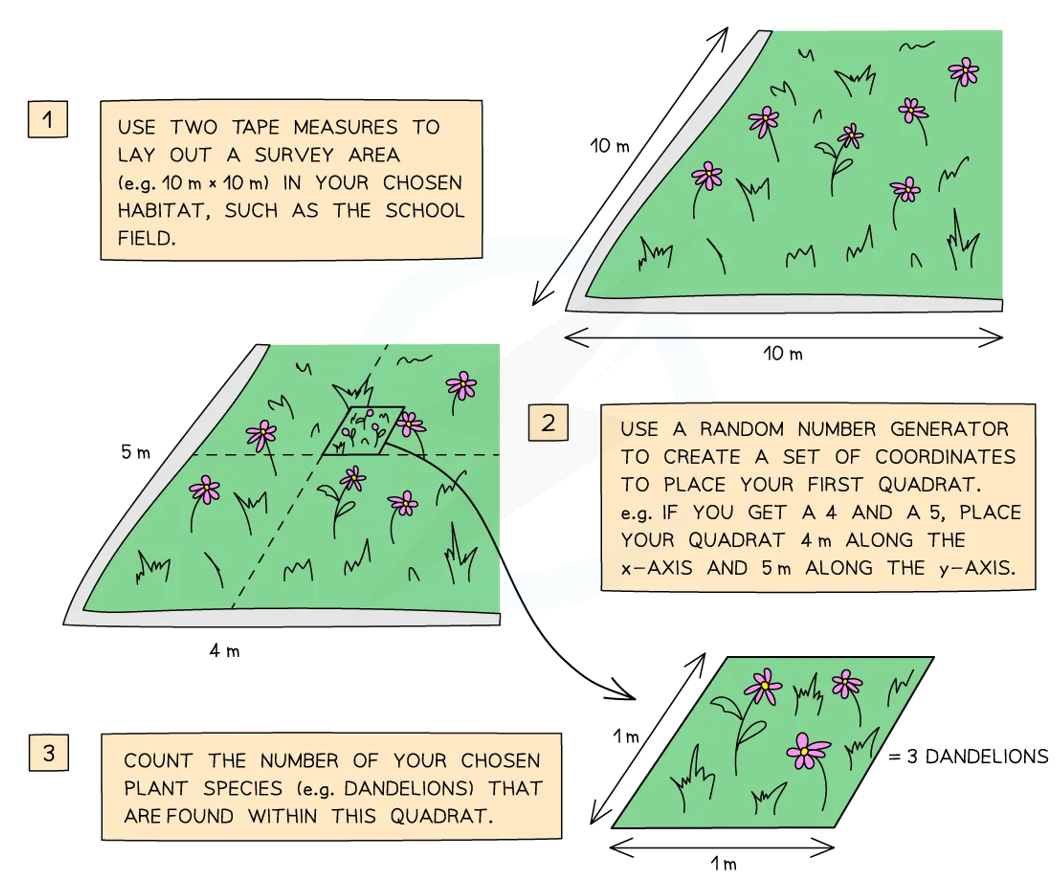
What is random sampling?
Every organism has an equal chance of being selected:
used to get a representative sample of the area
measuring tapes are placed along two sides of the area & random numbers are used as coordinates to choose sampling points
When is systematic sampling used?
When the location of samples is chosen, as a specific pattern in the ecosystem is being investigated:
most common is transect (samples are taken along a straight line to see what changes there are along the line)
What is a line transect?
A measuring tape is placed in a straight line & the organisms which touch the tape at regular intervals are recorded
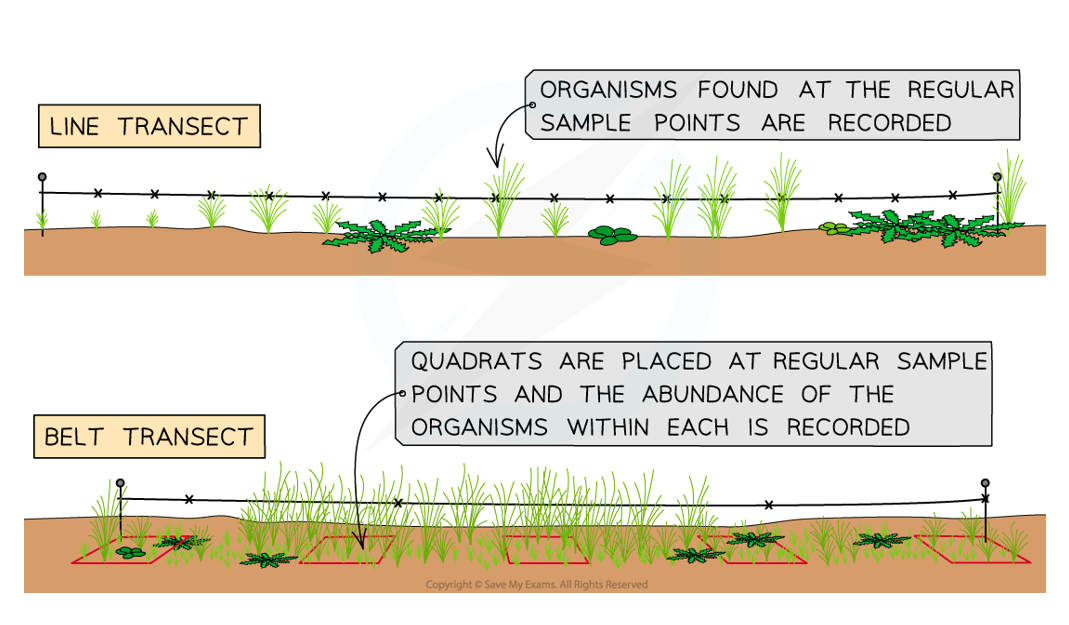
What is a belt transect?
Quadrats are placed at regular intervals along a transect & organisms in each quadrat are counted

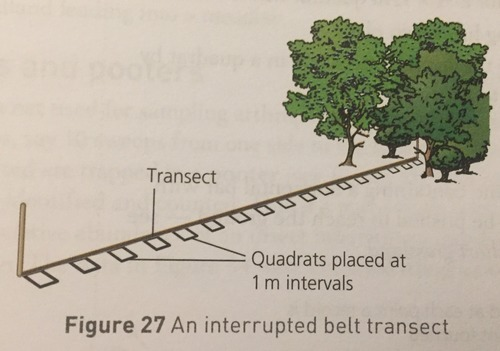
What is an interrupted transect?
The sampling is not continuous, but instead there are gaps in-between the samples
What are the advantages & disadvantages of line & belt transects?
Line transects:
advantage = quick
disadvantage = unrepresentative data
Belt transect:
advantage = generates more complete data
disadvantage = involves more work
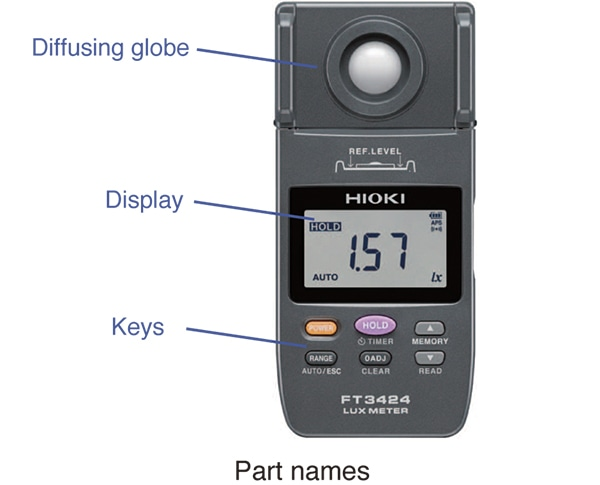
How are abiotic factors usually measured?
Using digital, electronic equipment (e.g. temperature & pH probe or lux/light metre):
measurements are quick, quantitative, accurate, calibrated, etc
What are the 5 quantitative measurements that can be made of living organisms?
Abundance
Distribution
Diversity
Growth
Biomass
What is meant by clumped distribution?
The organisms may be clumped:
as a defence against predators
in hunting packs/social groups
their resources may be localised (e.g. water hole)

What is meant by uniform distribution?
A population where organisms are evenly spaced out in an environment:
occurs when organisms defend a territory or there is competition for scarce, thinly-spread resources
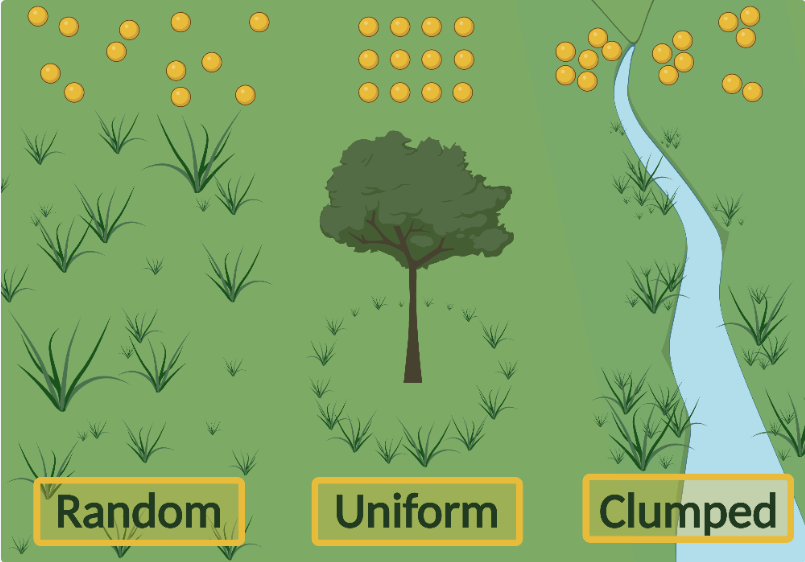
What is random distribution?
The dispersal of organisms is random & the location is independent of each other:
only occurs when resources are abundant & even, meaning there is little competition

How can density be measured using a quadrat?
Count the abundance, then divide by the area of the quadrat
How is species frequency measured using a quadrat?
Record the number of quadrats in which a species was found
How is percentage cover measured using a quadrat?
Estimate the percentage area of the quadrat covered by the particular species to the nearest 5%
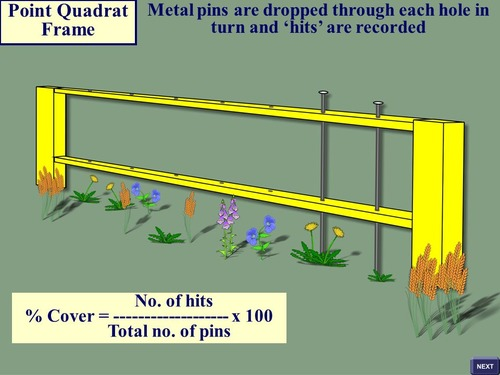
How are point quadrats used to measure percentage cover?
A needle is dropped through a hole in a frame until it touches the ground & whatever species the needle hits are recorded
Percentage cover = (number of hits / total number of needles) x 100
What is the meaning of the acronym ACFOR & why is it used?
To measure abundance:
A = abundant
C = common
F = frequency
O = occasional
R = rare
What are the steps to carry out statistical tests in biology?
State the null hypothesis
Decide which statistical test to use & why
Carry out the statistical test
Find the critical value at p = 0.05
Compare the calculated value with the critical value
Write a conclusion & reject/accept the null hypothesis
When should the t-test be used?
To determine if there is a statistically significant difference between the means of two sets of qualitative data
When should Spearman rank correlation coefficient used?
To determine if there is a statically significant correlation between two co-variables or whether the correlation is due to chance
What numbers will a Spearman’s rank value always be between & what do these numbers mean?
Always between -1 & 1:
1 = perfect positive correlation
0 = no correlation
-1 = perfect negative correlation
What is done after a Spearman’s rank value has been obtained?
Compare the SRCC to a critical value to see if there is a statistically significant correlation:
look at what value ‘n’ is & find it on table
look across to p = 0.05 & find the critical value
compare the SRCC (statistical value) & the critical value
When is the null hypothesis accepted or rejected in SRCC?
Same as the ‘rule of R’ in psychology:
accepted: SRCC (calculated value) is less than or equal to the critical value
rejected: SRCC (calculated value) is greater than or equal to the critical value
How is a conclusion written for a SRCC test?
My value of ___ is greater/less than the critical value of ___ at p=0.05 for ___ paired values
Therefore, we must reject/accept the null hypothesis
This means there is/isn’t a significant correlation between ___ & ___
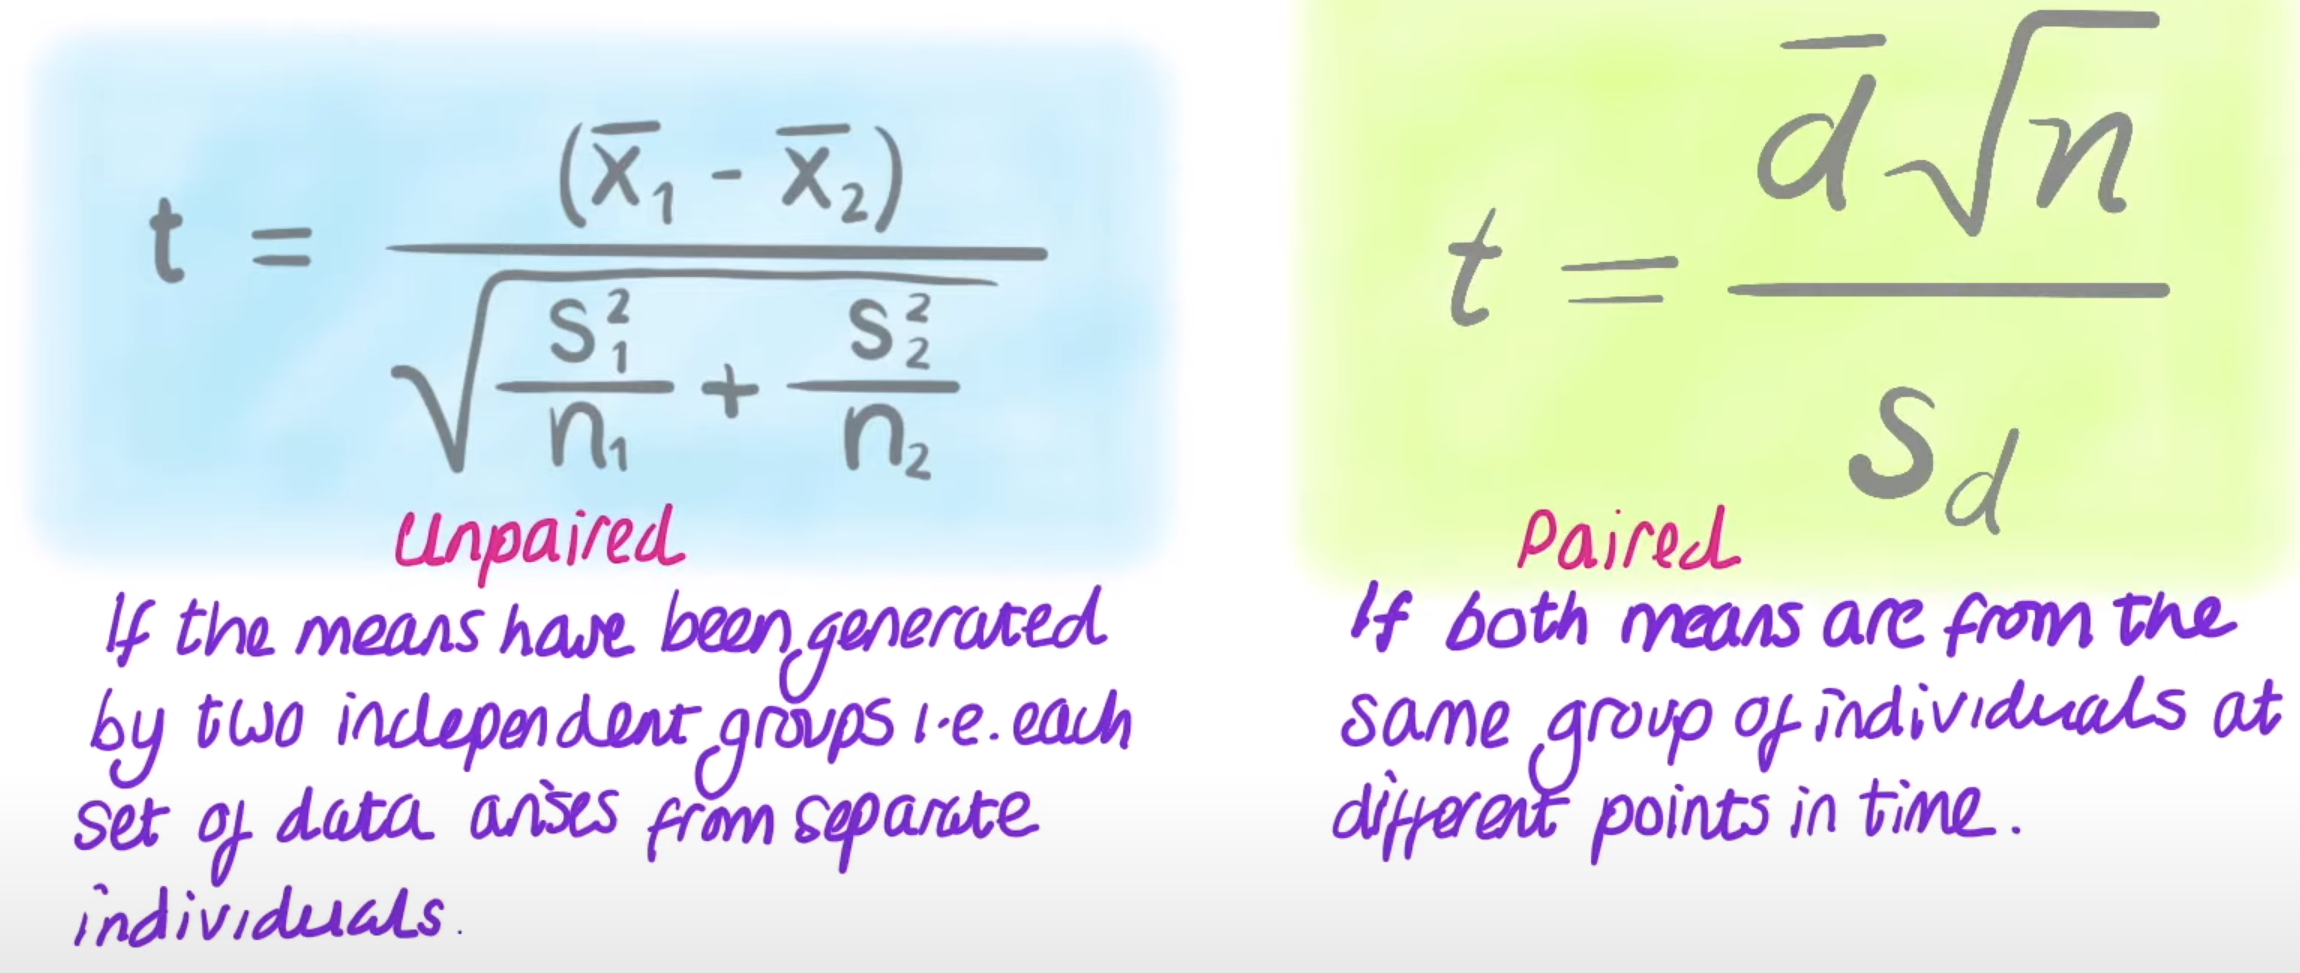
When should you use an unpaired t-test vs a paired t-test?
Unpaired t-test: if the two means have been generated by two independent groups
Paired t-test: if both means are from the same group of individuals at different points in time
How are unpaired/paired t-test results interpreted?
Compare the t value (calculated value) to a critical value by using degrees of freedom:
null hypothesis accepted = t value is less than or equal to the critical value
null hypothesis rejected = t value is greater than or equal to the critical value