Danny AP Statistics
 Call Kai
 Learn
Learn Practice Test
 Spaced Repetition
 Match
Match Flashcards
 Knowt Play
1/186

There's no tags or description
Looks like no tags are added yet.
Name | Mastery | Learn | Test | Matching | Spaced | Call with Kai | Chat |
|---|
No analytics yet
Send a link to your students to track their progress
187 Terms
All items or individuals of interest
Population
Number of items or individuals in the population:
Population size
Subset of population from which data are collected:
Sample
Number of items or individuals in the sample:
Sample size
Symbol for Population size:
N
Symbol for sample size:
n
A study in which data are collected from a sample to answer an investigative question about a larger population:
Statistical study
An item or individual from which data is collected:
Observational unit
A characteristic or attribute that varies between observational units:
Variable
What does a categorical variable take on?
Values that are category names or group labels
What are categorical variables also called?
Qualitative variables
Do categorical variables have an order?
No
Examples of categorical variables:
Left right hand
What does a quantitative variable take on?
Numerical value
Do quantitative variables have an order?
Yes
Types of quantitative variables:
Continuous and discrete
What can discrete variables take on?
Distinct set of values or some specific values
Example of discrete data:
Only whole numbers
What can continuous variables take on?
Any value within an interval
A numerical attribute among the whole population:
Parameter
A numerical attribute among the measured sample:
Statistic
What does a frequency table show?
The frequencies in each category of a categorical variable
What are frequencies also called?
Counts or number of repeatedness
What does a relative frequency table show?
Relative frequencies in each category of a categorical variable
What are frequencies also called?
Proportions or percentage
Are bars of bar charts separated?
Yes
What are bar charts used for?
Categorical variables or discrete quantitative variables
Advantages of dotplots:
Can see every data point on full scale
Disadvantages of dotplots:
Depending on scale, exact value will disappear
Only what of values is shown for dotplots?
Relative location
What does the accuracy of dotplots depend on?
Tools
Advantage of stem and leaf plot:
Can see values of every data point
Disadvantage of stem and leaf plots:
Overwhelming for large datasets
Do bars attach with each other for histograms?
Yes
What type of data are histograms used for?
Continuous quantitative
Advantage of using histogram:
Good for summarizing large datasets
Disadvantage of using histogram:
Can’t see individual data values
Acronym for describing a distribution:
CUSS with context
What does CUSS with context stand for?
Center, unusual features, shape, spread
What are unusual features of a distribution also called?
Outliers or extremes
What must exist for there to be unusual features in a distribution?
Gaps and outliers
Words to describe shape of distribution:
Uniform, unimodal, bimodal, left skew, symmetric, right skew
Where is the tail of a left skew?
Left
What is a symmetric distribution also called?
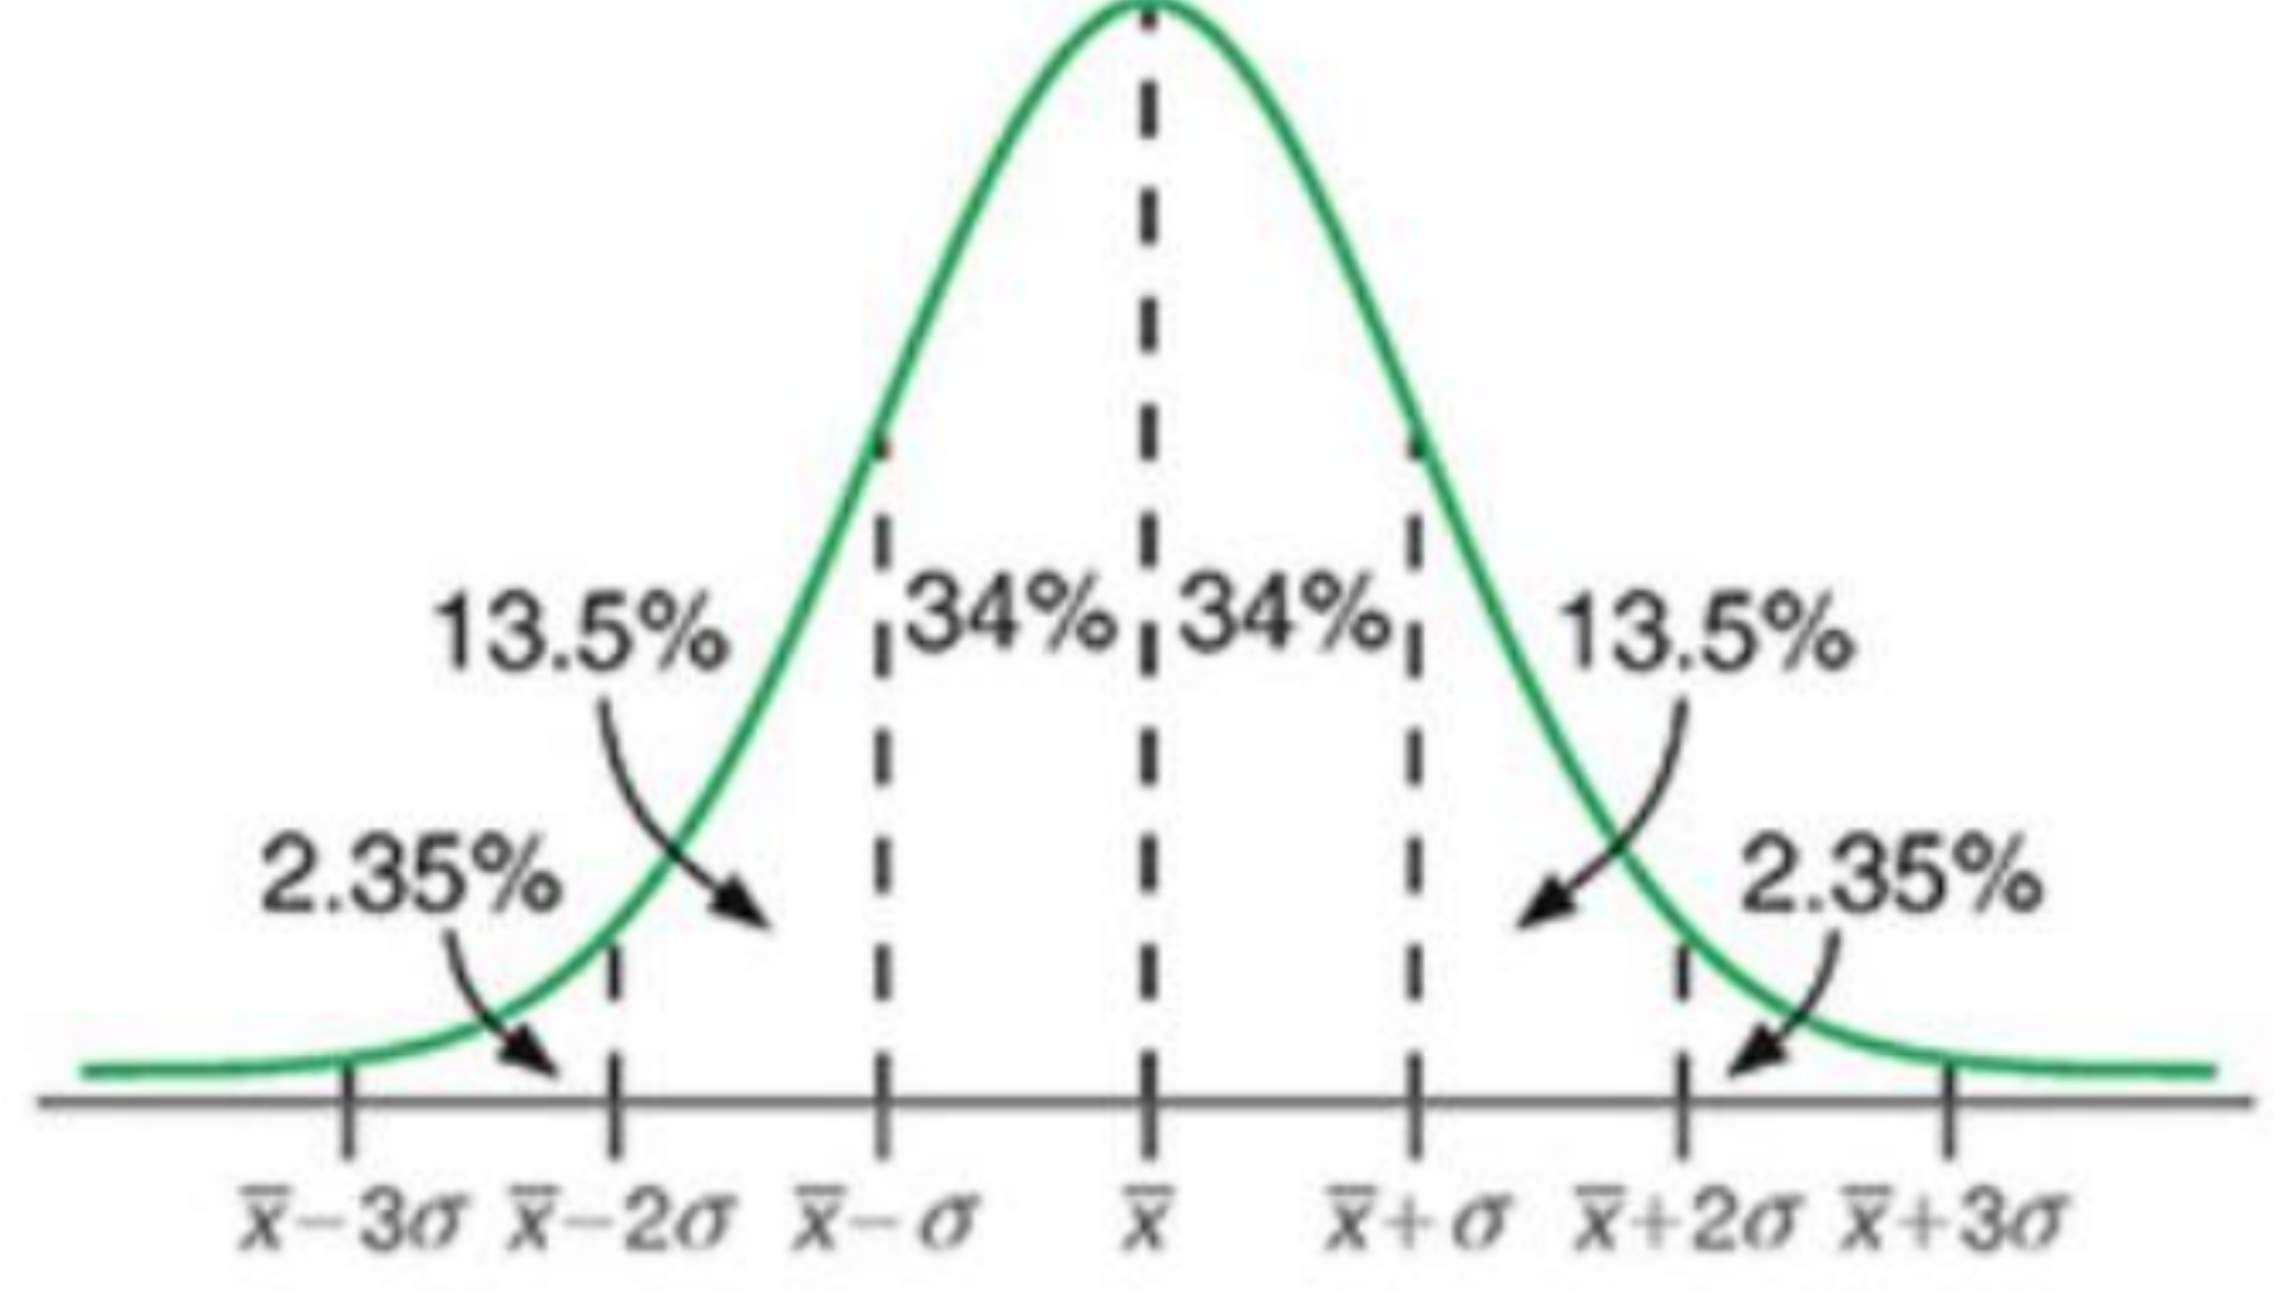
Bell shaped curve
Where is the tail of right skew?
Right
What are the four stages involved in statistics?
Collection of data, organization of data, presentation of data, analysis of data
Useful tools for analysis of data:
Measures of central tendency and measures of dispersion
Example of grouped data:
Ages 1-10, 11-20, 21-30
How to calculate arithmetic mean with ungrouped data?
Add up all values and divide by number of values
How to calculate arithmetic mean for grouped data?
(x1f1 + x2f2 + … + xnfn) / (f1 + f2 + … + fn) where x are class marks and f are the frequencies of class marks
How to calculate weighted mean for grouped data?
(x1w1 + x2w2 + … + xnwn) / (w1 + w2 + … + wn) where x are the data and w are the weights of the data
What does weighted mean of grouped data use as weight?
Frequency of each group
Datum with highest frequency:
Mode
Can there be no mode / modal class?
Yes
Can there be more than one mode / modal class in a data set?
Yes
Class interval with the highest frequency:
Modal class
How to find median?
Arrange data in ascending order of magnitude, if N is odd number, median is ((N+1)/2)th datum. If N is even number, median is 1/2((N/2)th datum + (N/2 + 1)th datum)
What can the median of a set of grouped data be found from?
50th percentile in cumulative frequency polygon or curve
What happens to mean, median, and mode when constant C is added to each value?
Increase by c
What happens to mean, median, and mode when each value is multiplied by constant c?
Multiplied by c
What happens to mean, median, and mode when value 0 is added to a set of positive values?
Mean decreases, median decreases/remains the same, mode unchanged
What happens to the mean, median, and mode if a value is removed?
Mean increases/decreases is value is smaller than / greater than arithmetic mean, Median will increases/decrease if value is smaller than / greater than median or remains unchanged, mode unchanged if value is not mode
If an item which is equal to the mean is added / removed, the mean:
Remains unchanged
How to calculate range for ungrouped data:
Largest datum - smallest datum
How to calculate range for grouped data:
Highest class boundary - lowest class boundary
How to calculate inter-quartile range
Upper quartile (Q3) - lower quartile (Q1)
How to calculate standard deviation of population:
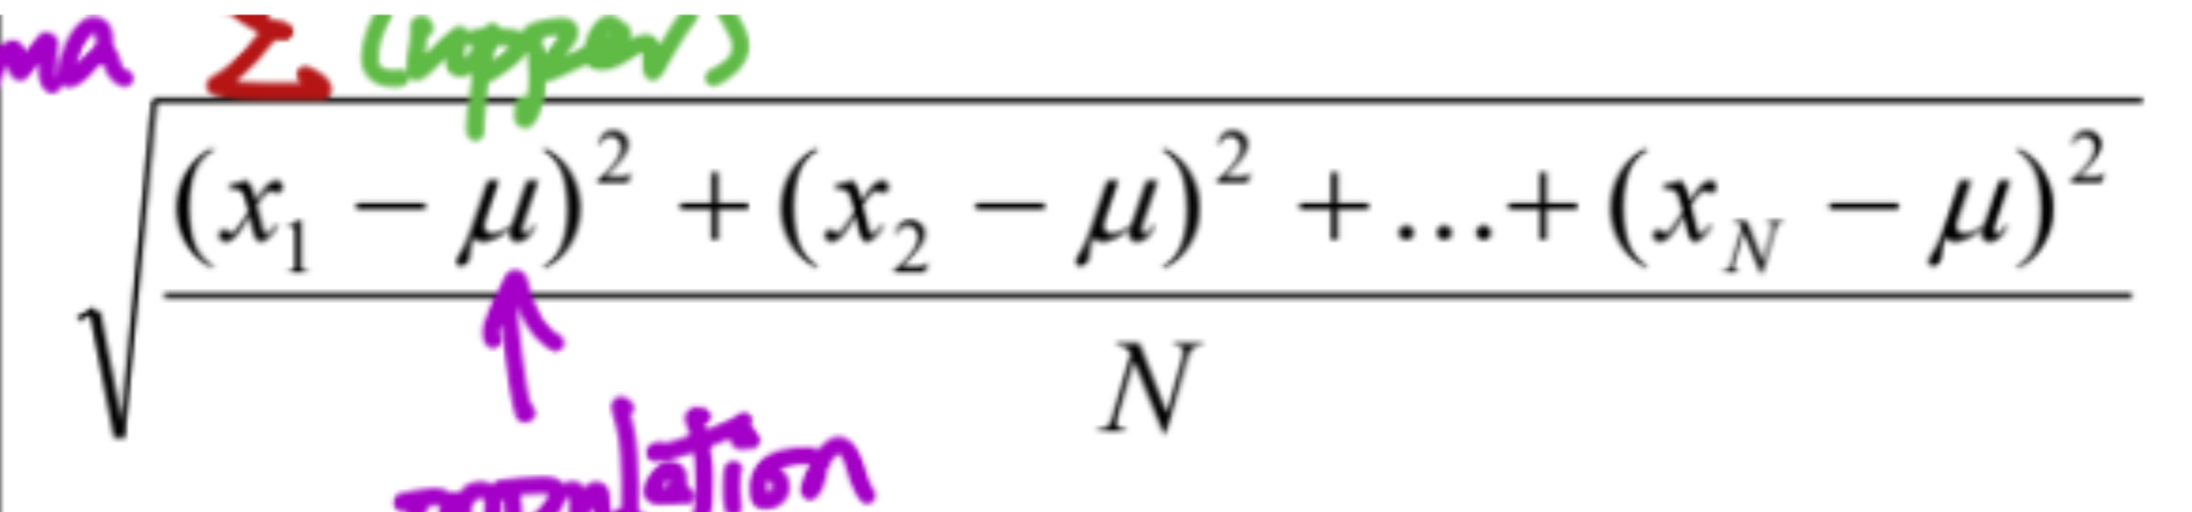
How far on average is each datum away from the mean
Standard deviation
How to calculate variance?
(standard deviation)^2
Advantages of range:
Simple, suitable if max and min data are most important
Disadvantages of range:
Only 2 data used, extreme values make range large
Advantages of interquartile range:
Not affected by extreme values
Disadvantages of interquartile range:
Data has to be sorted first, only part of data used
Advantages of standard deviation:
All data taken into account
Disadvantages of standard deviation:
Complicated calculation
Box and whisker diagram:
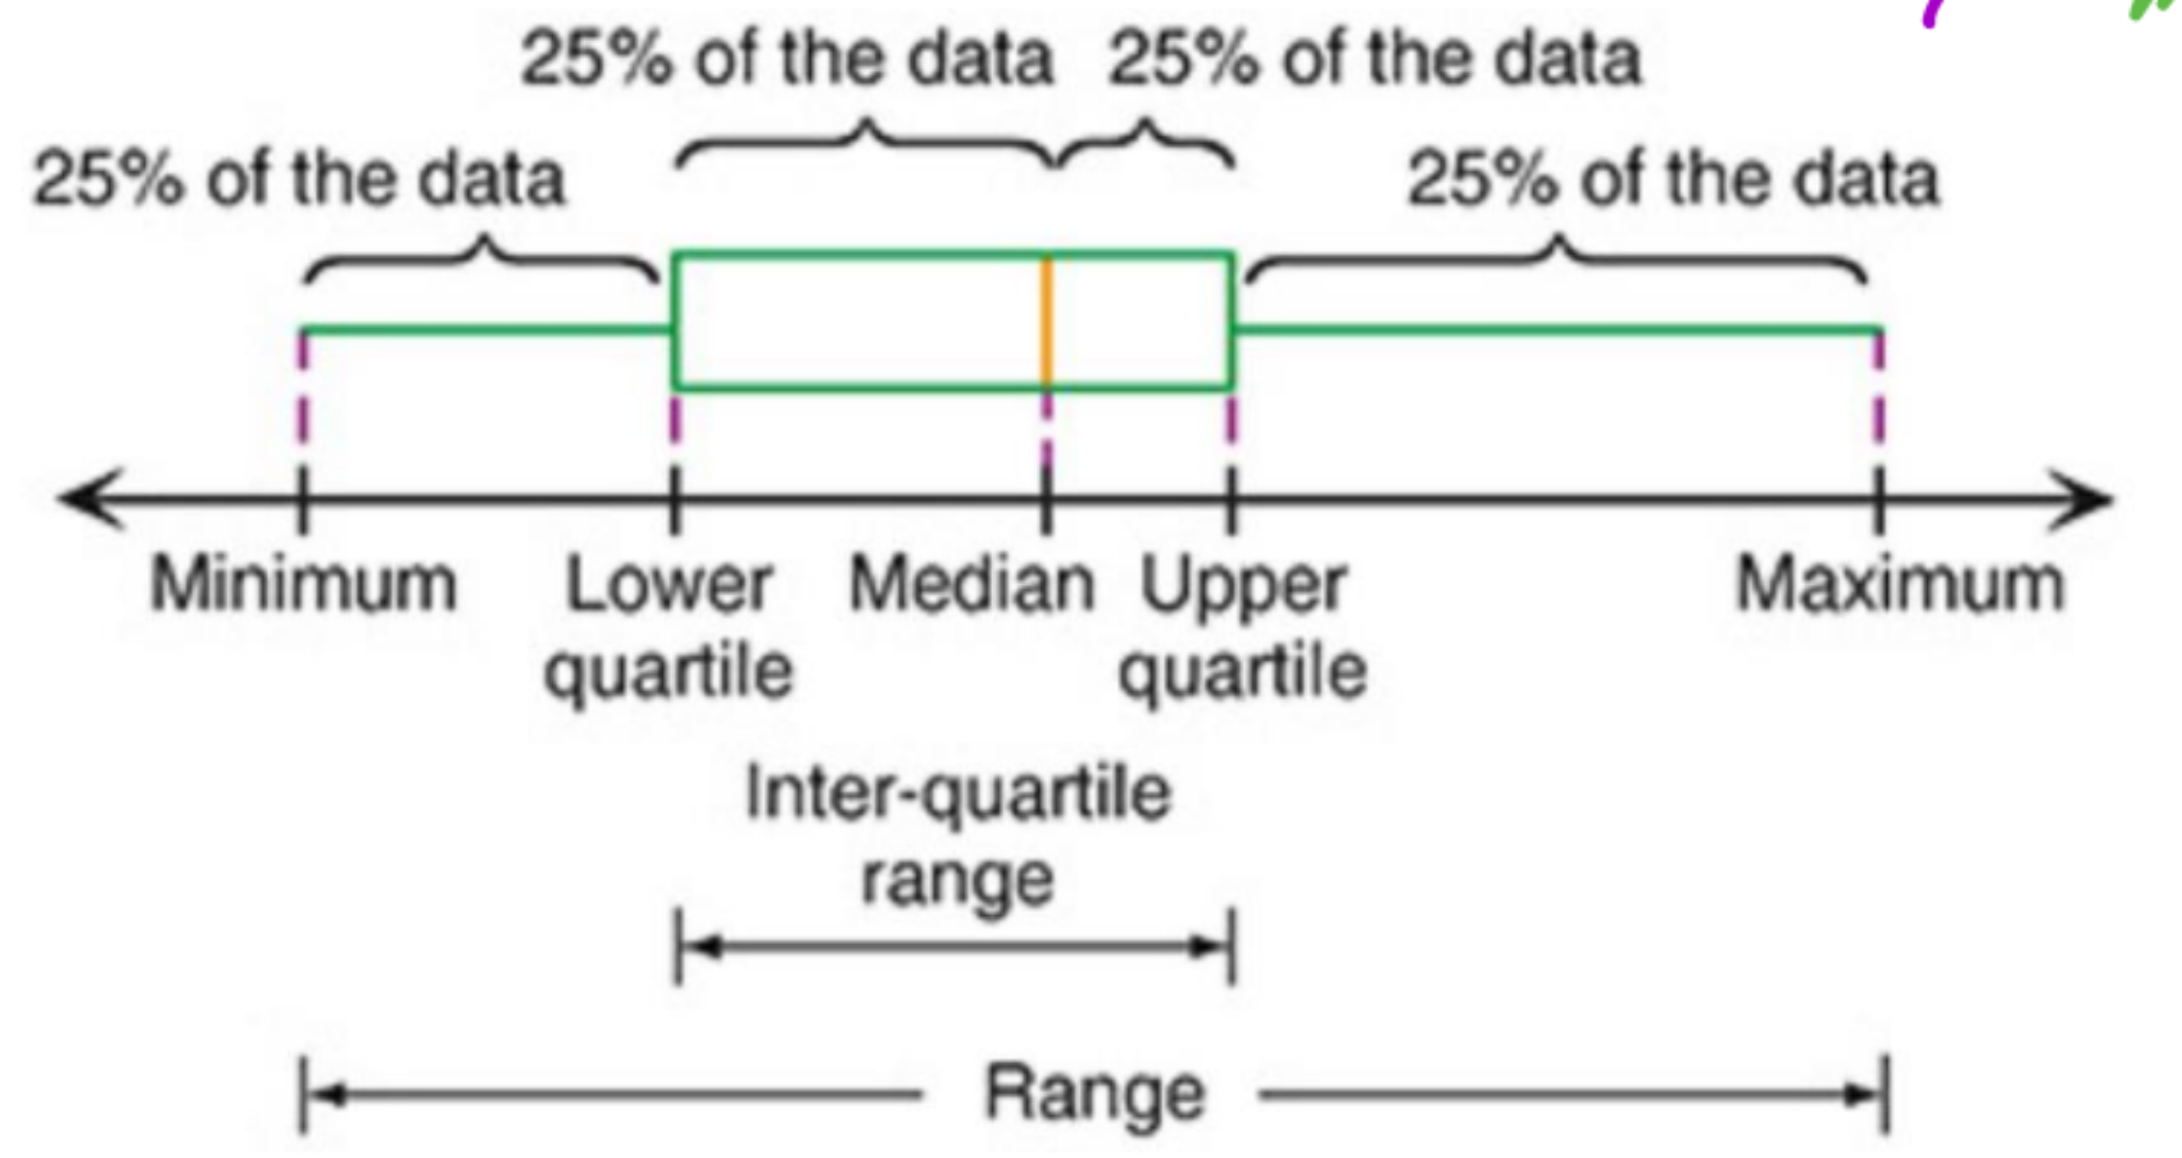
Normal distribution:
How does range, IQR, and standard deviation change if constant C is added to each datum?
No change
How does range, IQR, and standard deviation change if each datum is multiplied by constant k?
Multiplied by constant k
How does standard deviation change when deleting data far from mean?
Decrease
How does standard deviation change when deleting data close to mean?
Increases
How does standard deviation change when adding data far from mean?
Increase
How does standard deviation change when deleting data close to mean?
Decreases
How does range change when added/deleted datum affects max/min datum?
Increases/decreases
How does range change when added/deleted datum doesn’t affect max/min datum?
Unchanged
How does interquartile range change when added/deleted datum affects values of upper quartile and/or lower quartile?
Increases/decreases
How does interquartile range change when added/deleted datum doesn’t affect values of upper quartile and/or lower quartile?
No change
How does variance change if each datum is increased or decreased by constant?
No change
How does variance change if each datum is multiplied or divided by constant?
Multiplied or divided by constant squared
How does mean, mode, median change if each datum is multiplied by constant -k?
Multiplied by -k
How does range, interquartile range, and standard deviation change if each datum is multiplied by constant -k?
Multiplied by k
How does variance change if each datum is multiplied by constant -k?
Multiplied by k^2
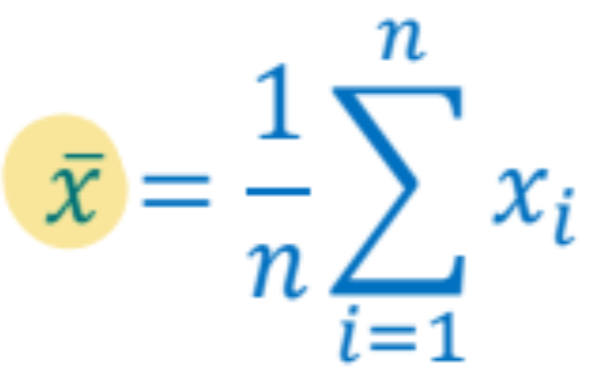
Formula for mean in words:
Sum of data values / n
Formula for sample mean in symbols:
Symbol for population variance
σ^2
Symbol for sample variance
s^2
IQR method to determine outliers:
Lower bound = Q1 - 1.5(IQR)
Upper bound = Q3 + 1.5(IQR)
Standard deviation method to determine outliers:
Lower bound = x bar - 2(standard deviation)
Upper bound = x bar + 2(standard deviation)
Measures that are not greatly affected by outliers
Resistant / robust measures
Resistant measures of center and spread:
Median, IQR, mode