Lecture 9: Factorial Design, Correlational Research
1/34
Earn XP
Description and Tags
CHAPTERS 11 AND 12
Name | Mastery | Learn | Test | Matching | Spaced |
|---|
No study sessions yet.
35 Terms
Factor
2 or more independent variables are combined in an experiment
each factor can have multiple levels each leading to multiple combinations
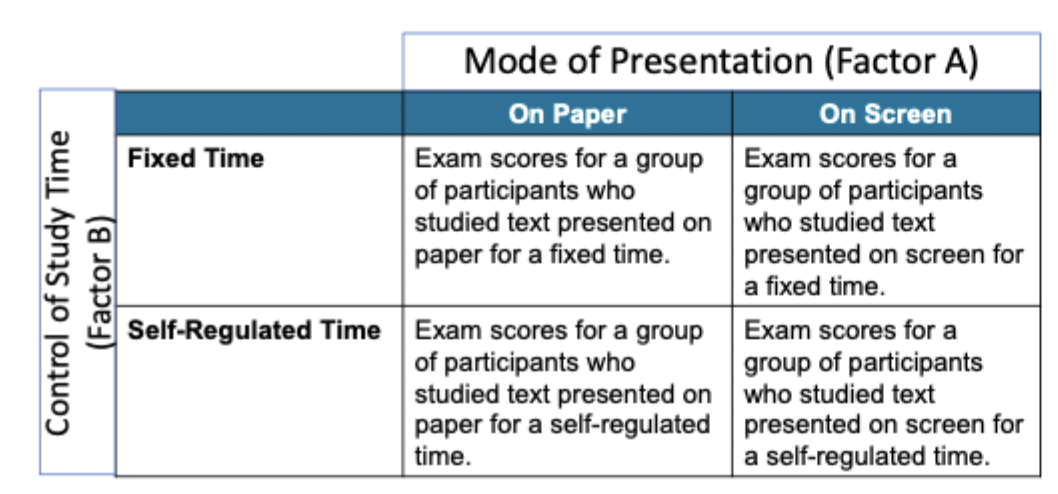
Factorial Design
a research design that includes 2 or more factors
described by how many factors it has, two-factor design, three-factor design etc
the levels of one factor determine the columns and the levels of the second factor determines the rows
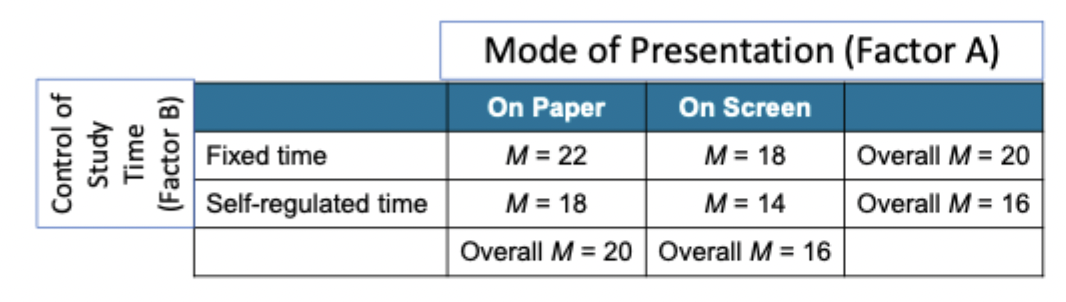
Main Effects
The individual impact of each factor on the dependent variable in a factorial design, without considering interactions between factors.
The mean differences among the columns or rows determine the main effect for one factor
2-factor study has 2 main effects; one for each factor
statistical test needed to see if differences are signicant
Interaction Between Factors
One factor has a direct influence on the effect of a second factor
e.g Drug interaction: one drug modifying the effect of another drug
One drug can exaggerate the effects of another
one drug may minimize or completely block the effects of another
When factors are independent, they have no interaction
presence of a second variable shows if something was done
Describing an interaction between factors
When the effects of one factor depend on the different levels of a second factor
or
When the results of a two-factor study are graphed
nonparallel lines = an interaction (when they meet something happens)
A statistical test is needed to determine if the interaction is significant
Identifying an interaction in a data matrix
compare the mean differences in any individual row with the mean differences in other rows (works with columns too)
The size and the direction of the differences in one row are the same as the corresponding differences in other rows in the matrix = no interaction
Differences change from one row to another in the matrix = evidence of an interaction
Interpreting Main Effects and Interactions
Significant effects indicated by a statistical analysis
have to be careful about interpreting the outcome
Main effects may present a distorted view of the actual outcome
Each main effect is an average
it may not accurately represent any of the individual effects that were used to compute the average
Interpreting Main Effects and Interactions (2)
The two-factor study allows researchers to evaluate three separate sets of mean differences
Main differences from the main effect of factor A
Main differences from the main effect of factor B
Main differences from the interaction between factors
Types of Factorial Designs
Between-Subjects
Within-Subjects
Mixed Design: Within and Between subjects
Experimental
Non-experimental or Quasi-experimental
Between-Subjects
Requires a large number of participants → Disadvantage
separate group of participants for each of the treatment conditions
Individual Differences can become confounding variables → disadvantage
Avoids order effects, each score is independent → Advantage
Within-Subjects
A single group of individuals participates in all of the separate treatment conditions
2 × 4 study = everyone does 8 treatment conditions
each participant must undergo a high number of treatments → Disadvantage
Time-consuming and contributed to participants dropping out of the study (attrition)
Testing effects - fatigue or practicing before the next treatment → disadvantage
Eliminates problems with individual differences
Mixed Design: Within and Between-Subjects
a factorial study that combines two different research designs
a factorial study with one between-subjects factor and one within-subjects factor
Experimental
a factorial study that is a purely experimental research design
Both factors are true independent variables that are manipulated by the researcher
Non Experimental or Quasi-Experimental
a factorial study for which all the factors are nonmanipulated, quasi-independent variables
The nonmanipulated variables are still called factors
Quasi-Independent Variable
the variable is used to differentiate the groups of participants or the groups of scores being compared
preexisting factors
Dependent Variable
The variable that is measured to obtain the scores within each group
Combined Strategies
Uses two different research strategies in the same factorial design
One factor is a true IV (experimental strategy where they manipulate)
the second factor is a quasi-independent variable (exists already/no manipulation)
Nonexperimental or quasi-experimental strategy
falls into one of the following categories: a preexisting participant characteristic or (gender/age or time (how long things persist)
Statistical Analysis of Factorial Design
Depends partly on whether the factors are between, within, some mixture of both
The standard practice includes
Computing the mean for each treatment condition (cell)
Using ANOVA to evaluate the statistical significance of the mean differences → Use three tests for all main differences
Goals of the Correlational Research Strategy
two or more variables are measured to obtain a set of scores (usually two scores) for each individual
to establish that a relationship exists between variables
to describe the nature of the relationship
the relationships can be described not explained
there is no attempt to manipulate, control or interfere with the variables
Comparing Correlational and Experimental
Correlational Research → intended to demonstrate the existence of a relationship between 2 variables
does not determine cause and effect relationship (no explanation)
looks for patterns within the scores of individuals
Experimental Research → demonstrates a cause-and-effect relationship between two variables
can manipulate one variable to create treatment conditions
measure the second variable to obtain a set of scores for each condition
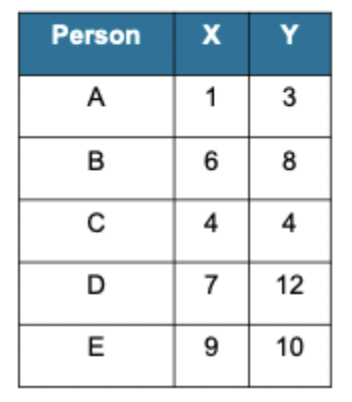
Data and Statistical Analysis: Chart
Scores in each pair are identified as X and Y
Data can be presented in a list showing the two scores for each individual
like a tally chart
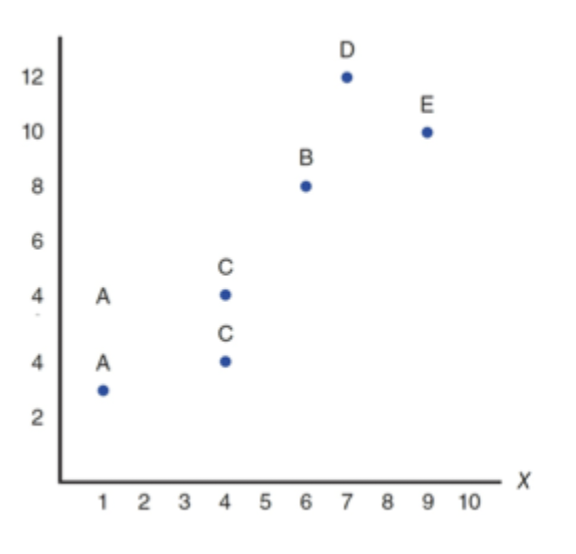
Data and Statistical Analysis: Scatter plot Graph
scored can be shown in a scatter plot graph
Each individual score is shown as a single dot w/ a horizontal coordinate x and a vertical coordinate y
benefits: allows you to see the characteristics of the relationship between the two variable
Three characteristics of a relationship when measuring are…
direction
form
consistency of strength
measures and describes the relationship between two variable
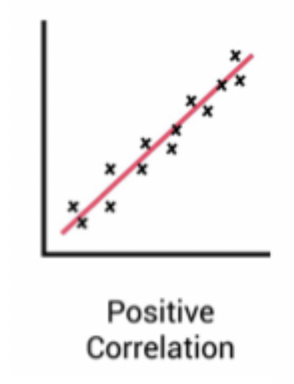
Direction of Relationship: Positive Relationship
Two variables change in the same direction
as one variable increases → the other variable increases
greater than 0
slope up the right
e.g height and weight - the taller students tend to weigh more
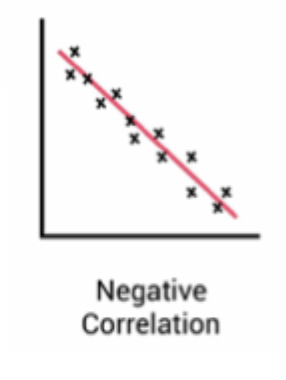
Direction of Relationship: Negative Relationship
Two variables change in opposite directions
Increases in one variable → matches with decreases in the other variable
e.g performance tasks - the faster you are, the lower the accuracy
less than zero
sloped down to the right
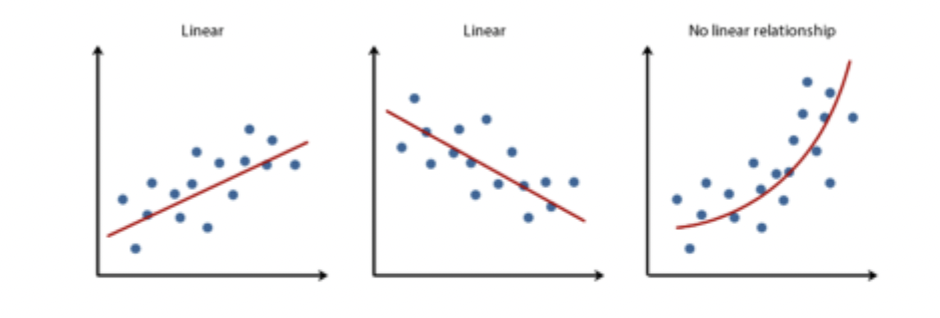
form of Relationship: Linear Relationship
The data points in the scatter plot tend to cluster in a straight line
Positive Linear Relationship
Each time the x variable increases, the Y variable increases/decreases in a consistently predictable amount
A Pearson correlation describes and measures linear relationships when both variables are numerical scores from interval or ratio scales
Consistency of strength of relationship
Correlation (correlation coefficient): measures and describes the relationship btwn 2 variables
The sign (+/-) indicates the direction of the relationship
The numerical value (0.0-1.0) indicates the strength or consistency of the relationship
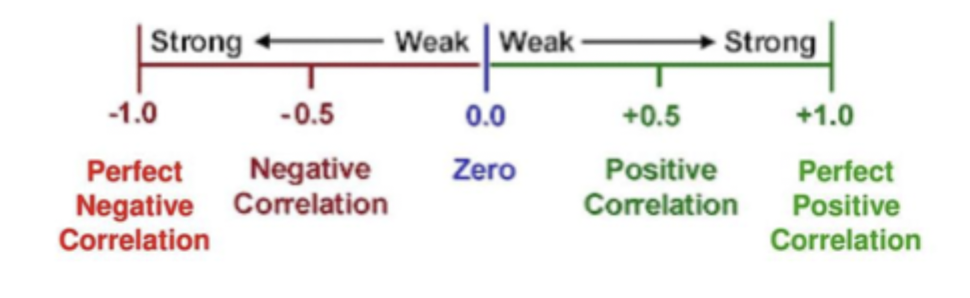
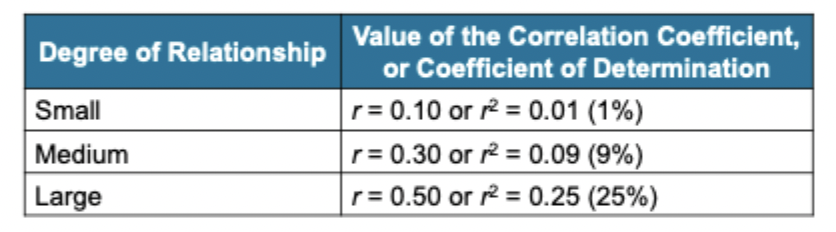
Interpreting the Strength of a Correlation
Coefficient of determination: The squared value of a correlation (r2)
measuring the strength
Measures the percentage of variability in one variable that is determined, or predicted, by its relationship with the other variable
the value of the correlation that goes from 0.00 (lack of consistency) to 1.00 (perfectly consistent relationship)
Statistical SIgnificance of a Correlation
The correlation is unlikely to have been produced by random variation
when the sample correlation is found to be significant, you can reasonably conclude that it represents a real relationship that exists in the population
With a small sample, it is possible to obtain what appears to be a very strong correlation when, in fact, there is no relationship between the two variables
Increasing the sample size makes it more likely that a correlation represents a real relationship
does not mean it is large or strong
Applications of the Correlational Strategy: Prediciton
a correlational study demonstrating a relationship between two variables
Allows researchers to use knowledge about one variable to help predict or explain the second variable
e.g relationship between good SAT scores and future grade point average in college, help college administrators to predict who is most likely to be successful
not just predictions of the future, one variable can predict the other
Reliability and Validity and Explaining theories
Both reliability (consistency and stability of measurements) and validity (extent to which procedures actually measure what it claims to)
commonly defined by relationships that are established using the correlational research design
e.g if the same individual is measured twice under the same conditions, there is a consistent relationship between the 2 measurements (reliability) and get the same results from previous tests (validity)
Correlational research can be used to address many theoretical questions
e.g Studies of IQs of identical twins
Strengths of Correlational Research
Describes the relationship between variables
Nonintrusive (natural behaviours)
High External Validity
Weaknesses of Correlational Research
Cannot assess causality
third-variable problem
Directionality problem
Low internal validity
Directionality Problem
Weakness
A correlational study does not establish a relationship of cause-and-effect
correlational cant determine which variable is the cause and which is the effect
The Third-Variable Problem
b/c two variables are related, does not mean that there must be a direct relationship between the two variables
A third (unidentified) variable may be responsible for producing the observed relation