elasticity of demand and supply
1/51
There's no tags or description
Looks like no tags are added yet.
Name | Mastery | Learn | Test | Matching | Spaced | Call with Kai | Chat |
|---|
No analytics yet
Send a link to your students to track their progress
52 Terms
price elasticity of demand
used to analyse the magnitude of the change in quantity demanded when price of the good changes
price elasticity of demand measures the degree of responsiveness of quantity demanded of a good to a change in its price, ceteris paribus
calculated by taking the proportion of the percentage change in the quantity demanded of the good to the percentage change in its price ⇒ percentage change of quantity demanded/percentage change in price
due to the law of demand, which states that the price and quantity demanded of a good are inversely related, the sign of price elasticity of demand is always negative ⇒ when stating price elasticity of demand, the negative sign is usually ignored and it is sufficient to state the absolute value
magnitude of price elasticity of demand
greater the absolute value, the greater the consumers’ responsiveness to a price change ⇒ more price elastic
demand is price elastic
if a given change in its price causes a more than proportionate change (response) in its quantity demanded, ceteris paribus
absolute value of the price elasticity of demand is greater than one
illustrated by a gentler demand curve ⇒ equal decrease in price from P to P1 causes a larger increase in the quantity demanded (Q to Q2)
demand is price inelastic
if a given change in its price results in a less than proportionate change (response) in its quantity demanded, ceteris paribus
absolute value of price elasticity of demand is less than one
illustrated by a steeper demand curve ⇒ equal decrease in price from P to P1 causes a larger increase in the quantity demanded (Q to Q1)
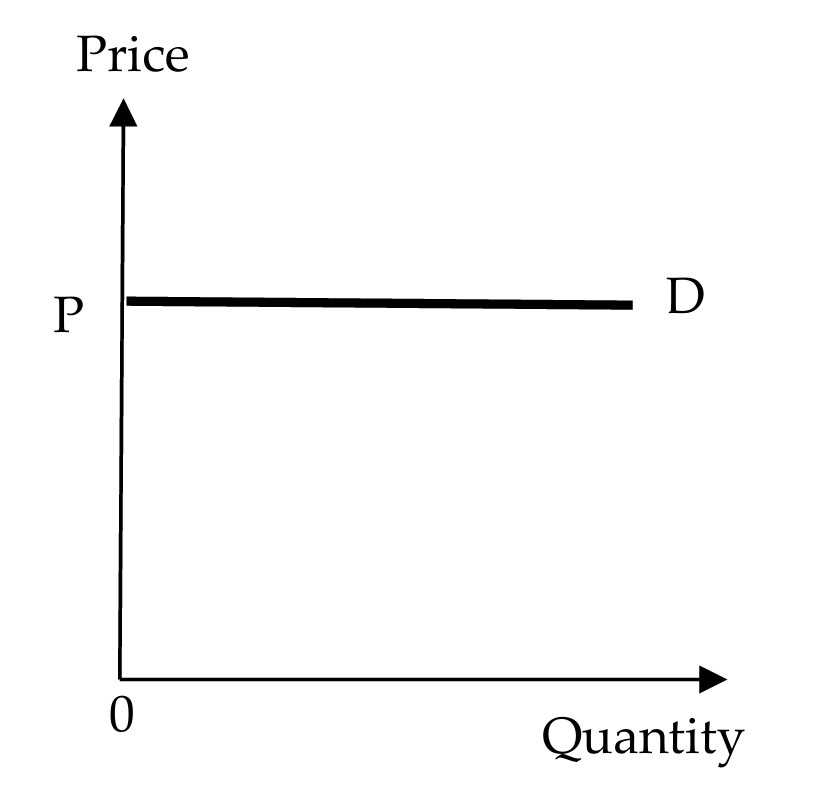
special demand curve → perfectly price elastic demand
given increase in the price of the good causes an infinite decrease in its quantity demanded, ceteris paribus
consumers are prepared to buy all they can at price P and none at all at an even slightly higher price ⇒ the price elasticity of demand of the good = ∞ (infinity)
e.g. demand for currencies sold by money changes (homogenous goods that many firms are selling)
illustrated by a horizontal demand curve
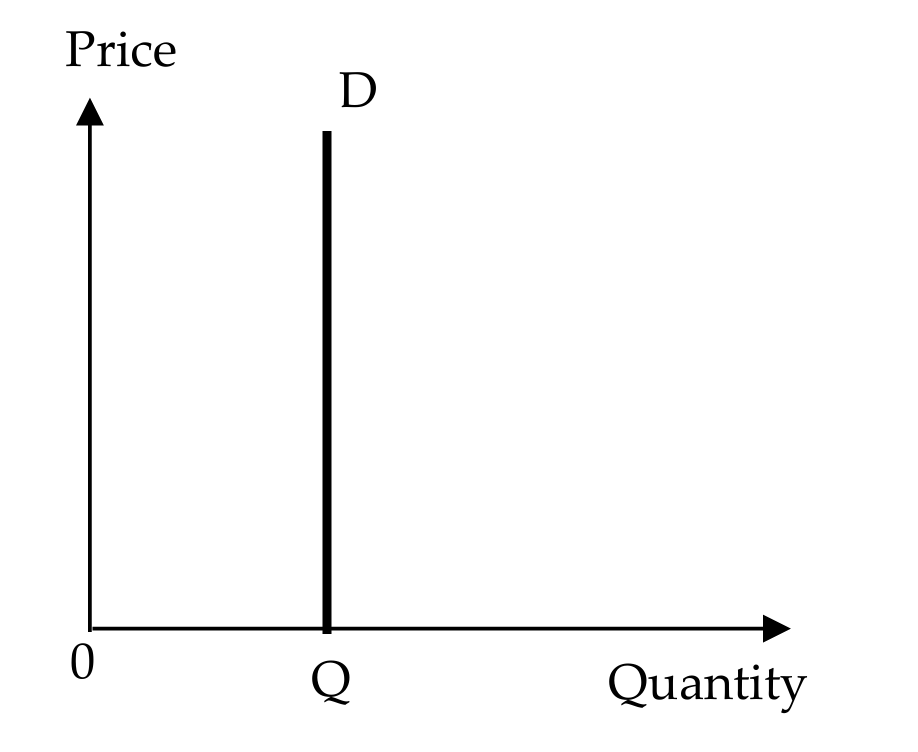
special demand curve → perfectly price inelastic demand
given change in the price of the good does not bring about any change in the quantity demanded ⇒ the price elasticity of demand for the good = 0
e.g. the demand for BTS concert tickets by hardcore fans of the K pop group
determinants of price elasticity of demand → availability and closeness of substitutes
the greater the availability of close substitutes, the more price elastic the demand for the good
the greater the closeness of substitutes, the more price elastic the demand for the good ⇒ a good which has closer substitutes is likely to have a higher price elasticity of demand than one that is more differentiated
the narrower the definition of the good, the greater the degree of substitutability and the more price elastic the demand for the good
determinants of price elasticity of demand → time to respond to changes
demand for a good generally becomes more price elastic with time
it takes time for consumers to recognise and to respond
fully to a change in the price of a good and to change their spending habitsconsumers need time to gather information, such as whether the price change is going to last or to discover alternatives before altering their consumption patterns
in response to the change in price
determinants of price elasticity of demand → degree of necessity
the greater the degree of necessity, more price inelastic the demand for the good
e.g.: demand for luxury goods is likely to be more price elastic than the demand for necessities ⇒ consumers are more likely to cut back on the consumption of goods that satisfy their wants rather than needs, and consumers will be more responsive in reducing quantity demanded for these goods when price increases
habit forming (addictive) goods like cigarettes and narcotic drugs are likely to be considered as necessities by those who are addicted to them, and therefore tend to face very price inelastic demand
determinants of price elasticity of demand → proportion of income
the larger the proportion of income spent on a good, the more price elastic the demand ⇒ consumers are more likely to shop around to find cheaper substitutes when the good is expensive and takes up a large proportion of their income than when the good is cheap and takes up a small proportion of their income
price elasticity of demand and total expenditure/revenue
magnitude of price elasticity of demand has implications on how price changes affect the total expenditure of consumers and total revenue of producers
in the absence of government subsidies and indirect
taxes, the total revenue of firms is equivalent to the total expenditure by consumerswhat is spent by buyers of a good is equivalent to what is earned by the sellers of that good
as there is an inverse relationship between price and quantity demanded ⇒ impact on total revenue given a change in price depends on the magnitude of the change in quantity demanded in response to the change in price
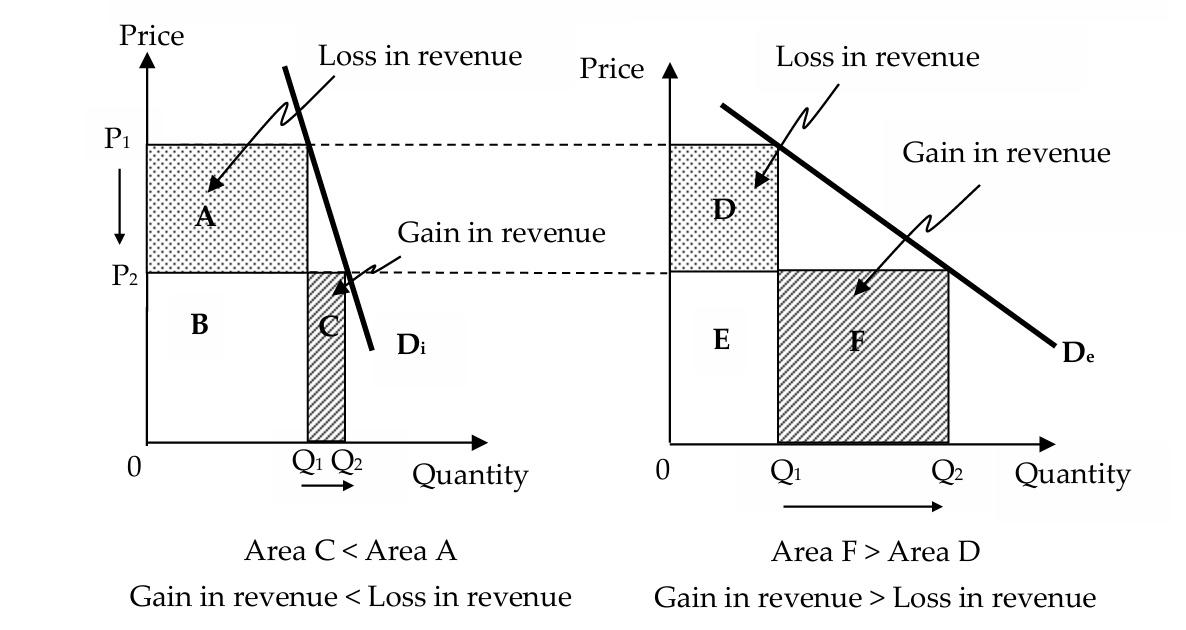
demand is relatively price inelastic → steeper demand curve
a decrease in price from P1 to P2 causes a less than proportionate
increase in quantity demanded from Q1 to Q2the gain in revenue from selling more of the good (area C) is less than the loss in revenue from having to sell all previous units at a lower price (area A) ⇒ total revenue decreases
demand is relatively price elastic → gentler demand curve
a decrease in price from P1 to P2 causes a more than proportionate increase in quantity demanded from Q1 to Q2
the gain in revenue from selling more of the good (area F) is more than the loss in revenue from having to sell all previous
units at a lower price (area D) ⇒ total revenue increases
consumer expenditure and producer revenue → definitions
consumers’ total expenditure is the total amount of money that consumers spend on a good or service
total expenditure (TE) = price per unit (P) x quantity bought (Q)
producers’ total revenue is the total amount of money that producers received from the sale of a good or service
total revenue (TR) = price per unit (P) x quantity sold (Q)
impact of price elasticity of demand on the market
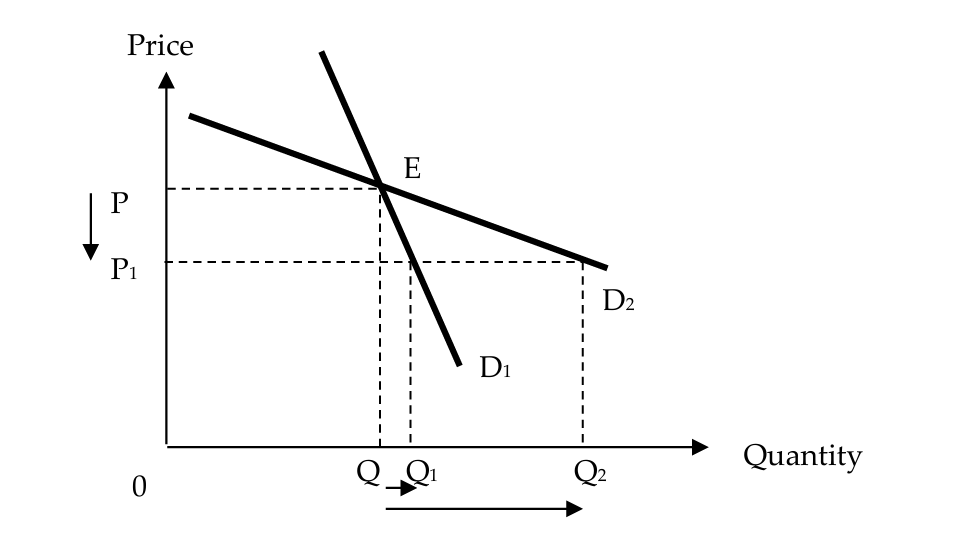
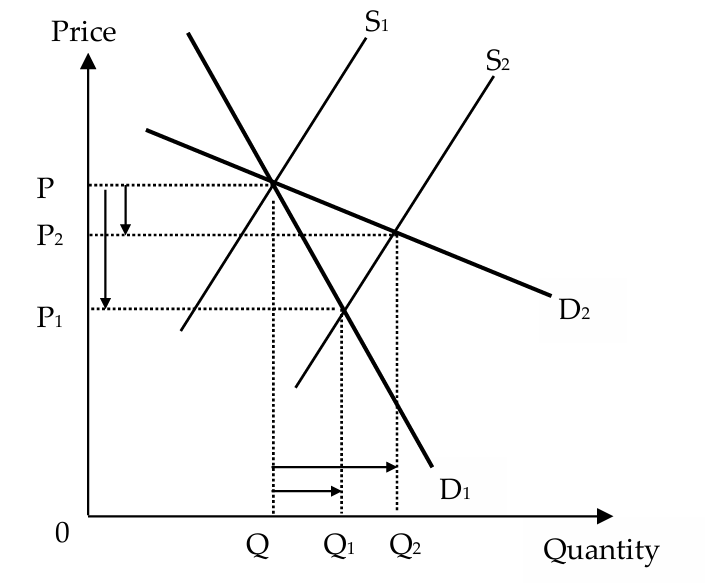
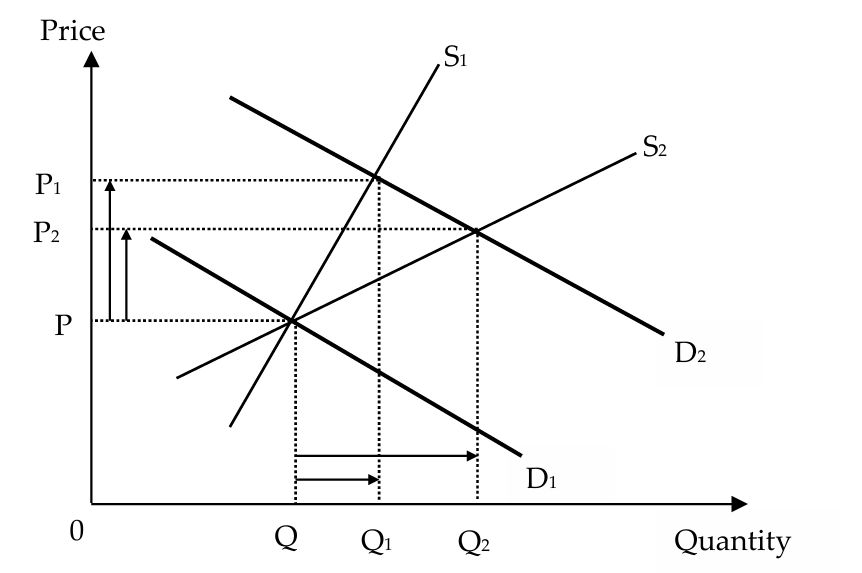
the more price inelastic the demand, the greater the change in equilibrium price and the smaller the change in equilibrium quantity for a given change in supply
this is because when demand is more price inelastic, during the price adjustment process, quantity demanded will be less responsive to the changes in price ⇒ prices will need to change by a larger extent for the surplus/shortage to be cleared
relatively price inelastic demand (D1): a sharp decrease in the equilibrium price to P1 and a relatively small increase in equilibrium quantity to Q1
relatively price elastic demand (D2): a relatively small decrease in the equilibrium price to P2, but a sharp increase in equilibrium quantity to Q2
impact of price elasticity on consumer expenditure/producer revenue
in the absence of taxes/subsidies, consumer expenditure equates to producer revenue ⇒ shown by ‘price x quantity’
depending on whether demand is price elastic or inelastic, an increase in supply can result in either an increase or decrease in consumer expenditure (producer revenue)
when there is a shift in the supply curve, PED will impact whether consumer expenditure (producer revenue) rises or falls
supply increases and demand is price elastic:
more than proportionate rise in quantity demanded in response to the fall in price
rise in consumer expenditure (producer revenue) from buying more units of the good outweighs the fall in consumer expenditure (producer revenue) from buying all previous units of the good at a lower price
consumer expenditure (producer revenue) rises
supply increases and demand is price inelastic:
less than proportionate rise in quantity demanded in response to the fall in price
the rise in consumer expenditure (producer revenue) from
buying more units of the good is lesser than the fall in consumer expenditure (producer revenue) from buying all previous units of the good at a lower priceconsumer expenditure (producer revenue) falls
price elasticity of supply
price elasticity of supply measures the degree of responsiveness of quantity supplied of a good to a change in its price, ceteris paribus
calculated by taking the proportion of the percentage change in the quantity supplied of the good to the percentage change in its price ⇒ percentage change in quantity supplied/percentage change in price
due to the law of supply, which states that the price and quantity supplied of a good are directly related, the sign of the price elasticity of supply is always positive ⇒ no need to indicate the positive sign when stating the value of price elasticity of supply
magnitude of price elasticity of supply
the greater the value of price elasticity of supply, the greater the producers’ responsiveness to a price change ⇒ more price elastic
supply is price elastic
if a given change in its price causes a more than proportionate change in its quantity supplied, ceteris paribus
the value of price elasticity of supply is greater than one
illustrated by a gentler supply curve ⇒ an equal increase in price from P to P1 causes a larger increase in the quantity supplied (Q to Q2)
supply is price inelastic
if a given change in its price results in a less than proportionate change in its quantity supplied, ceteris paribus
the value of price elasticity of supply is less than one
illustrated by a steeper supply curve ⇒ an equal increase in price from P to P1 causes a smaller increase in the quantity supplied (Q to Q1)
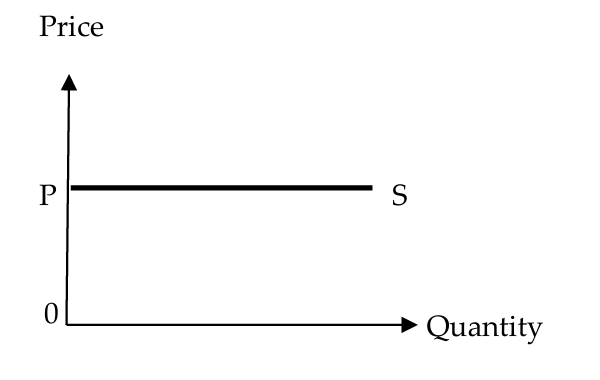
special supply curve → perfectly price elastic
the producer is willing to supply infinite amounts of the good at the existing price and none at all at a lower price
illustrated by a horizontal supply curve
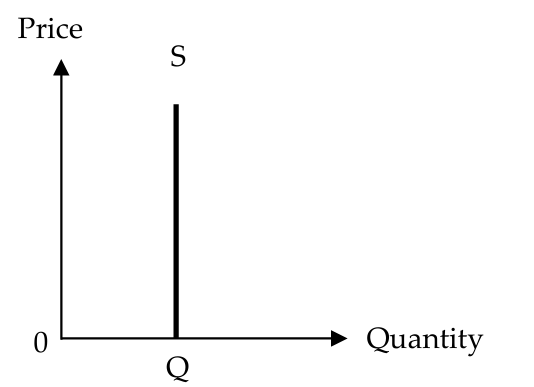
special supply curve → perfectly price inelastic
quantity supplied is completely unresponsive to price changes
illustrated by a vertical supply curve
determinants of price elasticity of supply → length and complexity of production process
a lengthy and complex production process will tend to result in a more price inelastic supply
determinants of price elasticity of supply → stock/inventory levels
when a good can be stored without loss of quality or undue expenses, the supply of the good tends to be price elastic, at least while stocks last
producers are more able to react to price increases by releasing more stocks (or inventory), or to price decreases by holding back stocks (or inventory) instead of putting them up for sale at a lower price → quantity supplied will change more than proportionately to a change in price, ceteris paribus
determinants of price elasticity of supply → availability and substitutability of inputs
if the factors of production are easily available or if a producer producing one good can easily switch resources and put it towards the creation of a product in demand, the supply of the good tends to be price elastic
limited availability of critical factor inputs may limit a producer’s ability to increase quantity supplied when price increases, leading to a more price inelastic supply
some firms have spare capacity (i.e. idle resources) in order to provide flexibility in reacting to market changes ⇒ supply would tend to be relatively price elastic
operating at full capacity prevents firms from making significant changes in output in the short run ⇒ supply tends to be more price inelastic
determinants of price elasticity of supply → time to respond to price changes
it takes time for firms to adjust their production in response to a change in the price of the good or service → in the very short run (momentary period), supply is fixed since it is limited to the existing stocks (or inventory) on hand ⇒ supply is perfectly price inelastic
in the short run, while at least one factor of production is fixed (e.g. capital), the firm is able to increase production by employing more variable factors (e.g. labour) ⇒ supply ceases to be perfectly inelastic although it may still be relatively price inelastic
in the long run, factors of production are all variable ⇒ supply becomes more price elastic as compared with the short run
impact of price elasticity of supply on the market
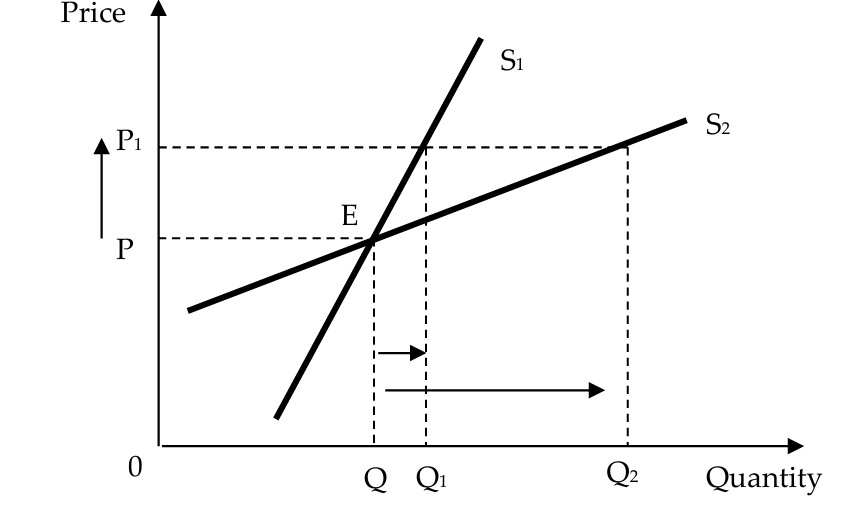
the more price inelastic the supply, the greater the change
in equilibrium price and the smaller the change in equilibrium quantity for a given change in demand.
this is because when supply is more price inelastic, during the price adjustment process, quantity supplied will be less responsive to the changes in price ⇒ prices will need to change by a larger extent for the surplus/shortage to be cleared
relatively price inelastic supply (S1)
when market demand increases, there is a sharp increase in the equilibrium price to P1 and a relatively small increase in equilibrium quantity to Q1
relatively price elastic supply (S2)
when market demand increases, there is a relatively small increase in the equilibrium price to P2 but a sharp increase in equilibrium quantity to Q2
impact of price elasticity on consumer expenditure/producer revenue → PES
when there is a shift in the demand curve, the rise or fall of consumer expenditure (producer revenue) is not dependent on the PES
demand rises and supply is price elastic, consumer expenditure (producer revenue) will rise
demand rises and supply is price inelastic, consumer expenditure
(producer revenue) will rise as well
regardless of whether supply is price elastic or inelastic, an increase in demand, ceteris paribus, would result in an increase in consumer expenditure (producer revenue)
income elasticity of demand
used to know how responsive changes in demand are to changes in income
income elasticity of demand measures the degree of responsiveness of the demand for a good to a change in the income of consumers, ceteris paribus
calculated by taking the proportion of the percentage change in the demand for a good to the percentage change in income ⇒ percentage change in demand/percentage change in income
important to indicate the sign when stating income elasticity of demand ⇒ distinguish between normal goods and inferior goods and hence determine the direction of change in demand when income changes
inferior goods → YED
as demand decreases as income rises ⇒ inverse relationship between demand for the good and the income level of consumers, the sign of income elasticity of demand is negative
an increase in income levels causes consumers to switch
away from the lower quality good to a higher quality one since they can afford better alternatives
normal goods → YED
as demand increases as income rises ⇒ there is a direct relationship between demand for the good and the income level of consumers, the sign of income elasticity of demand is positive
magnitude of YED
normal goods can be further classified into necessities and luxury goods
necessities
demand is income inelastic ⇒ an increase in income causes a less than proportionate increase in demand, ceteris paribus
value of income elasticity of demand for a necessity is positive and less than one
luxury goods
demand is income elastic ⇒ an increase in income causes a more than proportionate increase in demand
the value of income elasticity of demand for a luxury is positive and greater than one
income elasticity of demand and shifts of the demand curve
sign and magnitude of income elasticity of demand indicates the direction and extent of the shift of the demand curve following a change in income, ceteris paribus
the larger the magnitude of income elasticity of demand, the greater the magnitude of the shift of the demand curve when the income level of consumers change
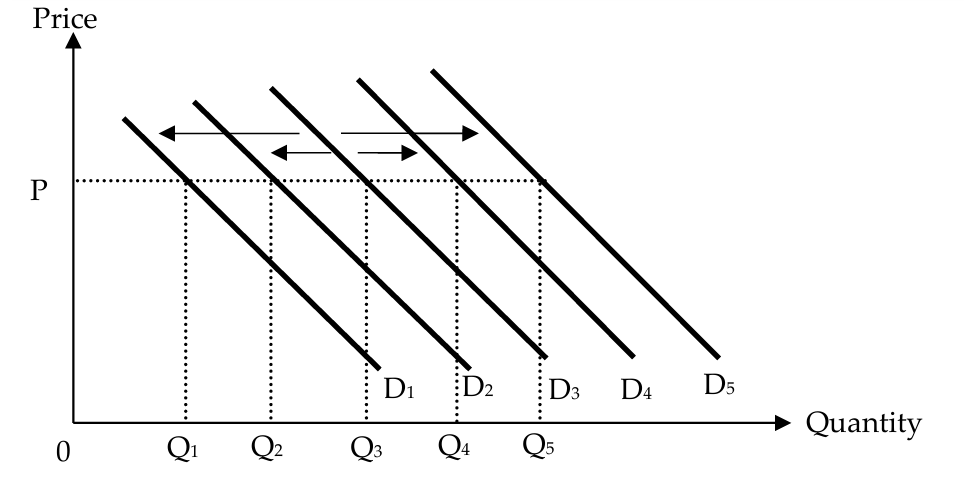
when the income level of consumers increases:
necessity (normal good): less than proportionate increase in demand is represented by a smaller rightward shift of the demand curve from D3 to D4
luxury (normal good): more than proportionate increase in demand is represented by a larger rightward shift of the
demand curve from D3 to D5inferior good: leftward shift of the demand curve to D2 or D1, depending on the magnitude of income elasticity of demand for the good
determinant of YED → degree of necessity
when incomes rises:
demand for necessities such as rice may increase less than
proportionately to the increase in income, as most households are already consuming necessities and are unlikely to buy significantly more ⇒ demand is income inelasticdemand for luxury goods such as taxi services may increase more than proportionately to the increase in income, as households are likely to upgrade once they can afford to do so ⇒ demand is income elastic
determinant of YED → income level of consumers
whether a good is perceived as an inferior good, a necessity or a luxury good ultimately depends on the country’s level of economic development and the income level of consumers
e.g. in a developed country with relatively high income levels, smartphones may be considered a necessity ⇒ when income levels rise in such a country, the demand for smartphones may increase less than proportionately
e.g. in a developing country with relatively lower income levels, smartphones may be considered a luxury good since most households may still find it too expensive despite an increase in income ⇒ when income levels increase in such a country, the demand for smartphones increases more than proportionately
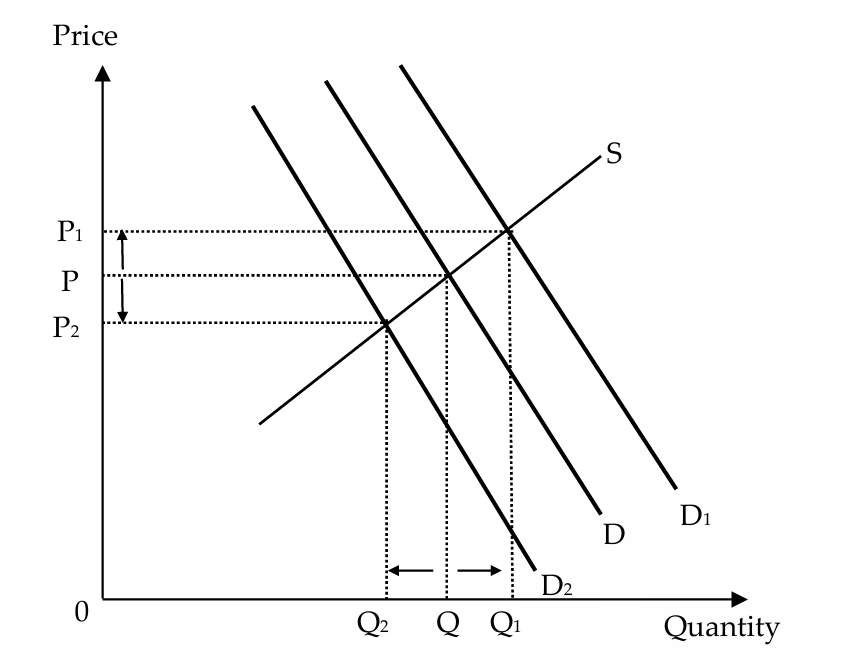
impact of income elasticity of demand on the market → normal good
when there is an increase in income levels, the demand increases (represented by a rightward shift of the demand curve from D to D1) ⇒ equilibrium price and quantity increase to P1 and Q1 respectively
the more income elastic the demand, the higher the magnitude of income elasticity of demand and the greater the extent of the increase in demand, resulting in a greater increase in equilibrium price and quantity
impact of income elasticity of demand on the market → inferior good
when there is an increase in income levels, the demand for an inferior good (represented by a leftward shift of the demand curve from D to D2) ⇒ equilibrium price and quantity decrease to P2 and Q2 respectively
the more income elastic the demand, the higher the magnitude of income elasticity of demand and the greater the extent of the decrease in demand, resulting in a greater decrease in equilibrium price and quantity
cross elasticity of demand
used to know the responsiveness of demand for a good with respect to a change in the prices of related goods
cross elasticity of demand measures the degree of responsiveness of the demand for a good to a change in the price of another good, ceteris paribus
calculated by taking the proportion of the percentage change in the demand for the good to the percentage change in the price of another good ⇒ percentage change in demand for good A/percentage change in price of good B
sign for cross elasticity of demand may be positive or negative, depending on the relationship between the two goods
substitutes → goods in competitive demand (XED)
cross elasticity of demand between the two goods is positive ⇒ change in the price of a substitute will cause the demand for the good to change in the same direction
complements → goods in joint demand (XED)
cross elasticity of demand between the two goods is negative ⇒ a change in the price of a complement will cause the demand for the good to change in the opposite direction
unrelated goods (XED)
cross elasticity of demand = 0 ⇒ a change in the price of one good does not have any impact on the demand for the other good
magnitude of XED
magnitude of cross elasticity of demand tells us how much demand will shift as a result of a change in the price of a related good
demand is cross-price elastic
good is a strong substitute or strong complement
magnitude is more than 1, and the demand curve will shift by a large extent
demand is cross-price inelastic
good is a weak substitute or weak complement
magnitude is between 0 and 1, and the demand curve will shift by a small extent
cross elasticity of demand and shifts of the demand curve
the closer the relationship between the two goods, the larger the magnitude of cross elasticity of demand and the larger the change in the demand for one good when the price of the other good changes
when the price of another good increases:
substitutes: increase in price of the substitute will lead to an increase in the demand for this good since consumers are likely to switch to the relatively cheaper good
represented by a rightward shift of the demand curve from D3 to D4 or D5, depending on the closeness of the two goods as substitutes
the stronger the substitutes, the greater the extent of
the rightward shift of the demand curve
complements: the increase in price of the complementary good will lead to a decrease in the demand for this good since consumers are likely to reduce the consumption of both goods
represented by a leftward shift of the demand curve from D3 to D1 or D2, depending on the closeness of the two goods as complements
the stronger the complements, the greater the extent of leftward shift of the demand curve
determinant of XED → closeness of relationship between two goods (main determinant)
strong substitutes/complements ⇒ large magnitude of cross elasticity of demand
e.g. of strong substitutes: pepsi and coke → taste similar
e.g. of strong complements: popcorn and coke → consumed together
weak substitutes/complements ⇒ small magnitude of cross elasticity of demand
e.g. of weak substitutes: orange juice and coke → taste different
e.g. of weak complements: breakfast cereals and coke → not typically consumed together in the same meal
impact of cross elasticity of demand on the market
a higher degree of substitutability/complementarity causes a greater change in the demand, and thus a larger change in the equilibrium price and quantity of the good when the price of its substitute/complement changes
substitute: when there is an increase in the price of a substitute, the demand for the good increases (represented by a rightward shift of the demand curve from D to D1) ⇒ equilibrium price and quantity increase to P1 and Q1 respectively
complement: when there is an increase in the price of a complement, the demand for the good decreases (represented by a leftward shift of the demand curve from D to D2) ⇒ equilibrium price and quantity decreases to P2 and Q2 respectively
the firm expects the demand for its goods or services to be price inelastic
firms may decide to increase the price of its products in order to increase total revenue (which is calculated by P X Q)
due to the price inelastic demand, an increase in the price from P1 to P2 causes a less than proportionate decrease in the quantity demanded from Q1 to Q2
as the rise in price is more than the fall in quantity demanded, total revenue (given by P x Q) will increase
the gain in revenue from increasing the price (area A) is more than the loss in revenue from selling less of the good (area C) ⇒ total revenue increases
the firm expects the demand for its goods or services to be price elastic
firms may decide to decrease price to increase total revenue
due to the price elastic demand, a decrease in the price from P1 to P2 causes a more than proportionate increase in the quantity demanded from Q1 to Q2
as the fall in price is less than the rise in quantity demanded, total revenue (given by P x Q) will increase
the gain in revenue from selling more of the good
(area F) is more than the loss in revenue from lowering the price (area D) ⇒ total revenue increases
methods for firms to make the demand for their products more price inelastic
firms may firms may decide to differentiate their products
if successful: can increase the price of their products, and the quantity demanded of their products would decrease less than proportionately, thus increasing the revenue and hence profitability of the firm
product differentiation can be real (where the tangible characteristics of the product is altered, often through extensive research and development) or perceived (where unique branding of the product is created through persuasive advertising and/or innovative packaging)
what firms do during increases in income levels
firms should sell more normal goods, especially luxury goods, where demand is expected to increase more than proportionately to the increase in income, ceteris paribus
what firms do during decreases in income levels
the demand for normal goods is expected to decrease
decrease in demand for necessities is expected to be less than proportionate to the decrease in income
decrease in demand for luxury goods is expected to be
more than proportionate to the decrease in income
leads to a more than proportionate fall in the demand for luxuries, reducing firms’ profits, firms may decide to produce more necessities or market its good as value-for-money instead of selling luxury goods during a recession
for firms selling a good with positive cross elasticity of demand with respect to another good → substitutes
the magnitude of cross elasticity of demand enables the firm to predict the extent of the fall in demand for its own products when a rival firm were to decrease price
magnitude of the positive cross elasticity of demand is small: the fall in demand for its own products is
expected to be minimal ⇒ firms may decide not to react and just accept the marginal loss in sales since the impact is negligiblemagnitude of the positive cross elasticity of demand is large: the fall in demand for its own products is expected to be significant ⇒ firms have to decide whether to correspondingly reduce the price of its own products which may potentially trigger a price war, or engage in other measures to boost its demand (such as advertising more aggressively) in order to
compete more effectively
most firms typically sell multiple products, which may be complements or substitutes to each other
having data on the cross elasticity of demand for different products enables a firm to price their products in the most optimal manner in order to jointly maximise total revenue and profits
limitations of applying demand elasticity concepts for firms → difficult to estimate the magnitude of elasticities
to estimate the various demand elasticities, firms need to spend significant resources to collect data on not only its own price and quantity sold, but also the income level of the country and the prices of its competitors and partners
smaller firms typically do not have the resources to engage in such data collection → they would only have personal observations to rely on to draw relevant insights to make more informed business decisions
the lack of information on all the magnitude of elasticity
concepts may prevent firms from adopting successful strategies that will maximise their revenue and hence profitshowever, in today's context, companies are increasingly leveraging technology to collect information about consumers making such data more and more accessible to firms
limitations of applying demand elasticity concepts for firms → estimates based on past data
even for large firms who might have the resources to collect data, the estimates derived are based on past data and past business conditions
may not be accurate as they may not apply to the prevailing business environment due to business conditions which could have changed significantly
may be argued that devoting significant resources to such data collection and interpretation could be an inefficient use of resources
however, having some estimates to serve as a guide for decision making could be better than having no information at all
limitations of applying demand elasticity concepts for firms → no information on cost changes
when applying demand elasticity concepts to decision-making of firms, the assumption that firms aim to maximise their total revenue is often made
however, in reality, a more common objective of firms is to
maximise profitsto determine the profit level of the producers, one has to consider the cost of production too, since profits are obtained from the difference between total revenue and total cost
in deciding whether to increase their production or to devote resources to non-price competition strategies, firms must also consider how much cost will increase as a result of each decision
some strategies may no longer be attractive once cost considerations are brought into the picture; the expected increase in revenue may be wiped out by an increase in cost, thus eliminating any potential increase in profits
the demand elasticity concepts tell us nothing about how cost changes when firms take on any strategy
limitations of applying demand elasticity concepts for firms → ceteris paribus assumption
the assumption of ceteris paribus (all other factors remaining constant) when studying two or more variables of interest, is a fundamental limitation in terms of the real-world application of elasticity concepts → meant to simplify economic analysis
while assuming that no other factors except its own
price, income and price of another good changes respectively, however, in reality, many different factors affecting the demand of a good may be changing simultaneouslythere may be other non-price factors involved in the demand for a good which would not have been taken into consideration when employing the ceteris paribus assumption
application of price elasticity of supply → firms
since firms control their own supply, they are likely to have the relevant information to determine their own price elasticity of supply
unlike demand elasticities (which are dependent on consumers’ behaviour), there is no need for firms to engage in extensive data collection in order to estimate their own price elasticity of supply
understanding of the factors affecting the price elasticity of supply is useful for a firm.
firm’s supply is more price elastic compared to its competitors: able to raise output more easily in response to an increase in price ⇒ raises its potential profitability and also allows it to capture a greater market share if the overall market demand increases
business strategies to raise the price elasticity of supply:
intentionally planning for excess inventories and excess capacity
embarking on greater automation → easier for machines than people to work overtime in order to produce more output
while there are advantages for a firm to increase its price elasticity of supply over time, such strategies however require higher current investments
firms will need to weigh the expected future benefits (in terms of higher revenue) against the expected current cost (in terms of cost of machines etc.) in order to determine if raising its price elasticity of supply will ultimately raise their profits
application of elasticity for a government
may consider price elasticity of demand to implement taxes and subsidies
use indirect taxes with the intended consequence of raising revenue or discouraging the production or consumption of certain goods and services
the more price inelastic the demand for a good, the higher the tax revenue raised from an indirect tax imposed on the good
if demand is price inelastic, the indirect tax would have a limited impact on discouraging its production or consumption, making it relatively less effective ⇒ quantity demanded is expected to respond less than proportionately to the increase in price from the indirect tax
implement indirect subsidies to encourage production or
consumption of certain goods and servicesif demand is price elastic, the indirect subsidy would be effective in encouraging its production or consumption ⇒ quantity demanded would increase more than proportionately due to the fall in price from the indirect subsidy
in the foreign exchange market and where international trade is concerned
the more price elastic the demand for a country’s exports, the more effective a devaluation of a country’s currency (which will reduce export prices) is in improving its overall export revenue