The 6th Jabra Jabra Math Reading
1/24
There's no tags or description
Looks like no tags are added yet.
Name | Mastery | Learn | Test | Matching | Spaced |
|---|
No study sessions yet.
25 Terms
💭 Flashcard 1: What’s a Hypothesis? 🤔
A hypothesis is a 🔍 testable idea that explains something!
You can accept ✅ or reject ❌ it using research!
It’s like saying, “I think this happens!” and then checking if you’re right! 🧪😎
💡 Flashcard 2: Fundamental Hypothesis 🧬
A fundamental hypothesis is someone’s belief 💭 about a relationship.
Example: “Smoking causes lung cancer.” 🚬➡😷
➡ But this is hard to test! 😬
🔬 Flashcard 3: Research Hypothesis 💪📊
A research hypothesis is a clear and testable statement 🎯
Example: “People who smoke regularly will have more lung cancer cases over 10 years than nonsmokers.”
✅ This one can be tested with actual data! 📈📉
⚖ Flashcard 4: Null Hypothesis (H₀) 😑
The null hypothesis says “There’s no difference!” or “Nothing’s going on!” 🙅♂
Example: “Smokers and nonsmokers get lung cancer at the same rate.”
If evidence says “nope! 🚫” — we reject this null idea! 🎉
🚀 Flashcard 5: Alternative Hypothesis (H₁) 🌟 or HA
The alternative hypothesis says “There is a difference!” 🎇
If we reject the null, we accept this one instead. 🎉
It’s basically saying, “Something’s going on here!” 🔥
🔢 Flashcard 6: The p-value 💧
The p-value tells us how likely it is that what we saw happened by chance! 🎲😵
👉 If the p-value is really small (usually < 0.05),
it means it’s super unlikely the result is random.
🚀 So we reject the null hypothesis!
🧮 Flashcard 7: Hypothesis Testing in a Nutshell 🍯
1⃣ Start with a null hypothesis (nothing’s different 😐)
2⃣ Have an alternative hypothesis (something’s different 😏)
3⃣ Do the math 🧮 and find a p-value!
4⃣ If p is small ➡ reject the null 🎉
5⃣ If p is big ➡ keep the null 😴
🎉 Flashcard 8: Remember! 🌈
Null = “No difference” 🚫
Alternative = “There is a difference!” 🥳
p-value = “How surprising is your result?” 😮
Small p = “Wow! Reject null!” 🚀
Big p = “Eh, probably chance.” 😴
📘 Flashcard 1: What’s a t-test? 💭📏
A t-test helps us see if two things are different 💡
Like comparing:
👩🎓 Group A vs 👨🎓 Group B
🍎 Before vs After 🍏
💪 One group vs a known number 🎯
It checks ⬇
✅ Are these averages (means) the same or not?
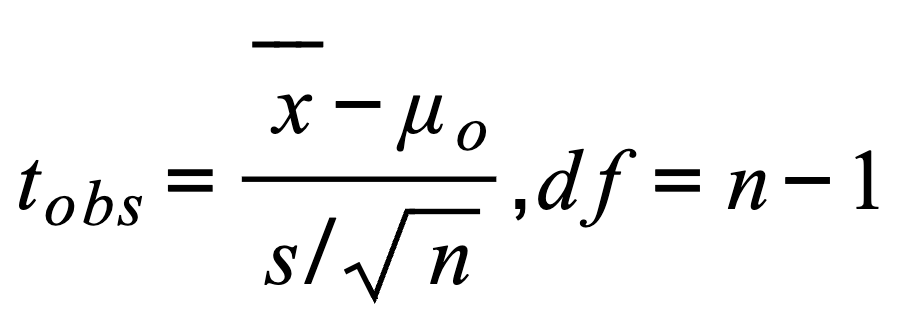
🧪 Flashcard 2: One-Sample t-test 🧍♀⚖
➡ Use this when you have one group 👩🔬
and you want to compare it to a known number 🔢 (like a standard or average)!
Example:
“Is the average height of this class 👩🏫📏 the same as the national average?” 🇺🇸
Formula (don’t panic 😅):
t = (sample mean − known mean) / (standard deviation ÷ √sample size)
💬 In simple words:
🤔 “How far off are we from a target number?” 🎯


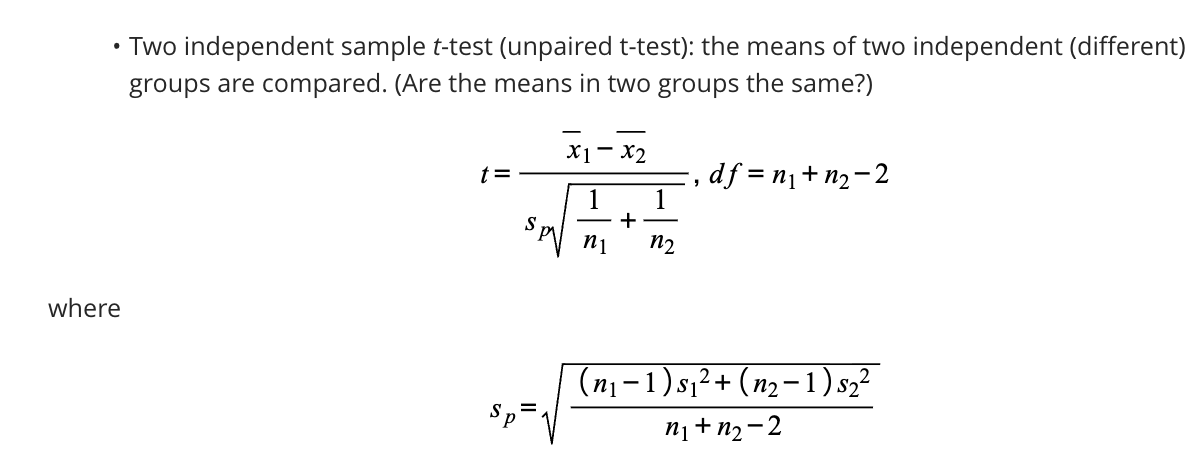
👯♂ Flashcard 3: Two-Independent Sample t-test 🌍✨
Used to compare two different groups!
Example:
👨⚕ Smokers 🚬 vs 🚭 Nonsmokers
🏫 Class A vs Class B
Question:
🤔 “Are the two group averages different?”
So basically:
t = (mean₁ − mean₂) / (spread of the data)
💬 In English:
“If these two groups were smoothies 🥤, do they taste different statistically?” 😂
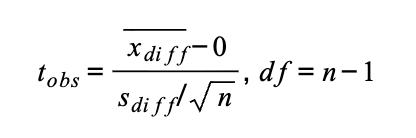
🔁 Flashcard 4: Two-Dependent Sample t-test (Paired t-test) 👫💓
Use this when data come in pairs!
Example:
🧍♀ Before diet 🍔 vs After diet 🥗
🏃♀ Before training 💤 vs After training 🏅
You’re checking:
“Did things CHANGE for the same group?” 🔄
Formula (in words):
t = (average difference) / (standard deviation of the differences ÷ √sample size)
💬 Easy version:
➡ Same people, two times ⏰ — did it make a difference? 💥

🎓 Flashcard 5: What’s “df”? 🤓📉
“df” = degrees of freedom
It’s just a fancy term for how many pieces of info can freely move 🕺💃
More samples → higher df → more power 💪
📈 Flashcard 6: ANOVA (Just a Tease 😉)
If you have 3 or more groups 🧑🎓🧑🏫🧑🔬,
use ANOVA (Analysis of Variance)! 🎉
It’s like a super t-test but for more than two groups! 🔥
💭 Flashcard 7: What All t-tests Care About 🧐
Every t-test checks these two things:
1⃣ How big is the difference between groups? 📏🥊
2⃣ How much variation is in the data? 🔀🎲
💬 So t-tests balance “difference” vs “randomness”! ⚖✨
🧠 Summary Flashcard: T-test = Detective 👩🕵♂️
👀 Looks at differences 🧬
🧮 Uses math to decide if they’re real or by chance 🎲
🎯 Helps you say if your groups really differ! 🎉
Tip with T testing stuff
💡 Tip: Remember — “one sample = one group,” “two independent = two groups,” “paired = same group twice!” 🎯
Flashcard 1: What is a P-Value? 🤔📊
The P-value measures how likely it is to see data like yours if the null hypothesis is true. ✅
Small P-value (e.g., < 0.05): Data doesn't match the null hypothesis. 🚨
Big P-value (e.g., > 0.05): Data fits the null hypothesis just fine. 😌
Think of it like this: 🎲
Small P-value: "Whoa! This result is unusual!" 🤯
Large P-value: "Nothing surprising here." 😴
Flashcard 2: What Does "Statistically Significant" Mean? 📈✨
If P < 0.05, we call it "statistically significant." 🥳
This doesn't mean the effect is important or huge — just that it's unlikely due to random chance. 🤷♀🎲
Remember: "Significant" ≠ "Big Deal." 🚫💥
Flashcard 3: What Happens If P > 0.05? 😯❓
P > 0.05 means there's not enough evidence to reject the null hypothesis. 🤔
It does NOT mean the null hypothesis is true. 🚩
Think of it as: "I need more proof!" 🕵♂️🔍
Flashcard 4: BEWARE! Misinterpreting P-Values 🚨⚠
Statistical significance ≠ Real-world importance. 🤔❌💡
P-values don't tell you the size of the effect or how meaningful it is. 📏⚖
A small P-value doesn't prove your hypothesis is correct. 🚫✅
A large P-value doesn't prove the null hypothesis is true. 🚫🛑
Flashcard 5: Why Use Confidence Intervals Instead? 🤔📏
Confidence intervals show a range of possible effects and their precision. 📊✨
They offer more insight than just "significant" or "not significant." 🕵♀️🔎
Example: "Is this enough evidence, or should I dig deeper?" 🔬🤓
Flashcard 6: Fun P-Value Reminders 🎉💡
P < 0.05: "Hmm, something's fishy here!" 🐟🔍
P > 0.05: "Not enough evidence to call this fishy." 🤷♀
P-value = Probability of seeing your data if the null hypothesis is true. 🎲
Emoji Takeaway 🌟🧠 P values
P-values are not magic. 🪄✨
Use them as a tool, not the whole story. 🛠📖
Always pair them with confidence intervals and real-world understanding. 🌍📏
What to Report
When communicating the result of health research, one should report:
Measure of effect: the magnitude of the difference between the groups, e.g., the difference in means, a risk ratio, a risk difference, an odds ratio, etc.
P-value: The probability of observing differences this great or greater if the null hypothesis were true.
Confidence interval: a measure of the precision of the measure of effect. The confidence interval estimates the range of values compatible with the evidence.
Many public health researchers and practitioners prefer confidence intervals since p-values give less information and are often interpreted inappropriately. When reporting results, one should provide all three of these.