Applied Statistics Exam 1 Review
 Call Kai
 Learn
Learn Practice Test
 Spaced Repetition
 Match
Match Flashcards
 Knowt Play
1/29

There's no tags or description
Looks like no tags are added yet.
Name | Mastery | Learn | Test | Matching | Spaced | Call with Kai | Chat |
|---|
No analytics yet
Send a link to your students to track their progress
30 Terms
Parameter
A numerical description of a population characteristic
Statistic
A numerical description of a sample characteristic
Qualitative Data
Consists of labels or descriptions of traits
Quantitative Data
Consists of counts or measurements
Continuous Data
Quantitative data that can take on any value in a given interval and are usually measurements. Data that can be represented with whole numbers and decimals
Discrete Data
Quantitative data that can take on only particular values and are usually costs. Data that can only be represented by whole numbers
Simple Random Sample
Selected in such a way that every possible sample of the same size has the same change of being chosen. Think of drawing names out of a hat
Systematic Sample
Selected at some starting point, then every nth element is chosen from the population
Convenience Sample
Selected in such a way that the results are easy to get
Stratified Sample
Selected in such a way that you divide the population into subgroups then draw a sample from each subgroup
Cluster Sample
Selected in such a way that you divide the population into groups, then randomly select some of those groups, and then choose all members from those selected groups
Normal Distribution

What type of distribution is this graph?
Uniform Distribution
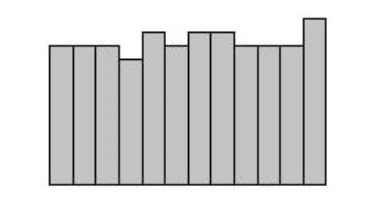
What type of distribution is this graph?
Skewed to the Right
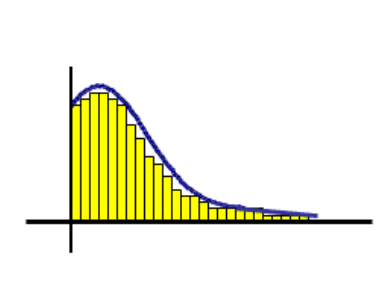
What type of distribution is this graph?
Skewed to the Left

What type of distribution is this graph?
Variation
A way to statistically describe how much spread is in the data
Standard Deviation
A measure of how much data values deviate away from the mean. Think of this as an estimated average distance that values in a set lie from the mean
Variance
A measure of variation equal to the square of the standard deviation
Range
A measure of dispersion that is the difference between the largest and smallest values in a data set
Mean
The average set of numbers. When you add the numbers together, then divide by how many numbers there are
Median
The middle number when the numbers are arranged from smallest to largest
Mode
The number that appears most often in a set of numbers
Z-Score
The number of standard deviations that a data value is away from the mean
X with a bar over it
The statistical symbol for a sample mean is what?
M shape or Mu
The statistical symbol for a population mean is what?
S
The statistical symbol for a sample standard deviation is what?
O shape or Sigma
The statistical symbol for a population standard deviation is what?