ECO12 Poverty
1/25
There's no tags or description
Looks like no tags are added yet.
Name | Mastery | Learn | Test | Matching | Spaced |
|---|
No study sessions yet.
26 Terms
Explain diffference betweene equality and equity.
Equity: Normative concept, subjective as to what being fair is defined as. The result of being equal due to VARYING degrees of treatment.
Equality: Positive concept, everyone receives equally regardless of their needs/circumstances. Receiving equal treatment regardless of circumstancs.
Define Economic inequality.
Defined as the degree to which people in a population differ in their ability to satisfy their economic needs; it refers to the inequality in living conditions that arise due to monetary factors (We study two types of economic inequality, Income Inequality and Wealth Inequality, it is an umbrella term for these two types.)
State how income inequality is measured
1) Lorenz Curve
2) Gini Coefficient
3) Quintiles
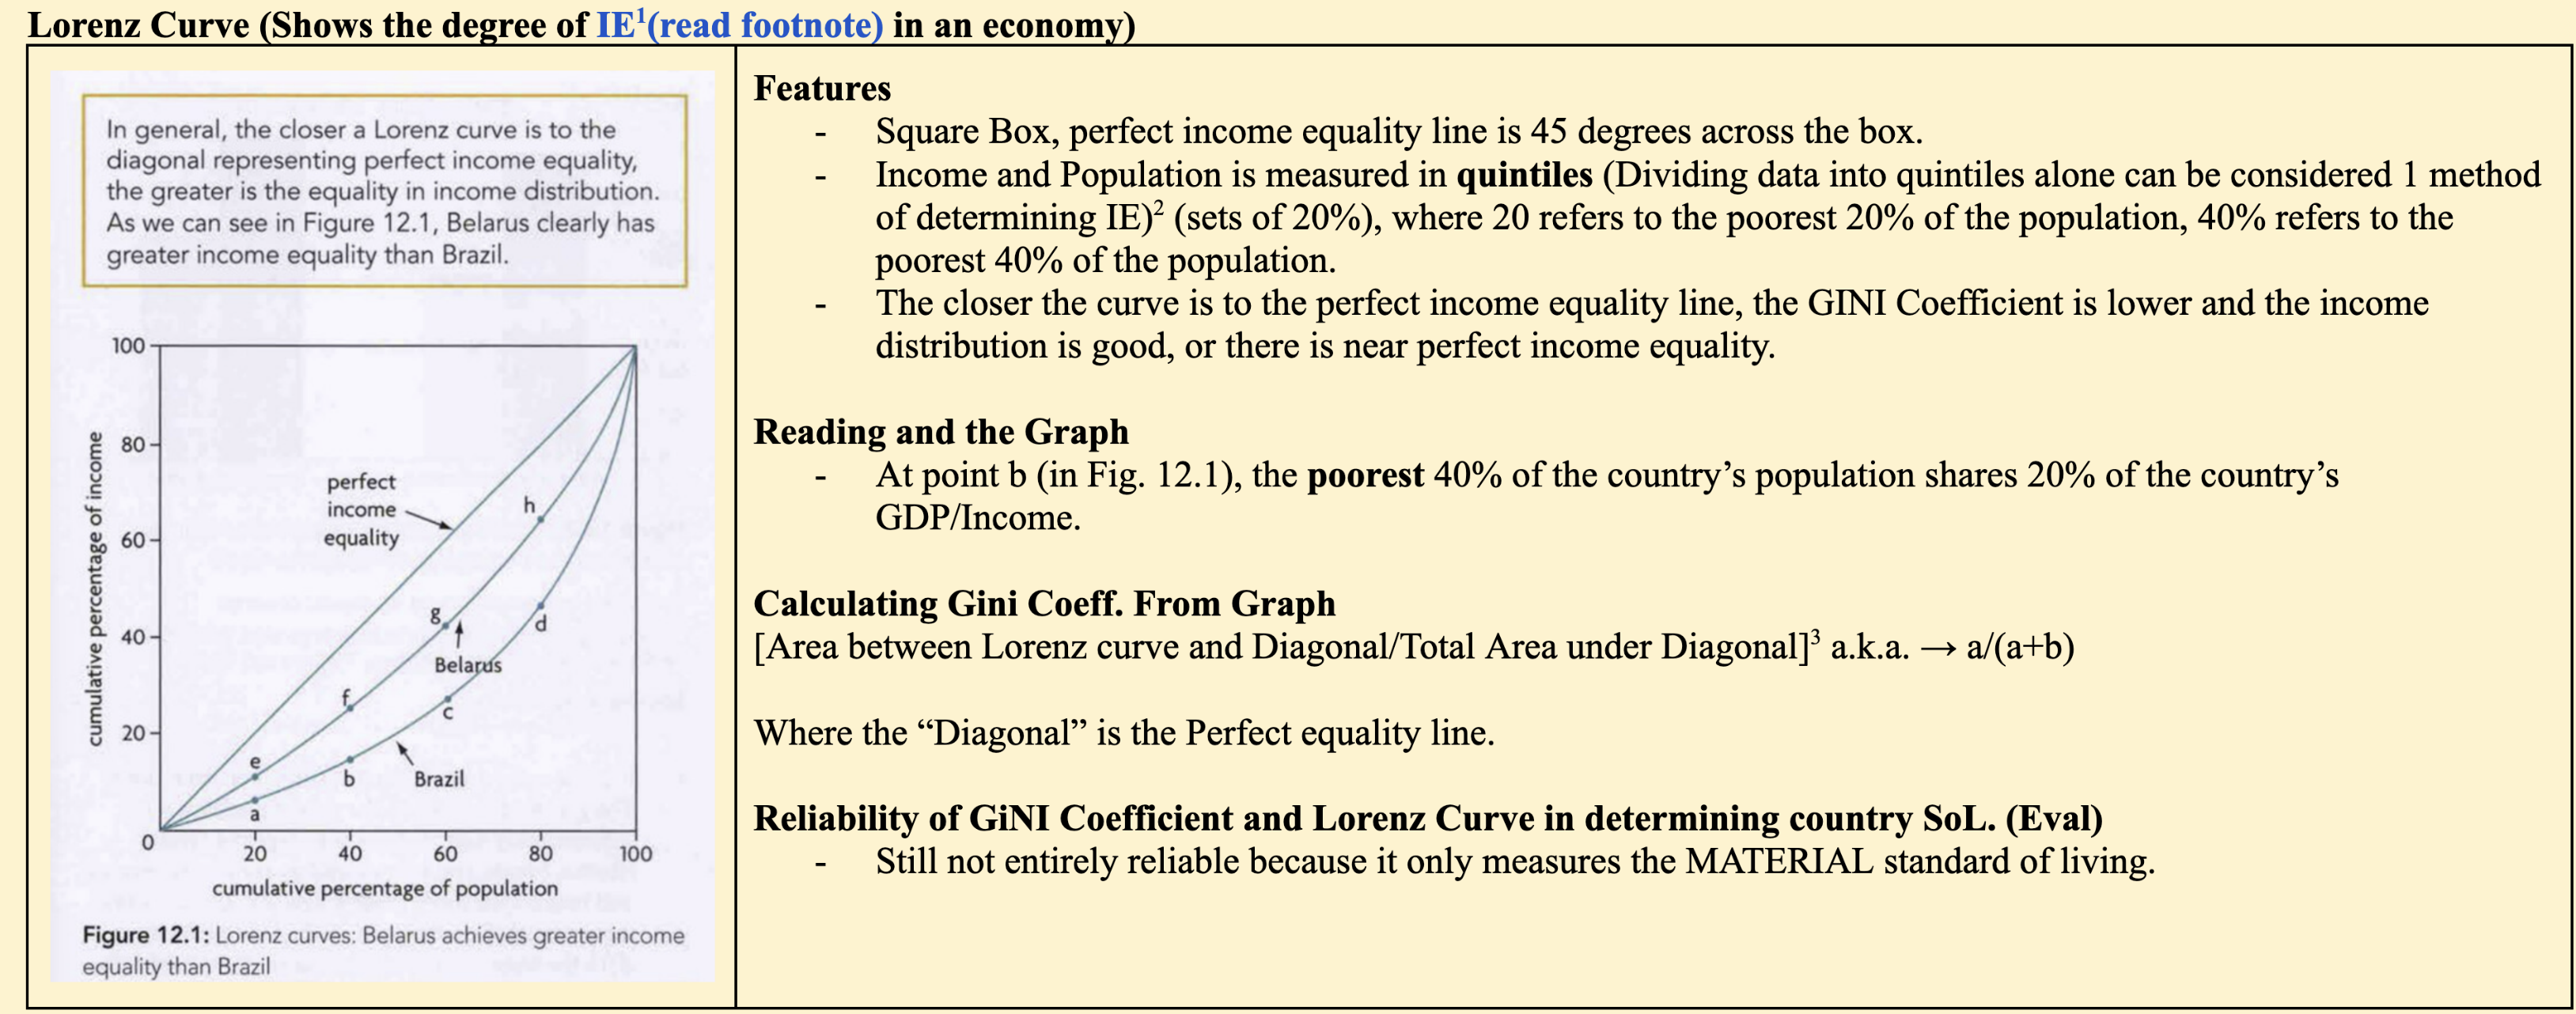
Explain the lorenz Curve.
Define Gini Coefficient.
A measure of the degree of income inequality in a country, a value from 0 to 1, where being closer to one represents a greater degree IE and being closer to zero indicates being closer to the desirable level of income inequality. /the line of perfect equality.
Key reminders when plotting lorenz curve (AHL)
Fairly simple, when given data simply plot points and connect the points. It is important to note the cumulative nature of the data given, that is, you must add the percentages to find the next sets of data for both axes etc. (Do some P3 practises on this)
Is wealth inequality or income inequality more severe? and Why?
The distribution of wealth is generally far more UNEQUAL than the distribution of income in most countries due to various factors.
Most countries have limited growth in wage markets, social and income mobility is thus hard.
High-income individuals consume smaller fractions (percentages) of their income, thus they have greater possibilities of saving and accumulating wealth.
Greater income → more wealth to buy assets → Assets lead to even more income, increasing the wealth.
RWE: USA 2015, the share of income that came from wealth (assets & investments) for the richest 1% was 60%. while for the bottom half, it was 5%
What do shifts in the Lorenz Curve signify?

Define Poverty
Defined as the inability to satisfy minimal consumption of needs.
Define a natural poverty line.
n income level that is considered minimally sufficient to sustain a family to meet basic human needs.
Explain/define Absolute Poverty
Defined: Refers to a situation where a person or family does not have enough income to meet basic human needs, and that person earns below the universal poverty line.
explain/define relative poverty
Where individuals have (Substantially) lower incomes relative to the societal median.
Conventionally, individuals who earn income that is below 50% of the median income are considered to be in relative poverty. Ie. If the median income per month is 5k, individuals earning below 2.5k a month are in RP.
Ways of Measuring Poverty (2)
Minimum Income Standards (MIS) is a method to measure poverty which involves producing a budget for a basket of essential goods (Eg. Includes childcare, housing, social participation costs etc.) → Then calculate the minimum income required for different family types (according to the no. of ppl in the family, the geographical location, age, races, etc)., and compare how many people are able to meet this income.
What the MIS reveals
1) The number of people living below the minimum income to buy the essentials
2) the relative contribution of each item in the basket to a household's abilities to achieve MIS
3) How these two factors change over time.
RWE: MIS Started in the UK in 2008, several countries are currently piloting using this metric (Sg, africa, mexico, portugal, etc.)
2) Multidimensional Poverty Index (MPI)
Each dimension in the index reflects deprivations (essential things ppl do not have) and are measured by 10 indicators:


To be considered poor/impoverished, people must be deprived of at least a third of the indicators.
Multidimensional Poverty Index (MPI) of the World Bank
Was created as the World Bank recognised MPI’s limitations in accounting for access to healthcare, secure community/crime rates/other non-material. They proposed these new dimensions

Explain the Difficulties in Measuring Poverty (5)
JPoverty has different meanings and different approaches to measurement
There are various definitions of poverty and how it is interpreted (ie. There is abs. and rel. poverty.). There are various methods of measuring it as well (Ie. 1) Measured using income & Lorenz Curve etc. 2) Measured using deprivations & World Bank MPI etc. These methods are not constituent with each other.
Difficulties in Collecting Accurate Data on Income
Poverty is often measured on a basis of household income. (Firstly, this does not account for the wealth and savings people have ie. a rich guy like donald trump who takes $0 salary may be counted as being in poverty)
But secondly, income data is collected using household surveys, which also have major limitations:
Such surveys don't include the homeless or those with no access to the internet or the survey platform. (These are people much more affected by poverty)
Income may be understated if people don’t consider their income from wealth and investments or in cases where there is freelance work.
Limitations of the calculation Methodology
While poverty lines tell us how many people fall below the poverty line, it doesn’t tell us to what extent they fall below the poverty line. (If most people are only slightly below the line vs ppl are far below the line, there is a clear difference in poverty levels but this isn't reflected.
Government Bias in Overstating Poverty Line: In order to justify receiving more unilateral aid or assistance, some governments may fake that they are in greater poverty than they actually are.
Government Bias in Understating Poverty Line: Governments may understate poverty to similarly avoid or justify less spending on poverty reduction.
Causes of Economic Inequality and Poverty in General (13)
Inequality of Opportunity: A difference in the potential outcomes in standards of living that arise from circumstances beyond one’s control. The World Bank terms this the “lottery of birth”. Explain how these factors are important in determining the success outcomes of people: Parent's level of income, education, country of birth, gender, race, etc.
In the real world, growing economic inequality cannot be explained solely by factors within peoples’ control such as hard work and determination, a lot of studies find how IoO is a big factor in inequality.
RWE:
1) An early study of six LATAM countries found that circumstances over which people have no control (specifically father’s occupation, parents’ education and region of birth) contributed to at least 25% of inequality in Columbia & at least 51% in Guatemala.
2) A study over 41 countries found that circumstances contributed to EI 4% in Norway and 40% in Mali.
3) Similarly 31% in the UK and 45% in the US.
Different Qualities of Labour/Different levels of human capital (Obvious)
Simply, lower skills = Lower Income.
Different Levels of Resource Ownership (Obvious)
People with wealth can buy assets (like properties) that exponentially increase the wealth gap. (Ie. People with properties will not have to pay rent (Only gradual and comfortable mortgages) unlike those without, and rent obligations can prevent the low income from building up their wealth. Assets (Like stock and property) can also provide the rich with secondary sources of income.)
Discrimination
Some countries pay women relatively lower than men than other countries. Women in most countries have lower income and lower wealth and pensions.
Unequal Status of Power
Eg. The rich and powerful in the USA, Taiwan, China, etc can influence global and political events that favour their own interests.
Government Tax and Benefit Policy Structures
Progressive vs Regressive vs Proportional taxes may be responsible for inequality or the lack thereof.
Extent of government subsidies for the poor and transfer payments as well.
Technological Change
Tech especially automates and replaces low income, repetitive jobs, often the high income benefit as they are the ones selling this replacement tech and they're the ones perpetuating it.
Market-based supply-side policies
High Abnormal profits of firms with high market power. (AHL)
Exploitative monopolies can exploit the poor and channel money toward the rich, ie. by setting high prices for all consumers, low income consumers spend a great proportion of their income on the necessary goods,and this money is transferred to the rich owners of the firms.
Increasing pay of higher level executive positions
RWE: USA’s ratio of CEO-Worker pay increased from 20 to 1 in 1965 to 300 to 1 2013
Globalisation
Responsible for increased tech, labour offshoring (stagnant wage growth), and other factors.
High Structural Unemployment
UE Benefits are often temporary, if governments don't fix pertinent structural UE, families can go poor.
Aging population
Older folks receive less pensions or even no pensions if they take on illegal work (which often happens due to their lack of skills for normal jobs)
Poverty
Cycle of poverty (Chapter 19)
explain how economic inequality impacts economic growth.
High inequality slows economic growth by reducing investment in education and human capital, limiting opportunities for the poor.
Countries with more equal income distribution tend to experience more sustainable growth.
Richer groups saving more and investing less locally can lead to lower domestic economic activity.
Political control by the rich can lead to policies that prioritize elite interests, reducing public spending on essential services (education, healthcare, infrastructure).
Explain how economic inequality affects living standards
Limited access to healthcare and education worsens job prospects and perpetuates poverty.
Higher infant and child mortality rates result from poor maternal healthcare and nutrition.
Higher illness and preventable diseases arise due to poor hygiene and malnutrition.
Explain how economic inequality affects social and political stability.
Rising inequality leads to social division and reduced trust in institutions.
The wealthy influence policies (e.g., tax benefits) to maintain their power, worsening inequality.
Growing dissatisfaction among lower-income groups can lead to social unrest and instability.
Polarization increases, making it harder to reach political consensus.
How do we evaluate and distinguish the types of taxation and their respective effects on decreasing inequality?

Give examples of Progressive Taxes (4)
Thereafter, explain the mechanism that allows it to promote greater income distribution.
Direct Taxes (Income Taxes): Taxes paid directly to the government tax authorities by taxpayers, examples include:
Personal Income Tax (Paid on all forms of income that is reported)
Corporate Income Taxes (Paid on the profits of corporations)
Wealth Taxes (Taxes on assets from wealth, eg. property taxes and inheritance taxes.
Social Insurance/Social Security contributions or payroll taxes (Eg. CPF)
Explanation:
Higher income earners pay a larger proportion of their income (higher percentage) than the low income workers, this reduces the disparity/differences in the levels of disposable income (income after tax) between low and high income workers, thus reducing income inequality.
THE INCOME GAP NARROWS VIA REDISTRIBUTION AS WELL, BUT BE VERY CAREFUL IN EXPLAINING THIS VERY CLEARLY: the transfer payments and subsidies increase the disposable income of the low-income.
DO NOT EXPLAIN IT LIKE: “The taxation amounts reduce the wealth.. Redistributed via subsidies to the poor, reducing the income gap etc.” This is WRONG/INCOMPLETE As this does not explain the reduction in INCOME inequality, it better explains an overall reduction in WEALTH inequality, which is not the requirements of the question.
Weakness and Limitations of progressive taxation and susidies.
Creates ‘crutch mentality’ for low income hh → that is they become over reliant on these tps and subsidies → disincentive to work → disincentive to upskill, → creates significant LR problems as it would have to devote increasingly more funds to UE benefits, straining gov budget.
Additionally, hampers productivity and pot EG → bc there is a segment of the pop who are not incentivized to upskill and seek employment, as if they seek employment they will even lose the free money from the gov.
Prog income tax also reduces incentive to work, reducing effective lab supply → Eg. if you are paying - like in UK – 45% income tax, → leading also to brain drain (ppl moving to work overseas)
RWE: UK Supertax, 20th century 95% tax rate on highest earners, many britons brain drained and migrated to other countries in the hopes of earning higher DIs → Loss in skills, low productivity, low EG, low actual EG, AD falls
benefits of prog tax
Strengths
Promotes Economic Equality and Equity → Effective at redistribution
Funds Public Services (Gov Funds) → Social benefits
Prevents Wealth Hoarding → Limits excessive wealth among the rich.
Name, explain, and evalute all the policies to combat income inequality.
1) PROG TAX
2) Investment in human capital
Strength: Providing free and equitable access to education like Singapore helps limit inequality of opportunity. As more lower-income ppl get access to education → greater chance of getting a stable job in future → stable income allows them to build up their wealth → climb the social ladder out of poverty. AND Education makes them more financially literate → Better management of finances → prevent them from squandering, learn about investments → build up wealth faster → Higher standard of living.
RWE: Africa 60% of the poorest quintile of youth have less than 4 years of schooling compared to 15% for the richest quintile.
Weak: Uses government funds. Highly dependent on worker willingness. On their aptitude and attitude, (refer to more explanations in VOL 2 Qn 8)
Weak point 1: However, this policy has uncertain outcomes. Much is dependent on the workers themselves, their willingness to undergo training, their receptiveness to the training, their ability to upgrade, ad even their awareness of the policy’s existence.
Explain it as a form of SSP aimed at increasing skills of workers AND ensuring their skill sets remain relevant
RWE: SG WTSS, provides subsidies and allowances to workers earning below 2k per month to attend upskilling workshops.
Reduces inequality of opportunity, allowing them to improve skills despite lack of money, enabling them to work in higher paying jobs
Also ensures structural UE for low-skilled workers, as they are better equipped to handle changes to demand for skills.
3) Transfer payments.
Mechanism: Defined as payments made by the government to individuals specifically for the purpose of redistributing income away from certain groups and toward other groups → for eg. includes UE benefits… (see above) → More access to necessity goods → higher material standard of living.
Strengths:
Directly reduces poverty by redistributing income to vulnerable groups.
Encourages human capital development through conditional transfers linked to education and healthcare.
Supports economic stability by sustaining household consumption, especially during economic downturns.
Evidence: TPs contribute to estimated 75% improved distribution in most countries.
Weaknesses:
High cost for the government, leading to opportunity costs (less spending on other services).
Risk of dependency, as some argue that transfer payments reduce incentives to work.
Requires effective targeting to ensure funds go to those most in need.
4) Targeted Gov spending on merit goods
Mechanism: Governments can channel revenue from progressive taxes to provide for merit goods (goods with positive externalities and are beneficial for consumers that are under consumed and underprovided) → Increased accessibility and consumption of goods → increased SoL.
Strengths:
Addresses market failure by increasing access to essential goods like healthcare and education.
Improves social mobility by making education and healthcare affordable for low-income individuals.
Boosts economic growth by increasing productivity and reducing long-term inequality.
Weaknesses:
Budget constraints, as free or subsidized services require high government expenditure.
Risk of inefficiency if government programs are poorly managed.
May not fully reach the poor if infrastructure is inadequate.
5) Universal basic income.
A government program that provides all citizens with a fixed amount of money regularly, regardless of their income, employment status, or wealth. It aims to reduce poverty and income inequality while ensuring financial security for everyone. Aims to alleviate financial stress and promote innovation and entrepreneurship.
Strengths:
Reduces poverty and income inequality by providing a safety net for all citizens.
Encourages entrepreneurship and education, giving people financial stability to take risks.
Acts as an economic stabilizer by maintaining consumer spending during recessions.
Simplifies welfare systems, eliminating bureaucracy and reducing administrative costs.
Weaknesses:
Very expensive, requiring massive government funding, higher taxes, or cuts in other welfare programs.
May reduce incentives to work, as some people might rely entirely on UBI.
Resource misallocation, as high-income earners receive funds even when they don’t need them.
Difficult to implement politically, as governments may struggle to justify and fund such a large-scale program.
6) Min wage
Mechanism: Minimum wage is defined as a legally set price floor for wages → governments should raise the lowest permissible wage to above the labour market equilibrium.
RWE: US Federal minimum wage is USD 7.25 per hour.
This creates an effective wage floor where the minimum is above the equilibrium wage.
MW diagram. (with a steep demand curve for the labour market)
Assuming that the demand for labour is relatively wage-inelastic, this causes the increase in wages earned by low income workers to be more than proportionate to the fall in quantity demanded for the workers. Why inelastic? As this results in a net gain to the low-income workers, as the total income (of workers earning at equilibrium) increases and the distribution of income is improved. (Can analyse this rectangularly, show how the rectangle for income increases because the demand curve is inelastic, and is steeper. ) Since this policy is also relatively easier to implement and sustain than the previous two, with no fear of budgetary constraints.
Weaknesses of Minimum Wage Legislation
Results in unemployment as firms seek to cut costs → MW diagram, there is a permanent surplus of workers at the minimum wage, and a decreased quantity of labour employed. Qs of labour exceeds Qd. Those low-income workers who are retrenched as a result of the policy, will be significantly worse off than before as they now have no income at all.
Minimum wage could incentivise firms to find ways to increase automation to offset the increased labour costs, rendering more low-income jobs obsolete. For example, in recent years, McDonald's has been replacing cashiers and front end staff with ordering kiosks.
Additionally, minimum wage could result in the black market for labour, where low-income workers that are retrenched are forced to work unregulated jobs at wages below minimum wage. Backfiring the policy. And becuase these jobs operate outside of legal purviews, there are health and safety risks and concerns (No insurance, no regulated workers)
How does indirect tax affect income inequality?
Worsening Inequality: Indirect Taxation (Eg. GST and VAT) (All indirect taxation is regressive)
Indirect Taxes like GST and VAT are not based on income level and are based on the price of the goods bought. That means that a rich and poor person pays the same amount of tax when they buy the goods. Thus the proportion of income paid as taxes is greater for the poorer individual, making the tax regressive.
How to calculate the marginal tax rate.
Def: The textbook defines this as the highest tax rate paid (ie. the rate in the highest income bracket that the payer falls within) OR the rate paid on one additional dollar.
BUT, in terms of calculations, always take it as the highest tax rate paid on that income. Do not take “one additional dollar” because the one additional dollar may confuse you and you may go to the next tax bracket, when that is not the case. The marginal tax rate is the rate that is paid by the person and that is the highest rate.