Transcriptomics
1/16
There's no tags or description
Looks like no tags are added yet.
Name | Mastery | Learn | Test | Matching | Spaced |
|---|
No study sessions yet.
17 Terms
Types of transcriptomic data?
Microarrarys, RNASeq, for Epigenomics → ChIP-on-chip/ChIPseq: protein binding, Mnase-seq: nucleosome positions, ATACseq: open chromatin regions, RNAseq fusion detection
Explain the concept of RNA-seq
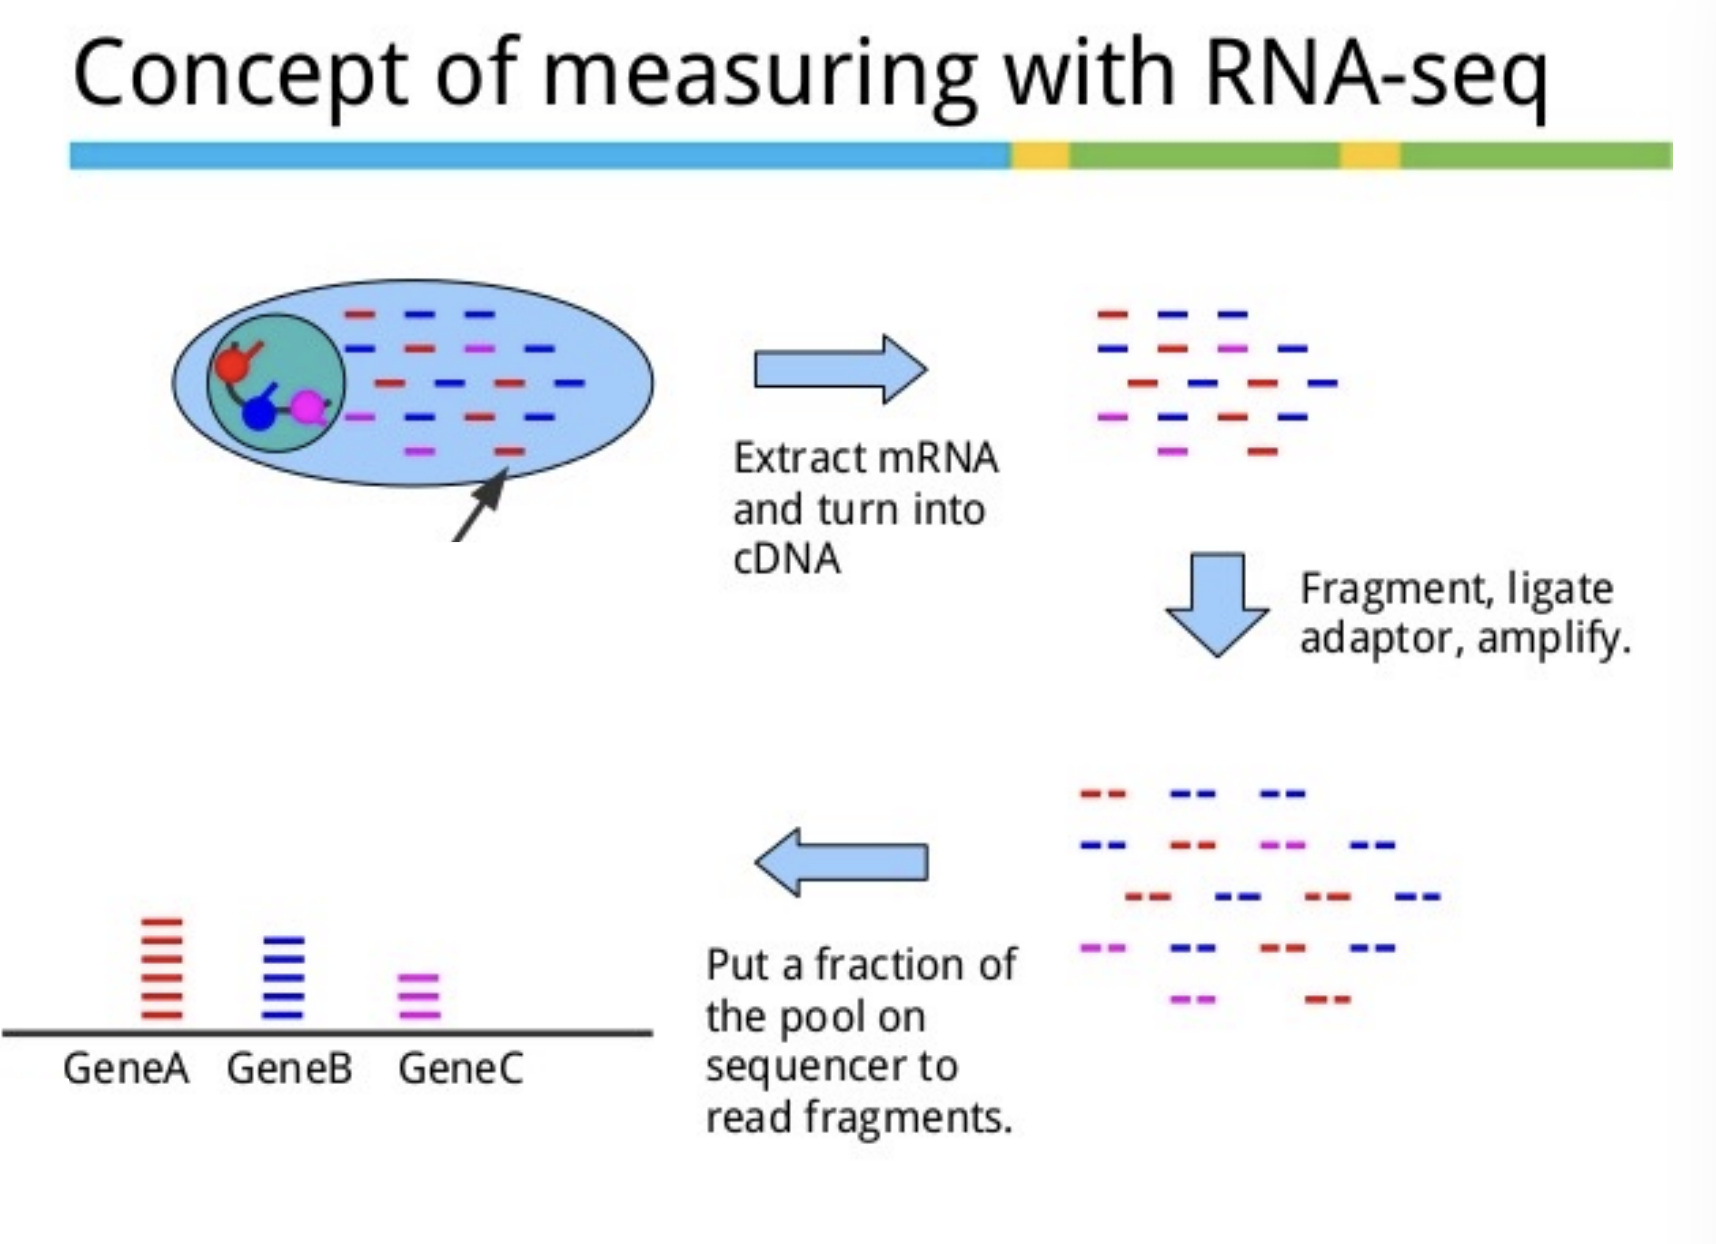
How to select for only RNA?
use polyA tails, use polyDT beads, mRNA but this is the minority, most is ribosomal
RNA more abundant than DNA
The problem is getting rid of ribosomal RNA → How? Kits, you can remove
MNase-seq, explain the method and why you use it.
In eukaryotes, DNA wrapped around nucleosomes
This technique uses a mild nuclease to digest linker pieces between nucleosomes
Used for nucleosome positions, done to study regulation
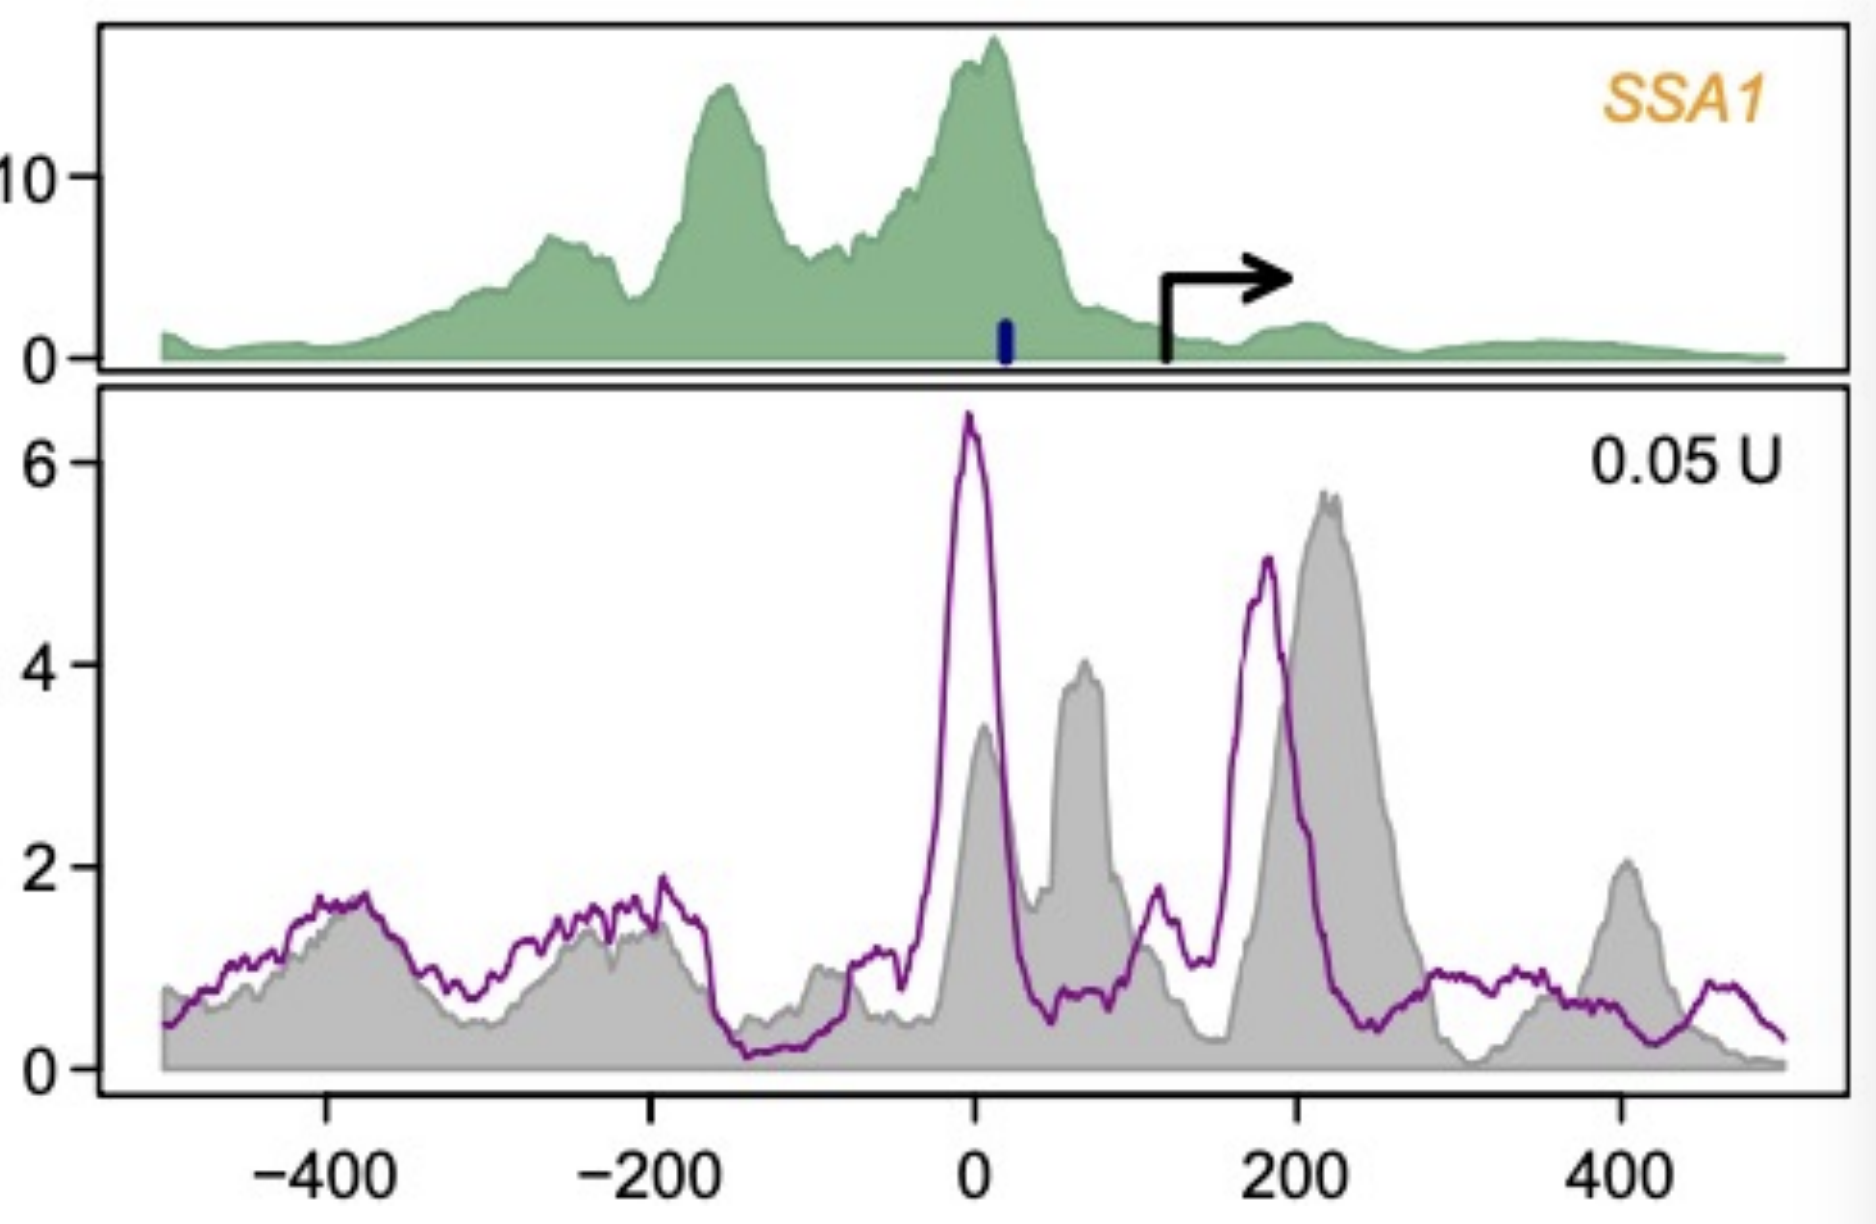
For below: you see that when you take away SSA1, you can see where the nucleosomes to bind, and it shifts left (purple) as compared to grey, and you see that there is more nucleosomes there, so it’s more stringently controlled
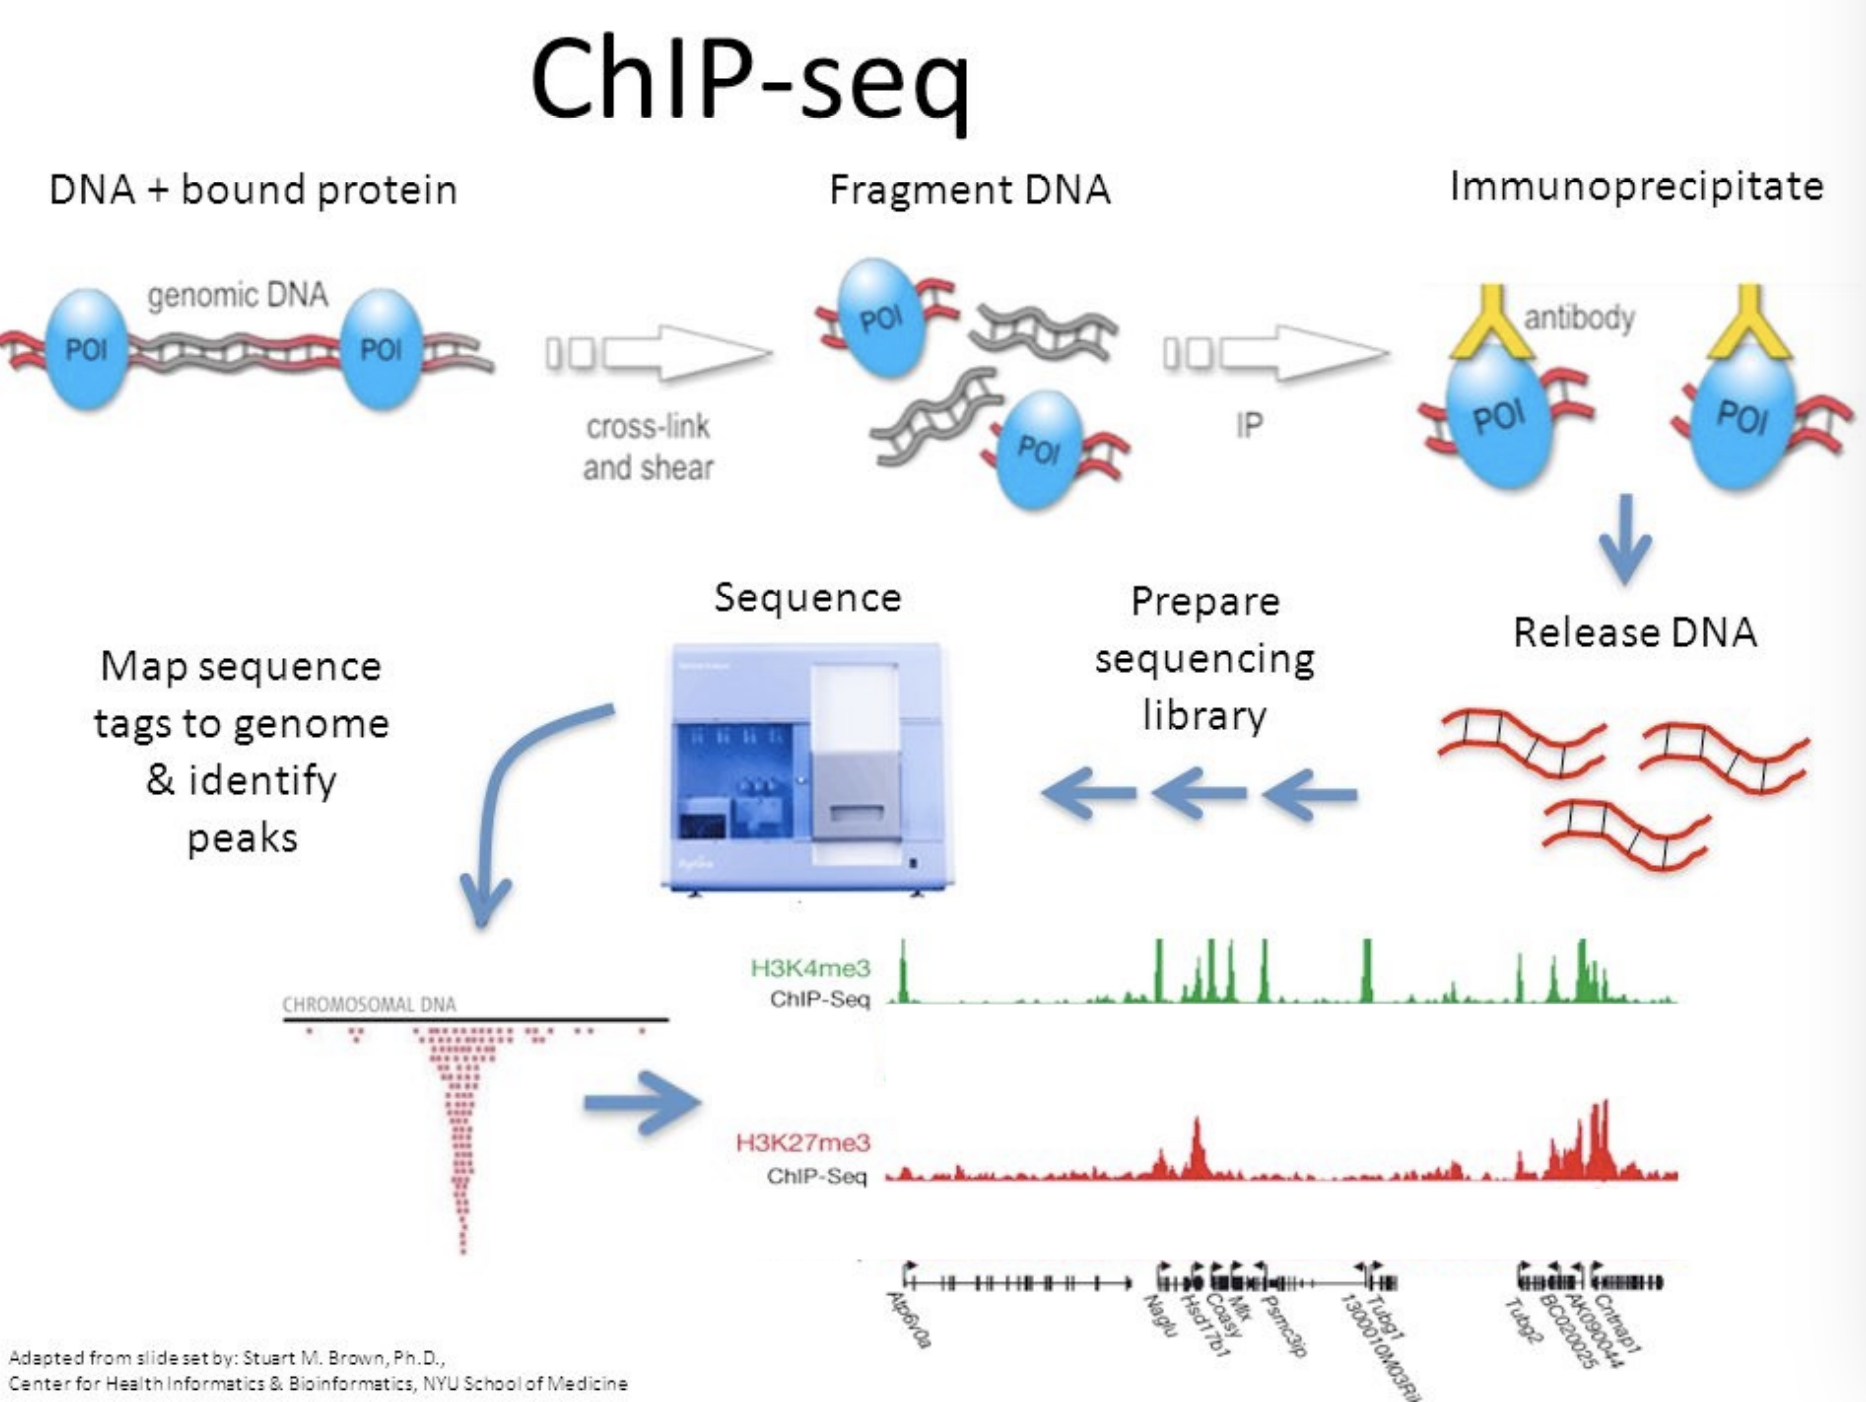
ChIP-seq, explain the method and why you use
Helps you find binding positions on DNA
Cross-link and shear DNa to get DNA that is protein-bound and those that are without
You’ll need an antibody to target ones with DNA, and you immunoprecipitate to identify them
Then you can release the DNA, and you have DNA sequences that used to be bound by POI
You can sequence, and see where the protein was bound specifically
This can be applied to transcription factors and the methylation status of histones
GOAL: find out which DNA sequences are being targeted so far
Why do RNA protocols have to be strand-specific?
After two-rounds of amplification, you don’t know the difference between the forward and reverse strands
You can see differences between strands
You shouldn’t mix up two strands! Two different genes can be on the same segment but opposite strands
The kit ligates an oligo with T7 promoter, so the RNA is strand-specific, the amplification is linear
Should you use single or paired-end sequencing?
Single end: okay for well-known, well-annotated genomes
Paired-end: less annotated genomes, you can resolve isoform differences and repetitive regions/genomes, you can use one mate for barcodes (single-cell seq), essential for MNase-seq, ChIP-seq, ATAC-seq, etc.
Above also good for fusion genes in cancer
Why look at gene-fusion detection?
They are important in pediatric cancer, eg. BCR-ABL1
You either use in situ hybridization, PCR across junction of fusions, or find chimeric reads (map partly to one, partly to another of the genome)
Two types: spanning reads, junction split reads
This is more expensive than FISH or PCR, many more fusions detectable, cheaper than WGS/WES, but tendency to find many false positives (artefacts caused by PCR, use a red herring list)
What is the pipeline?
Millions of (paired often) reads, of 50-150 bp
.fastq files: read id (for barcode), sequence and quality
Preprocessing: check quality (FastQC), trim adaptor sequences and bad bits (if present)
Remove PCR duplicates? → no deduplication is more harmful, you can recognize them through this “tabling” up on the depth coverage panel (above)
Instead, use UMI’s (unique molecular identifiers) added to each transcript → you can make a technical variability plot (looks at UMI’s, maps less like a cloud)
Mapping → you can use genome or transcriptome
transcriptome → faster, less noise, but limited (intronic transcripts are missing)
Genome → slower, more general (mapper must deal with introns)
STAR, hisat2, GSNAP → used for mapping, you then get a .bam file (and/or .sam file)
Mapping to genome: just chromosome coordinates, assigns reads to “features” from genome annotation
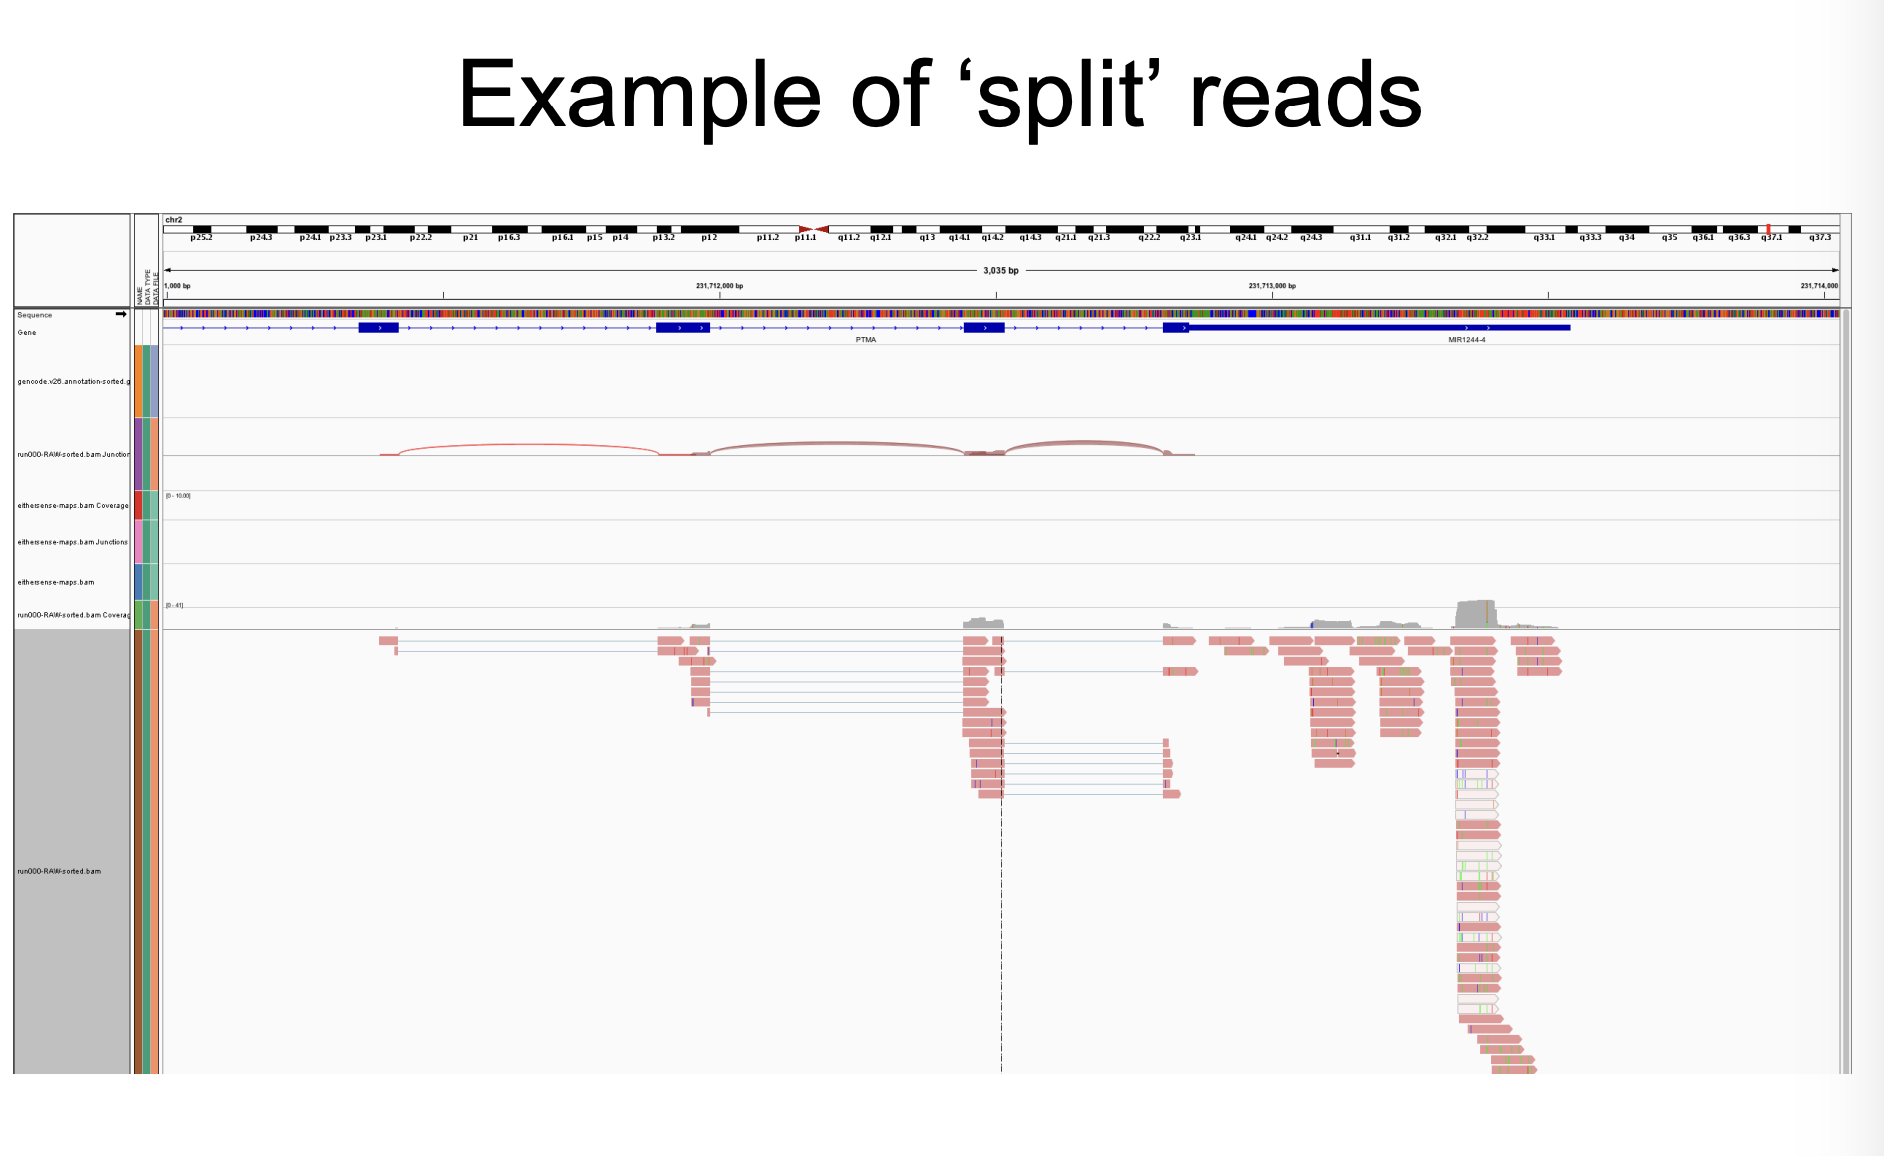
What do “split” reads look like?
Across exons
How to summarize counts?
By: gene, transcript isoform, exon (rarely expressed by themselves)
Expression value: height of the “pile up”
RPKM or FPKM (for paired end) (reads per kilo base per million reads)
But cDNA length distribution is not the same for different libraries
Nowadays TPM used (transcripts per million reads mapped) ← THIS IS BETTER, but don’t use for statistics (you need raw counts)
ALWAYS USE RAW COUNTS FOR STATISTICS
Single-cell RNAseq
Expression levels per gene per cel, plate-based (a few hundred FACS sorted cells), or microfluidic droplet-based (emulsion and cells merged)
Various applications: 3’, 5’ (for VDJ and T cell) expression, cell surface protein expression, ATAC, T- and B-cell receptor sequencing, spatially resolved sequencing, etc.
How to read t-SNE2 plot?
You look at distance between clusters (axes mean nothing)
What are copy number variations in tumours and why is it important?
CNV genes are amplified or reduced
You can look at this with RNA-seq, and if you plot them you’ll see a certain score for CNVs (high = tumour usually)
You can get an estimate of tumour percentage
What is fold-change (FC)?
ex: 2 fold change, etc.
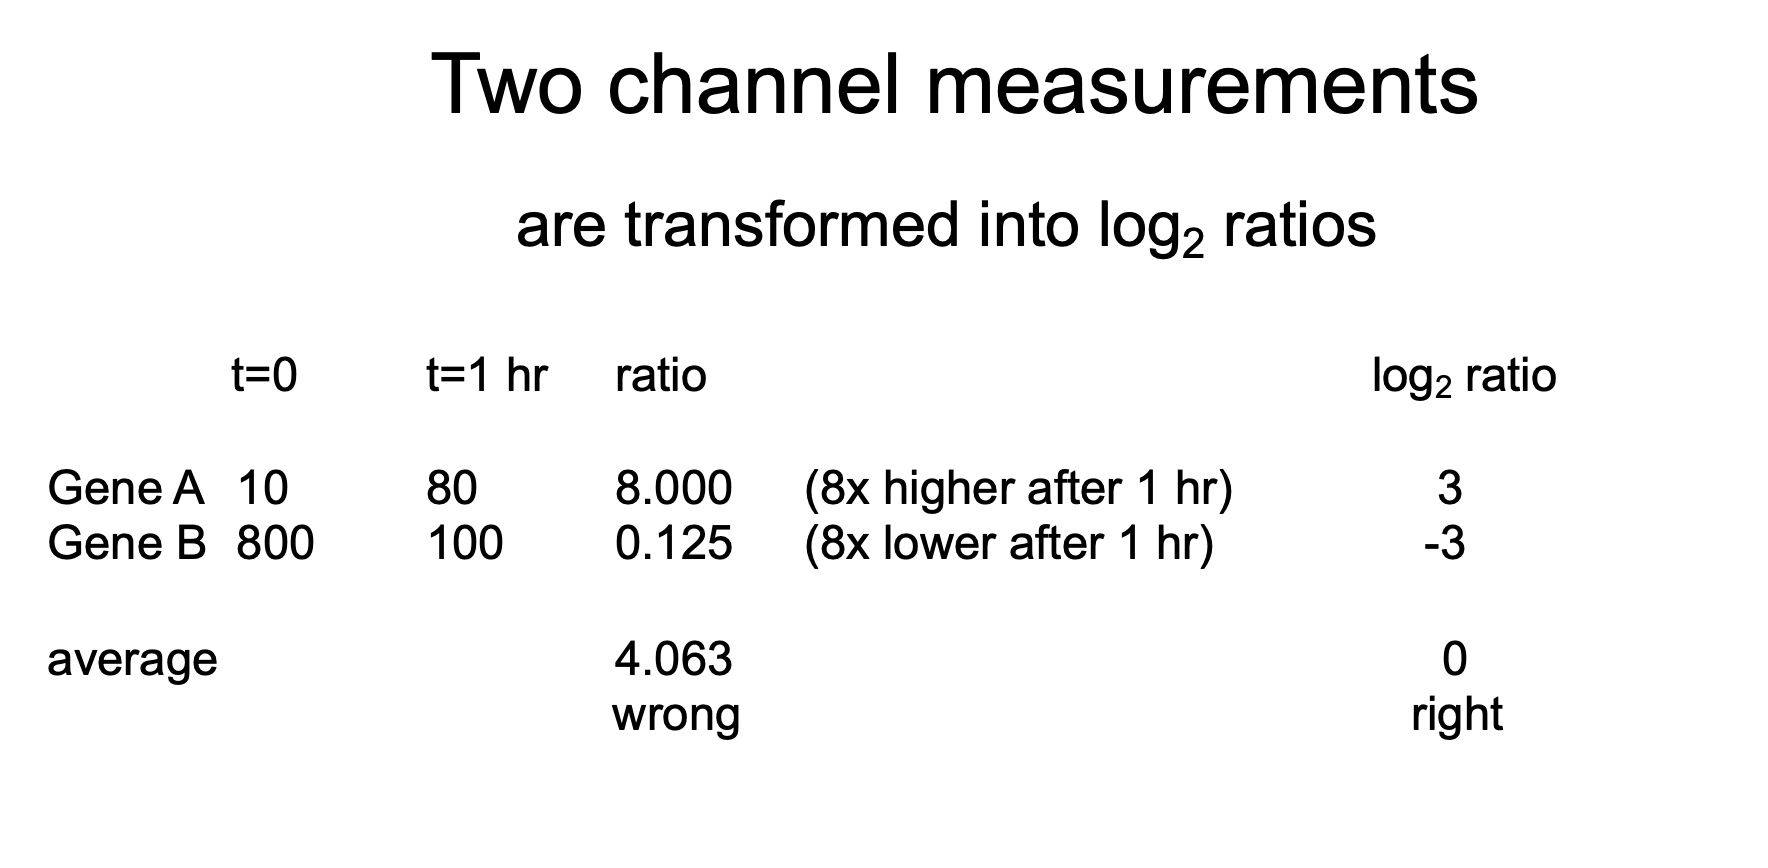
You look at the ratio between the treatment and the control, not the difference
Negative or downregulation is not as easy to read, so we use log
If you take an average of the two ratios, then it will be wrong
You need to use logarithms! log2 ratio of the ratios
If you take average of log2 then it should be 0
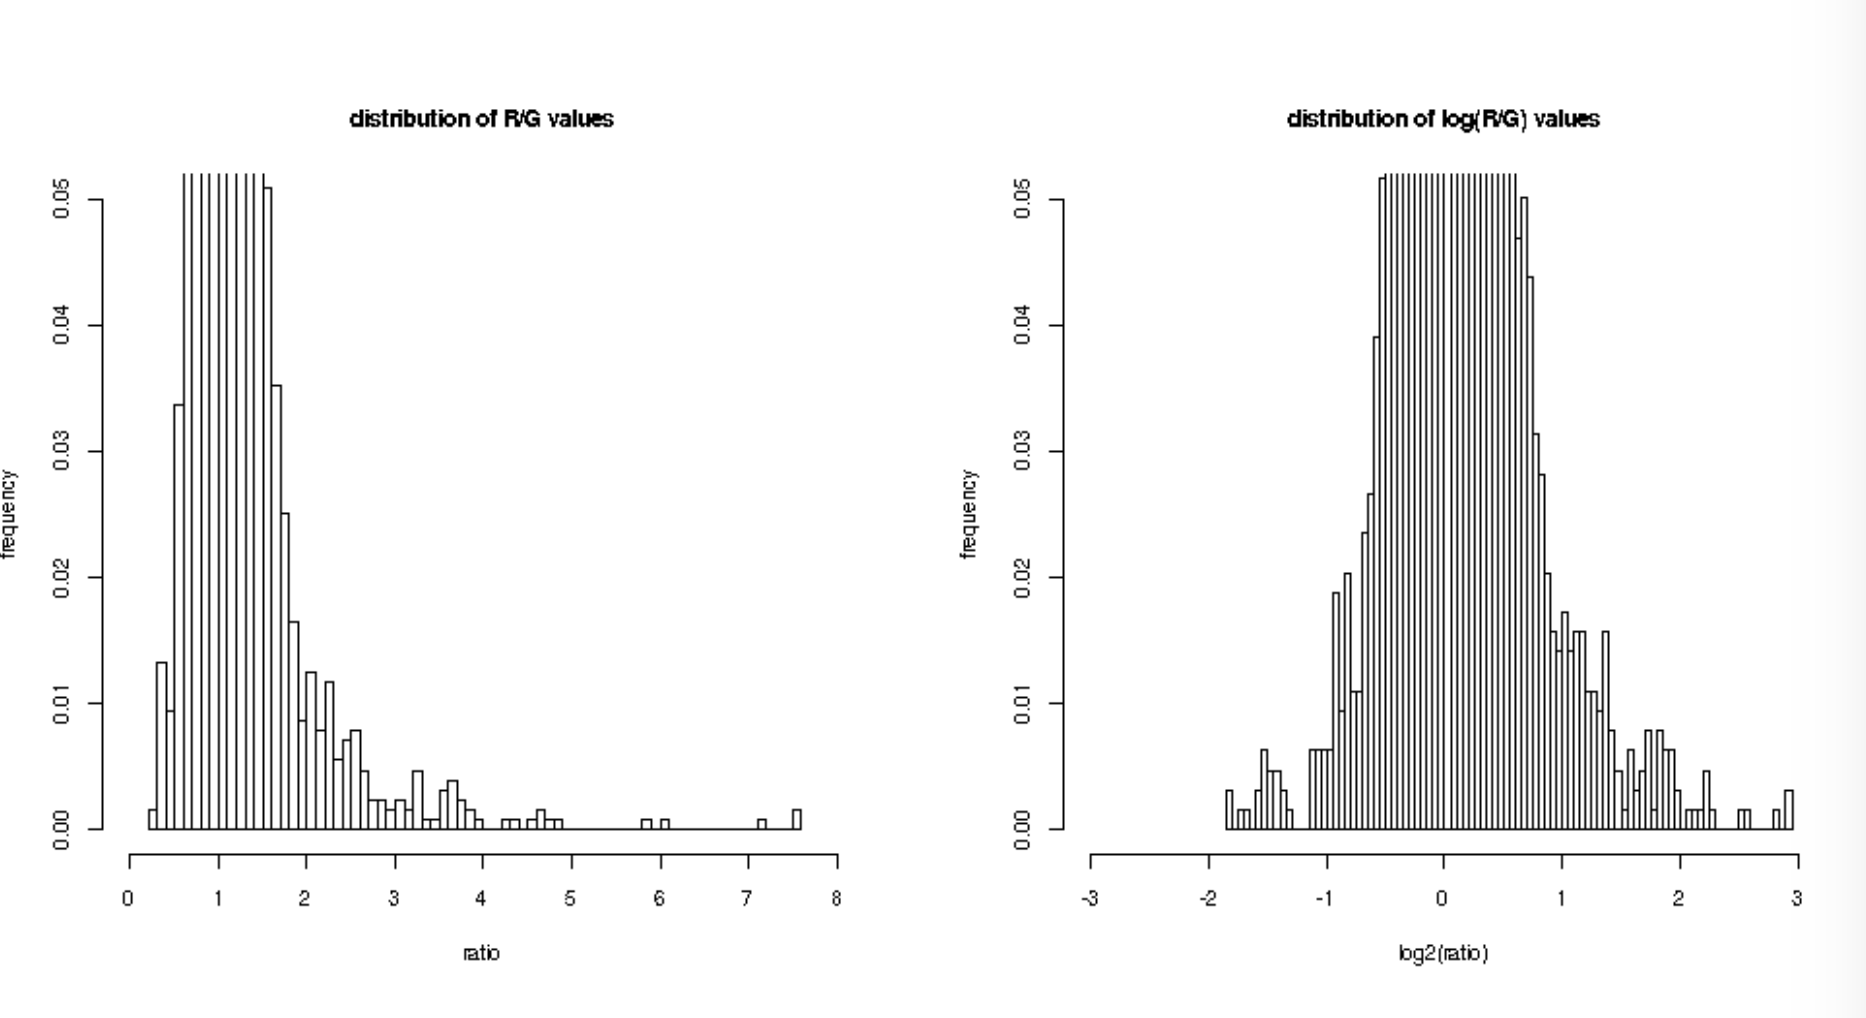
If you distribute (logged) ratio per gene (R/G)?
If you’re using non-log fold change: not normal
If you’re using log fold change: normal
What about normalization?
systematic differences between the signals from differently labeled material → pipetting inaccuracies, amount of material hybridized, efficiency of amplification
Balance the signals artificially, by assuming subset of features should give the same signal in each sample, transformation can be linear or non-linear
Housekeeping genes commonly used, but not the best method, because it isn’t expressed in the same level always actually
You can add known spike ins, sequences of other species, etc.
Use average transcription of all genes, for single-cell seq for each cell the total number of transcripts should be 10,000 (works for most cases, statistical method)